
You may already know that the financial market creates various common patterns during the price movement. A financial trader with specific skills to identify those patterns can catch more accurate and profitable trading positions than traders who don’t.
This article will introduce you to the bull flag pattern. However, it will be best to understand the story behind any pattern. Moreover, we will describe two trading strategies with a chart explanation.
What is the bull flag pattern?
The flag is a typical pattern that you can often locate at various time frame charts of financial assets. It usually appears within a trend, particularly an impulsive trend, and indicates correction. It appears at the bullish price trend of any financial asset. Inversely bearish flag takes place on an ongoing downtrend.
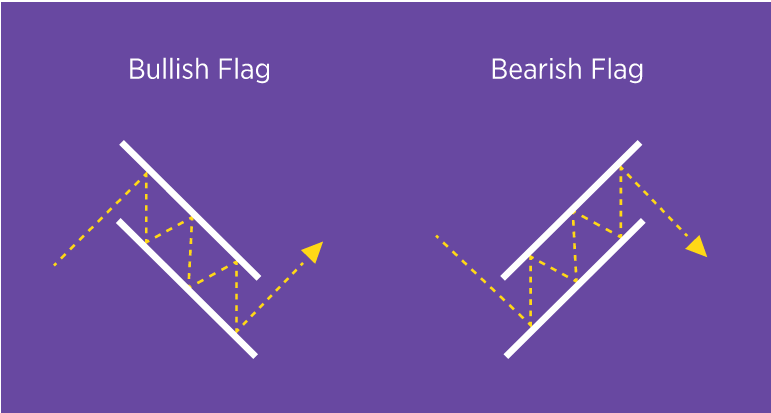
Different flag patterns
Some characteristics of this pattern are:
- Flag size remains within 50% of the pole.
- The bull flag signifies the continuation of a buy trade.
- A flag pattern is valid once a breakout happens.
- If the price retraces back more than 50%, it won’t be a flag pattern, and ideally, it often retraces back to 38%-50%.
- Flag range defines a trend consolidation.
- Flag pole candles are larger than flag candles.
- The flag contains at least three candles. For example, a bull flag in a daily chart has at least three bearish day candles.
How to trade with this pattern?
First, find it at the uptrend. It signals to place buy orders after a bulls flag breakout and retest. Investors worldwide love this pattern as it generates a strong buy signal. The slope of two trend lines forms the flag shape beside strong bullish movement at a flag pole.
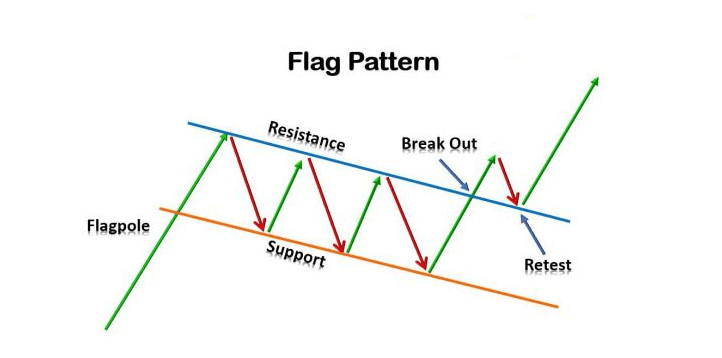
Bull flag pattern
It’s ideal for making buy orders when the price comes above the range of the flag. Initial stop loss will be below the flag range. Meanwhile, the profit target will be at the same upside distance as the pole above the flag.
A short-term strategy
Confirm the current trend from the upper time frames, such as 4-hours and daily charts. We use the moving average (50) line to confirm the current trend in our short-term bull flag strategy. An hourly chart shows the satisfactory result for this strategy.
Our hourly chart indicates that the current trend is an uptrend when price candles cross and stay above the blue MA line. Inversely, when price candles cross and remain below the blue MA line, it declares the current trend is bearish or seller domination on the asset price.
Bullish trade setup
The bull flag pattern appears in a buy trend and shows that the current momentum may extend. Wait for the consolidation phase at the uptrend and flag formation. Confirm that price candles remain above the blue MA line.
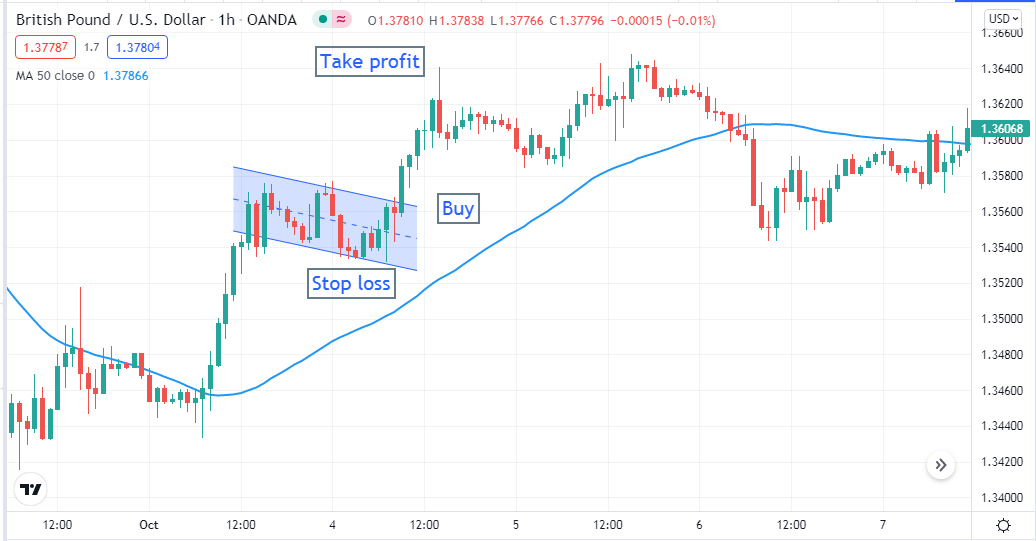
Bullish setup
Entry
When the asset price comes above the range of the flag, place a buy order.
Stop loss
Set a stop loss below the flag range with a buffer of 5-10pips.
Take profit
It will be the same distance above the flag as the flagpole.
Bearish trade setup
It takes place in the bearish trend. Confirm that price candles remain below the blue MA line.
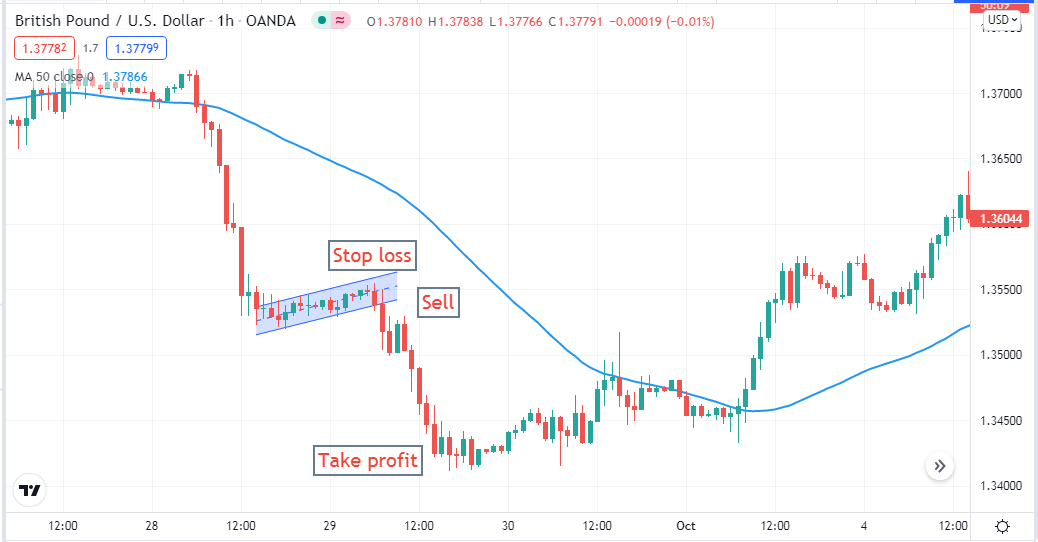
Bearish setup
Entry
When the asset price declines below the flag range, place a sell order.
Stop loss
Set a stop loss above the flag range with a buffer of 5-10pips.
Take profit
It will be the same distance below the flag as the flagpole.
A long-term strategy
Our long-term strategy uses a popular momentum indicator moving average convergence/divergence (MACD) beside flag pattern. This strategy works fine in any time frame; we recommend using it on the D1 chart to avoid intraday volatility. The bull flag pattern signals good buying opportunities for any financial asset.
Bullish trade setup
Check the scenario if:
- Price is on an uptrend.
- The dynamic blue line crosses above the red signal line of the MACD indicator window, and both head toward the upside.
- MACD histogram bars are green and above the middle (0.0) line.
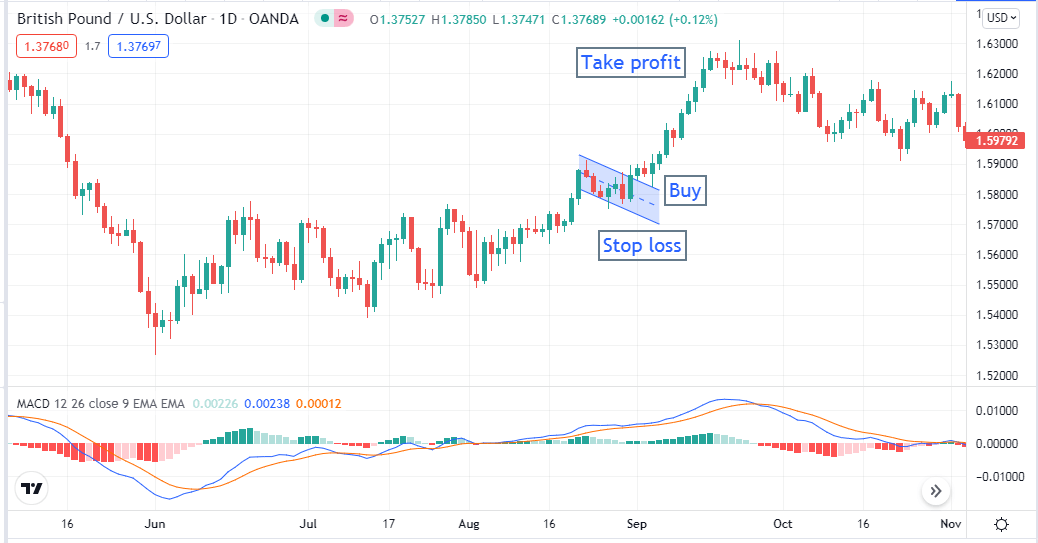
Bullish setup
Entry
When the conditions above are true, wait till the bull flag breakout happens. Then place a buy order.
Stop loss
Put an initial stop loss below the flag range with a buffer of 10-15pips.
Take profit
Set the profit as 100% of the flagpole.
Bearish trade setup
You will find selling opportunities when any bear flag appears. Bear flags look the opposite besides characteristics also contrary to the bull flag.
Check the scenario if:
- Price is on a downtrend.
- The dynamic blue line crosses below the red signal line of the MACD indicator window, and both head toward the downside.
- MACD histogram bars are red and below the middle (0.0) line.
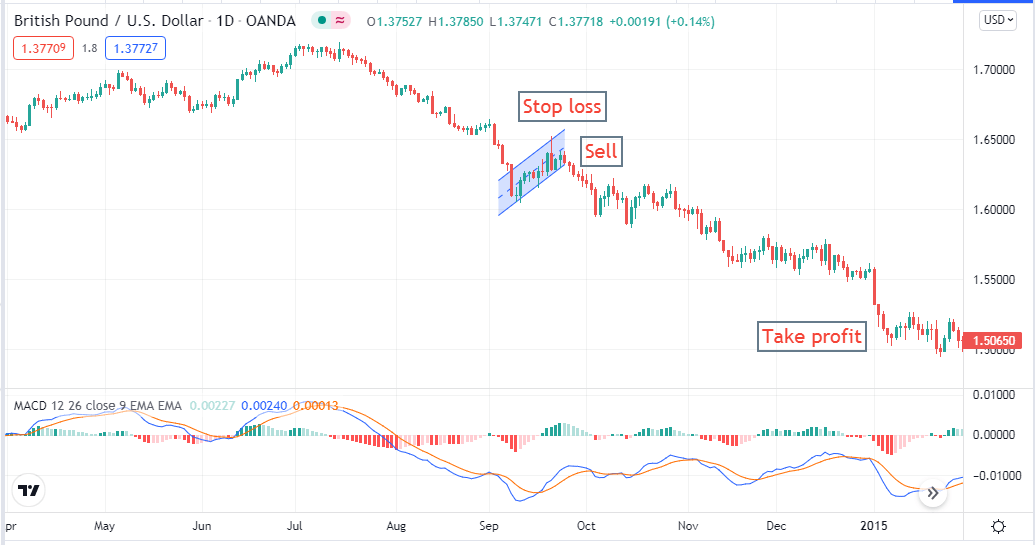
Bearish setup
Entry
When the conditions above are true, wait till the price breaks below the flag range. Then place a sell order.
Stop loss
Put an initial stop loss above the flag range with a buffer of 10-15pips.
Take profit
Set the profit target as 100% of the flagpole.
Pros and cons
| Pros | Cons |
|
|
|
|
|
|
Final thought
Finally, it is a potential pattern that can help you catch thousands of pips every month. Be careful making early entries with it; wait for the complete formation of the flag and breakout before making any entry.


Comments