
Today practically in all countries of the world, there is a market type of economy. Prices are regulated not by the state but by invisible but, therefore, no less real market mechanisms. Supply and demand, competition, global trends, and much more affect the price level.
However, you know all this very well because FX is also a market. Currency market. And on it, of course, there is demand (bulls) and supply (bears), as well as competition between traders.
By the way, about the competition. We are in the real world, where anything can happen. It is no secret, for example, that many large companies are taking over smaller competitors. This is called engulfing. And sometimes even gangster methods are used, such as raider seizures. Fortunately, there is nothing like this on FX. But there is an engulfing. And these are exciting candlestick patterns.
What is an engulfing pattern?
Engulfing or engulf is a candlestick trading pattern that can help you to find the level from where the price may fall. If you can find this pattern at a critical price level, you can reliably anticipate the price direction.
Another fact about this market is price moves by leaving patterns. In the FX, currency pairs move with the strength or weakness of the related currencies. History repeats itself in this market, so the technical patterns also. Among all those technical patterns, the ‘engulfing pattern’ is trendy. Professionals use this pattern very frequently to identify potentially profitable trading positions.
Let’s discuss this pattern in detail: how to read it, identify the up and down, and make profitable trading positions.
Basics of engulfing pattern
Before proceeding to the exact buy and sell methodology, we clearly understand this pattern.
Engulfing is a candlestick pattern that combines with two candles, changing the price direction completely:
- If the first candle is buying, the second candle is selling.
- If the first candle is sold, the second candle will be up.
Like pin bar candles — engulfing shows how the opposite party came into the market and turned the table down. This pattern has both up and down formations, as shown in the image below.
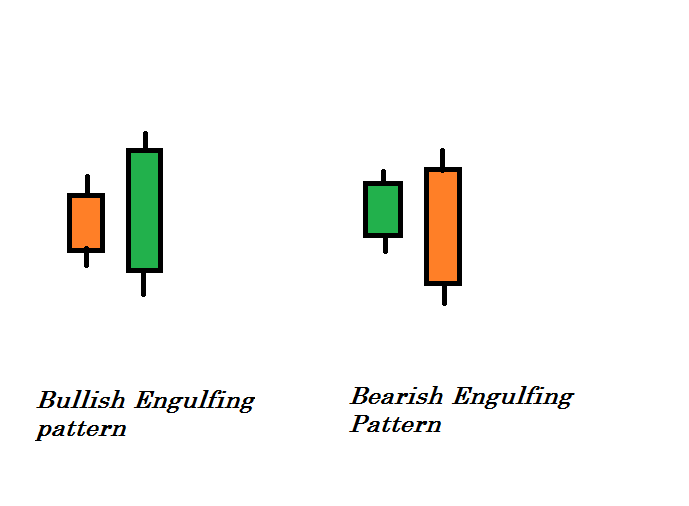
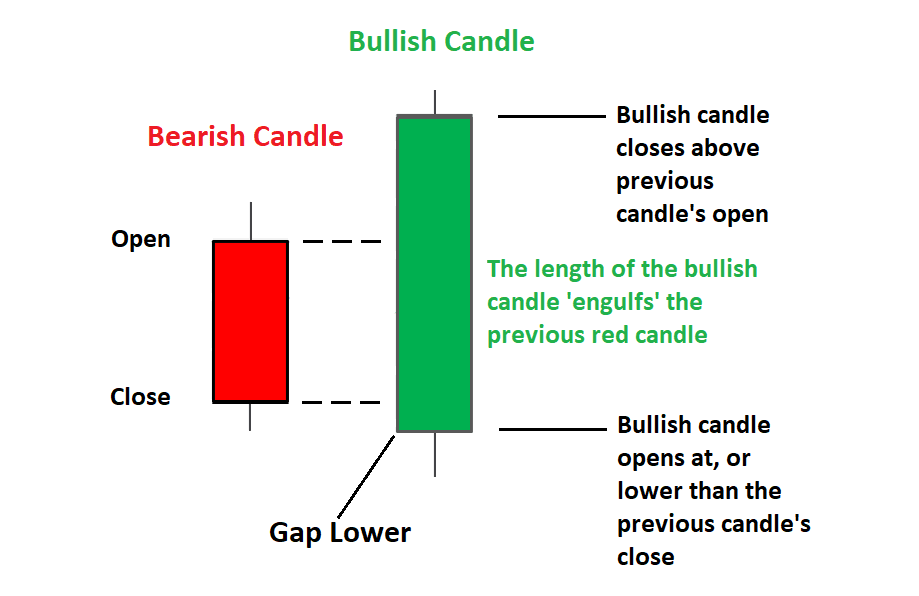
- The primary candle is red or sells in a bullish pattern, and the closing price is far below the opening price. However, the opposite party comes immediately on the next candle and turns the table down. As a result, a solid bullish candle changes the scenario. Remember that this pattern from a significant price level is only reliable.
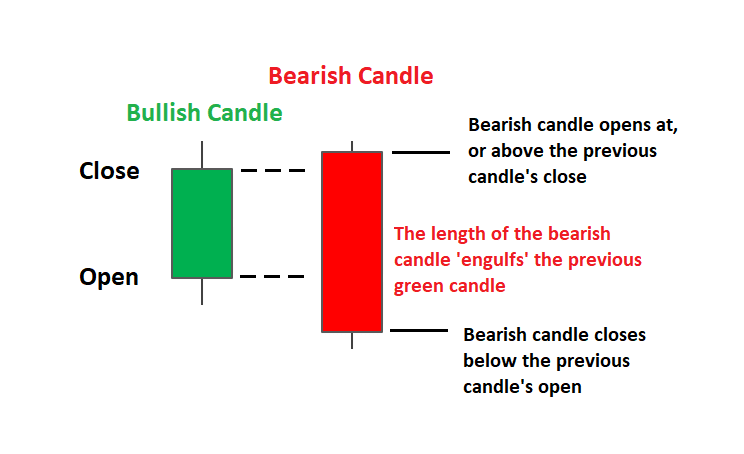
- The primary candle shows buyers’ presence in the buy engulfing pattern where the closing stayed above the opening. The opposite party comes immediately on the next candle and turns the table down. As a result, a solid bearish candle forms that cover the previous candle’s price action.`
What engulfing pattern tells us
To explain more clearly, you need some basic knowledge about the candlestick. In this pattern, you count the body of the candles, and it allows you to ignore the wicks that occur during price movement.
- The small candle means low volatility, and the sellers may lose control of the asset price. On the next day, when a big size candle forms on the selling side — complete a buy pattern.
- The big candle means more volatility and the buyers taking control of the asset price. So the trend may change from here, and the price starts to make an upward movement — an ideal place to put a buy order.

Similarly, a small candle seems on the resistance level, indicating that buyers can also lose control of the asset fee. On a subsequent day, while a larger bearish candle forms with the aid of engulfing the primary candle, dealers can also additionally manipulate the asset price and imply a stop of that bullish trend.
In that case, the fee may also begin to make a downward movement. So it’s far from a perfect area to place promotional orders. It is an easy rationalization of this pattern.
Bullish engulfing pattern trading system
In this part, we will see a trading methodology using the buying engulfing pattern. For instance, look at the figure below.
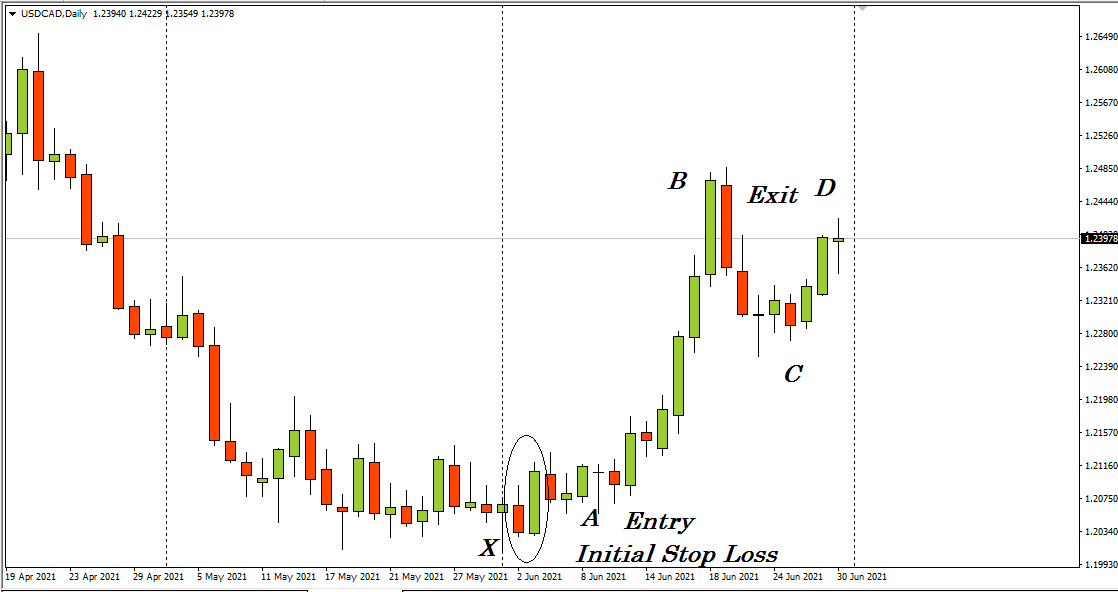
This figure shows a daily chart of USD/CAD. It is a perfect example of a buy engulfing.
- After a bearish trend, the small selling candle confirms low volatility, and the sellers may lose control over the price.
- On the next day, buyers came up and took control over the asset price. It indicates a perfect buying position.
- If you put a buy order here, the initial stop loss will be below the recent lower low of the downtrend near point X.
- Later on, when the price starts to move upward toward point B, you can place the stop loss at the breakeven near point A.
- After reaching point B, you can close the order or continue till point D or seek another buying chance near point C.
- You can make 370+ pips gain from a single order.
Bearish engulfing pattern trading strategy
To understand the ideal bearish engulf pattern, look at the figure below.
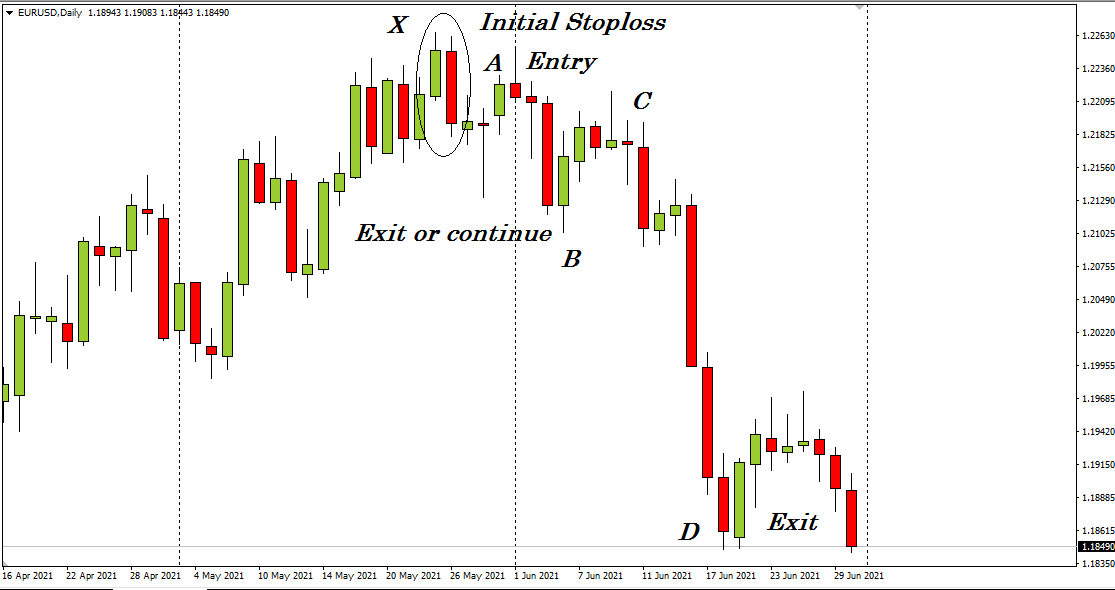
This figure shows a daily chart of EUR/USD.
- It shows an ideal bearish engulfing pattern at the end of the bullish trend.
- So you make a sell entry here near point A, and the initial stop loss will be above the recent higher high near point X with a buffer of 10-15 pips.
- When the price reaches near point B, you can close the order or shift your stop loss at the breakeven point near A to reduce risk.
- If you continue the order till point D, you can make more than 360 pips from a single order with a bit of risk.
Final thoughts
Finally, by observing all those examples and knowing all that information, it is evident that this pattern is very effective. You can make a potentially profitable trading position at both bullish or bearish conditions of the price movement by this pattern.
It is easily applicable, and the risk ratio is substantial. We suggest you do more research and apply to a practice account before using it on the trading account. Check the upper charts for more confirmation about the price movement as the price direction is toward your order.
Be more conscious of trading with only this pattern during the major macroeconomic trend-changing events such as interest rate decisions, GDP, employment data, etc. This technical pattern can help you catch potentially profitable trades but be aware of other factors that cause unexpected price movement on the currencies.


Comments