
You must know trading platforms besides several technical indicators when trading in the financial market. Trading indicators help traders to determine more precious trading positions, so technical analysts and developers create or modify many trading indicators to use them more effectively. The Money flow index is a unique indicator popular among technical analysts in the financial market.
However, learning the functionality and understanding the components is mandatory to generate the best trade ideas using any trading indicator. This article will discuss the Money flow index indicator and sustainable trading strategies using this tool.
What is the Money Flow Index indicator?
It is a momentum oscillator indicator that calculates several market data and shows it in an independent window. It contains a dynamic line that shifts in a range between 0-100. This indicator uses a default settings value of 14. The MFI indicator shares similarities with another popular indicator, the RSI. The primary difference is that the RSI indicator uses price info, whereas the MFI indicator works with the price data and volume info of any specific period.
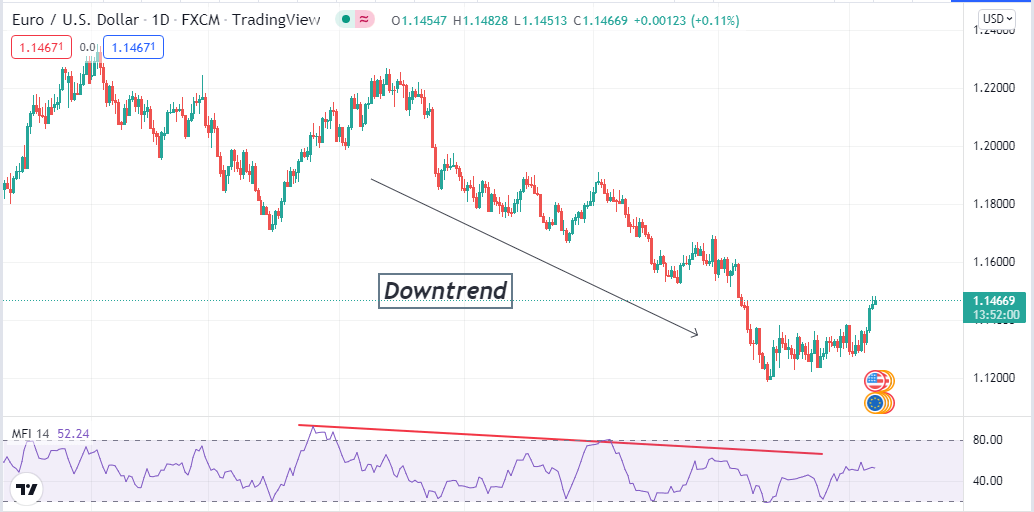
The MFI indicator on a daily chart of EUR/USD
Additionally, the MFI indicator declares an overbought condition when the reading reaches above 80% level. Meanwhile, a reading below 20% indicates an oversold condition on the asset price. The MFI indicator shows reading by accumulating positive and negative money flow values and creating a money flow ratio. Then it shows the result by oscillator form.
The MFI indicator uses a series of calculations:
First, the typical price
Typical Price = (High + Low + Close)/
Next, Money flow
Money Flow = Typical Price * Volume
Positive money flow is the sum of positive money over a specific period, and negative money flow is the sum of the negative money of a particular period. When the recent typical price is greater than yesterday’s, MFI considers it a positive Money flow. Meanwhile, if today’s typical price is less than the previous days, it is a negative money flow.
Finally, it calculates the money ratio by using the formula:
Money Ratio = Positive Money Flow / Negative Money Flow
How to use MFI indicator for trading strategy?
Let’s get to know the using procedure. Traders often use the divergence between the price movement and the MFI dynamic line. Suppose the price of asset X makes a peak near 15$ and declines back to 12$, and then again rallies to another top near 18$. Meanwhile, the MFI line doesn’t confirm another peak and stays flat or drops when the price makes a new high near 18$, which indicates a possible upcoming declining pressure on the asset price. Another use of this indicator is using the oversold and overbought levels to predict trend reversals.
A short-term trading strategy
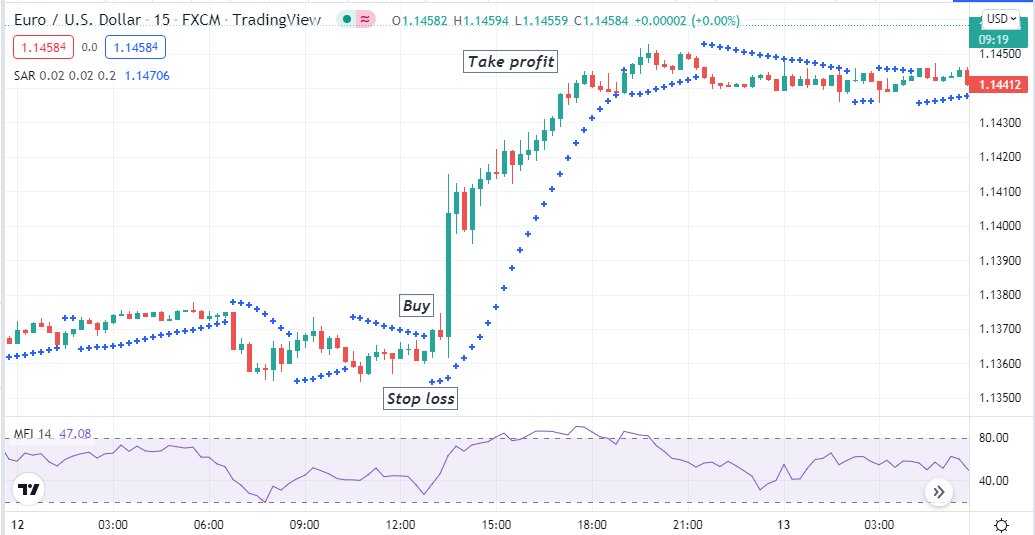
We use the parabolic SAR alongside the MFI indicator to determine more precious trading positions in our short-term trading method. We use multi-time frame analysis in this strategy. First, we determine the current trend from the upper time frame charts such as H4 or D1 charts. Then we seek entry/exit positions at 15-min or hourly charts.
Bullish trade scenario
Confirm the current trend is bullish from the upper time frame charts and seek to open buy positions when:
- The MFI indicator declares positive flow on the upside.
- Parabolic SAR dot takes place below price candles.
Bullish setup
Entry
Match these conditions above to confirm the bullish momentum and place a buy order.
Stop loss
Place an initial stop loss below the current swing low.
Take profit
Continue the buy trade according to the market context. Close your buy position when the bullish trend ends by reading the operating indicators. The MFI line reaches above the upper (80) level, declares the price on an overbought condition, or the Parabolic dot switches above price candles.
Bearish trade scenario
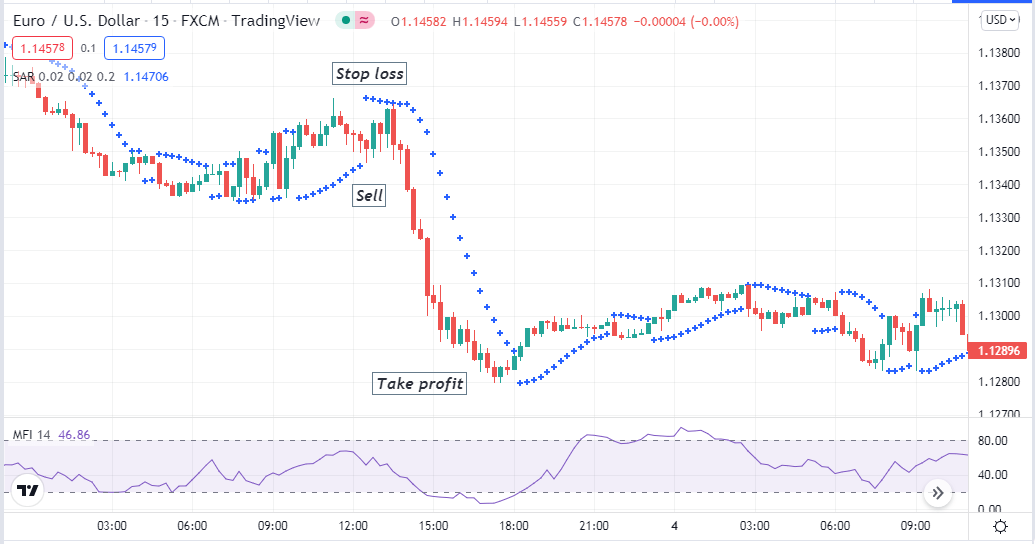
Confirm the current trend is bearish from the upper timeframe charts and seek to open sell positions when:
- The MFI indicator declares positive flow on the downside.
- Parabolic SAR dot takes place above price candles.
Bearish setup
Entry
Match these conditions above to confirm the bearish momentum and place a sell order.
Stop loss
Place an initial stop loss above the current swing high.
Take profit
Continue the sell trade according to the market context. Close your sell position when the bearish trend ends by reading the operating indicators. The MFI line reaches below the lower (20) level declares the price reaches on an oversold condition besides the parabolic dot switches below price candles.
A long-term trading strategy
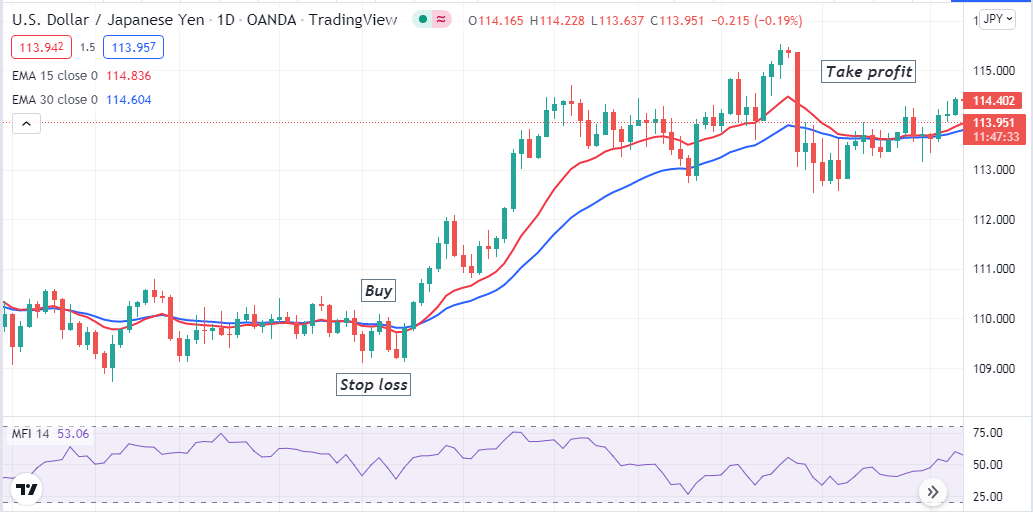
This long-term trading technique combines the MFI indicator reading with the MA crossover concept. This method identifies trades’ entry/exit points through EMA 15 (red) and EMA 30 (blue) crossovers. Then match that with the MFI indicator reading for confirmation before entering any trade. We recommend using this method on an H4 or daily chart to catch the most potential long-term trades.
Bullish trade scenario
Seek to open buy positions when:
- The red EMA crosses the blue EMA on the upside.
- Both EMA lines are heading toward the upside.
- The MFI dynamic line divergence confirms an increasing bullish pressure on the asset price.
Bullish setup
Entry
When these conditions above are proper, it declares sufficient bullish pressure to open a buy trade.
Stop loss
Place a reasonable stop loss below the bullish momentum.
Take profit
Define the reasonable profit target by analyzing the market context. Close the buy order when the red EMA crosses below the blue EMA.
Bearish trade scenario
Seek to open sell positions when:
- The red EMA crosses the blue EMA on the downside.
- Both EMA lines are heading toward the downside.
- The MFI dynamic line divergence confirms an increasing declining pressure on the asset price.
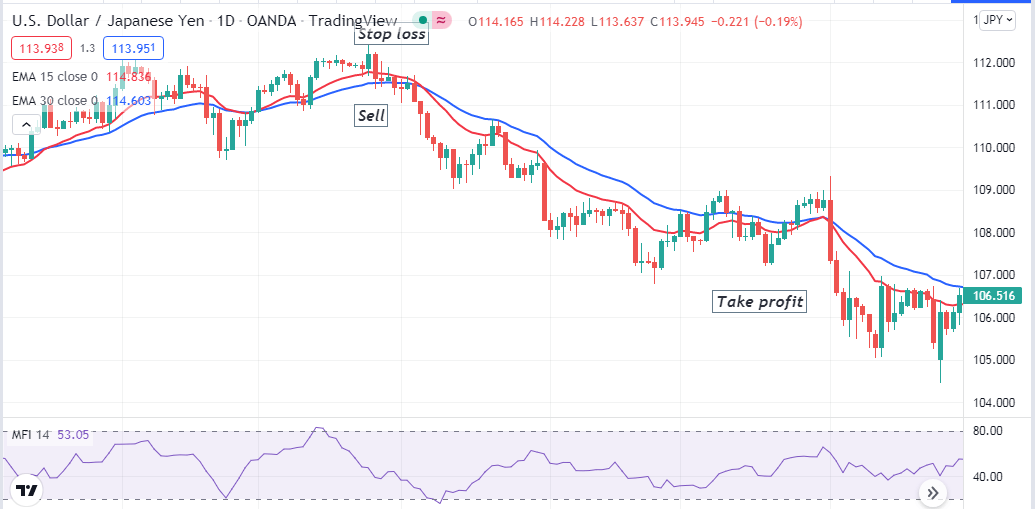
Bearish setup
Entry
When these conditions above are proper, it declares sufficient bearish pressure to open a sell trade.
Stop loss
Place a reasonable stop loss above the bearish momentum.
Take profit
Define the reasonable profit target by analyzing the market context. Close the sell order when the red EMA crosses above the blue EMA.
Pros and cons
| 👍 Pros | 👎 Cons |
|
|
|
|
|
|
Final thought
The MFI is a potential indicator that suggests trades by calculating various raw price movement data. It will increase your profitability and reduce risks in your executing positions. We recommend checking on the economic calendar to check on fundamental info and avoiding making positions using any of these MFI indicator trading strategies during major financial news releases.


Comments