The foreign currency exchange is mainly a business of banks and financial institutes. Still, it became a remarkable trading place for individuals and small firms after 1990 for its availability and attractive features. So there come profitable trading ideas based on technical/fundamental or some cases, both types of analysis by the professionals.
This article will discuss a popular type of analysis named top to bottom analysis. It is the opposite of bottom-to-top research. It involves traders seeing the trading asset from several angles, including technical and fundamental both types of analysis. You can easily make a complete profitable strategy through this analysis, as it depends on trends and checks key affected levels created by the price movements.
What is top-bottom analysis?
Top to bottom analysis is not a complete trading strategy. However, this type of analysis allows traders to minimize the number of losing trades. You can easily find the adequate levels by this system and make entry or exit from any transaction.
There’s a prevalent textbook talk in the FX: “trend is always your friend,” but that is true until the trend is over. What does it mean? Which trend? Or what time frame chart 15M or weekly?
This top to bottom analysis depends on the trend analysis on different time frame charts. First, it will start with a weekly/monthly chart and end with a 1-hour chart. Second, it allows traders to find out the recent higher high and lower low of the chart or range of price movement for a certain period.
That includes finding out the adequate key levels and matching that with several fundamental events. There are so many macroeconomic outcomes that drive the currency market so that FX pairs may change trends. In the meantime, the price may change the direction with related data.
This analysis finds out the birds-eye view of the asset, which helps traders find out the market’s phase right now. But, first, let’s take a look at how it works.
How to read the chart using top-bottom analysis
We suggest for top-bottom analysis a new chart with no indicators at all. Indicators may make confusions during the research, so better a clean chart.
The weekly and monthly charts will give you a clear overview or overall trend, so the big picture of price movement. Then the daily chart is ideal to find out the market’s phase:
- Uptrend
- Downtrend
- Sideways
- Trend validity
- An exemplary chart to draw support resistance level
Lastly, 1-4hour charts are reasonable for going inside the daily candles, so traders find their entry and exit levels suitable for their invested amount and trading style. You can do this every weekend by simply following these manners:
-
Identify key level
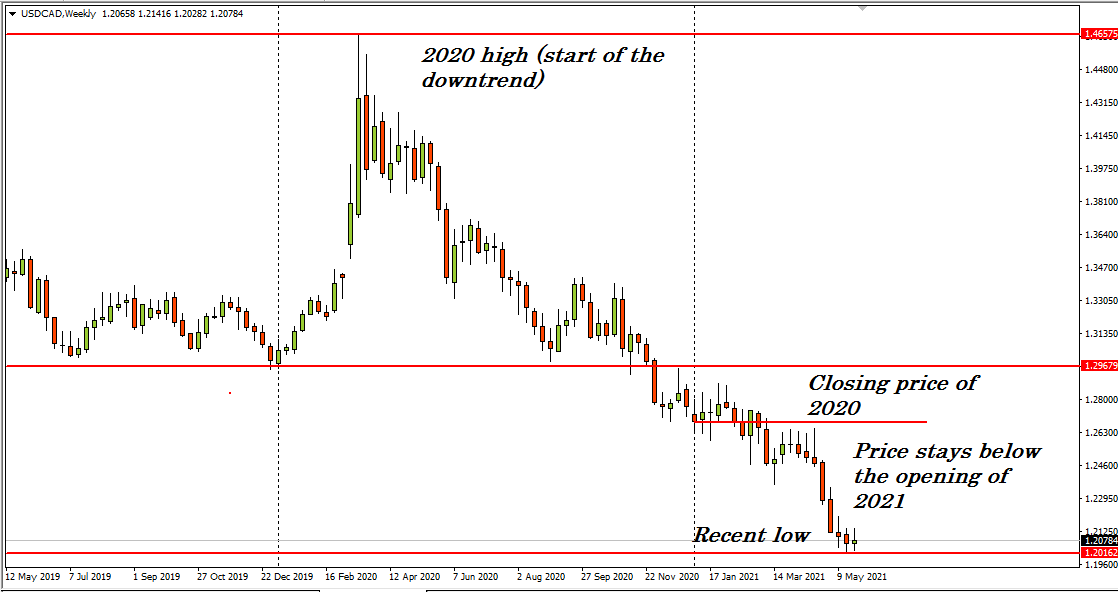
First, look at the weekly/monthly chart to see the recent price movement tendency and key levels like yearly opening and closing price. The weekly trend of the asset and recent high and low. The current practical range of the asset price.
Check out the weekly price chart pattern. So must match the price chart with critical macroeconomic fundamental data, which you can find the connection between critical events if any. Then mark the current swing levels and historical levels.
-
Identify near-term level
After getting the overall picture of the market from the more extensive time frame charts, it’s time to look more inside the chart.
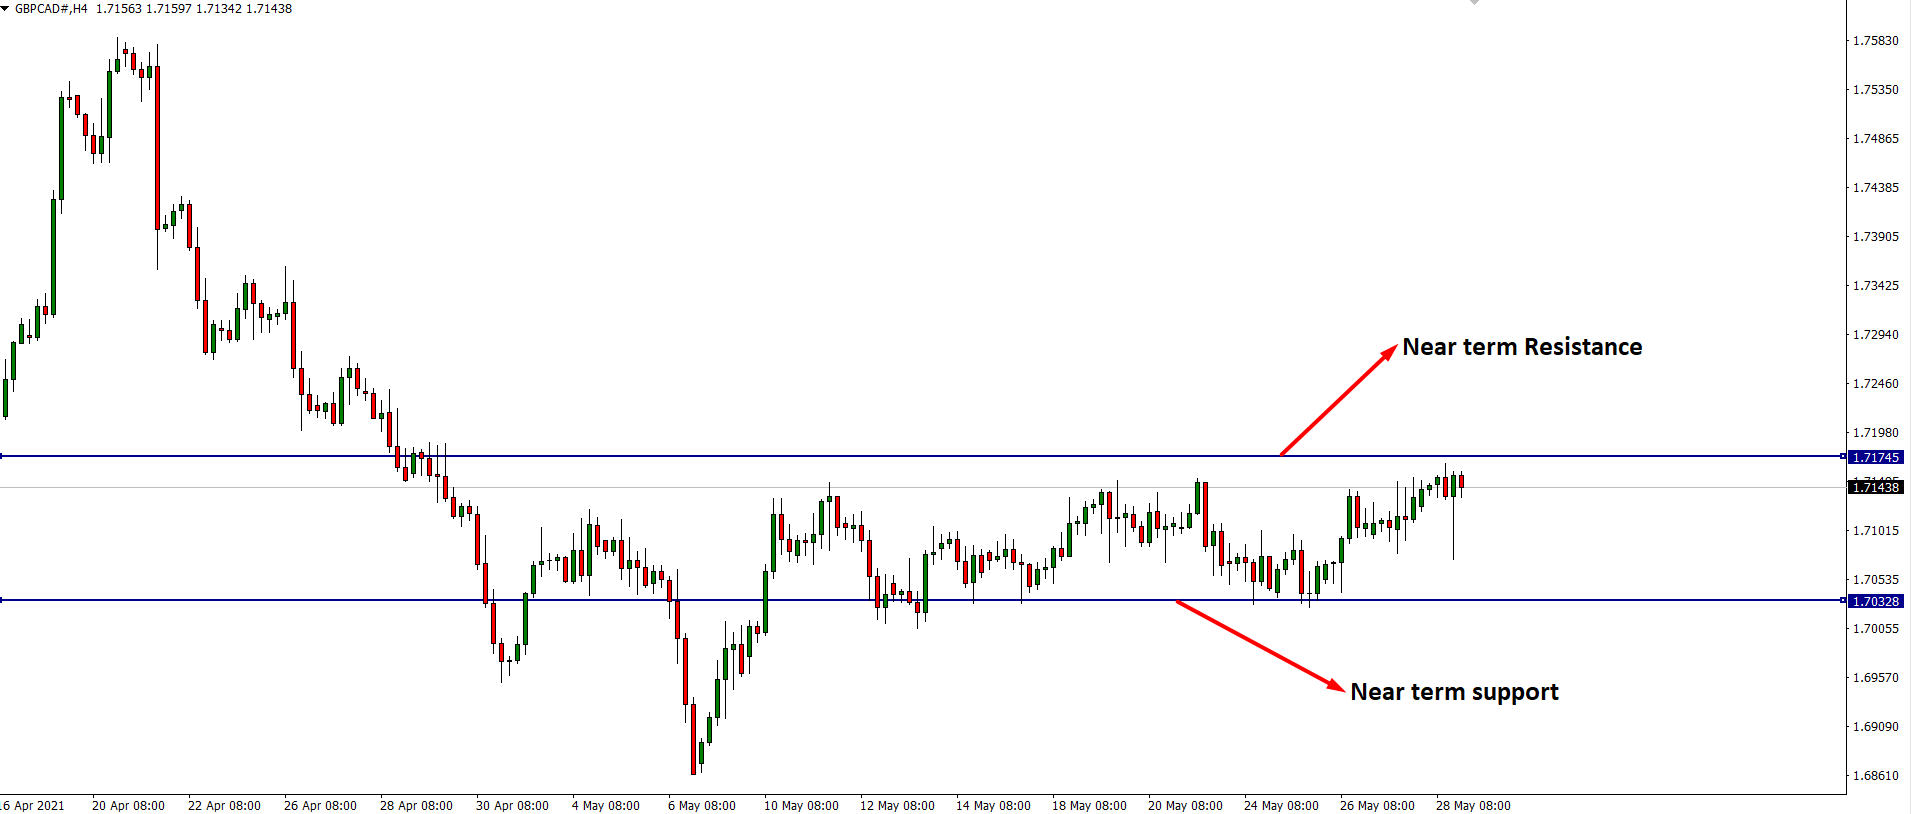
The near-term level is the most recent support or resistance level that is closer to the price. Here is an example.
- Check the near-term levels on the daily chart.
- Match the current trend with the weekly chart.
- Check if the trend remains intact or price is facing a short-term rejection from any support level.
- If the price goes in sideways — simply the current adequate levels like monthly opening-ending, high-low, and so on.
-
Identify event level
You must check the event levels when checking the charts and finding short-term, long-term ranges, and critical levels. Identifying the event will help you to understand the impact of macroeconomic data on the currency price.
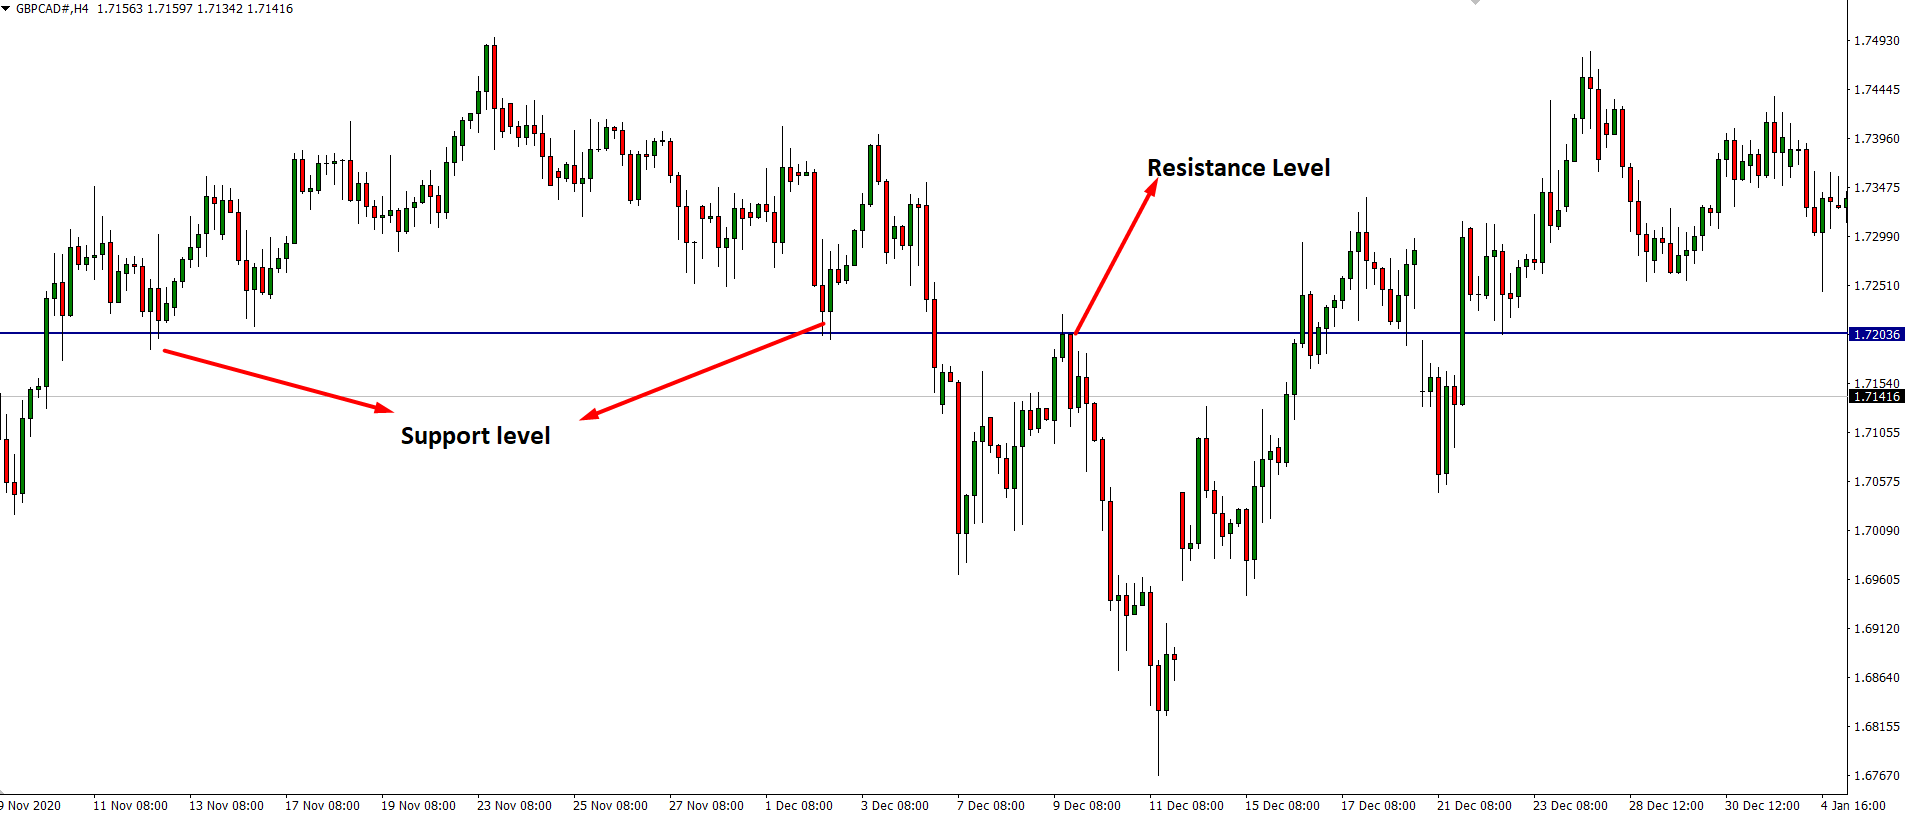
The event level is the price level that works as both support and resistance level. Here is an example.
-
Identify dynamic level
Lastly, identify the dynamic levels of the charts. So you can know the current phase of price movement.
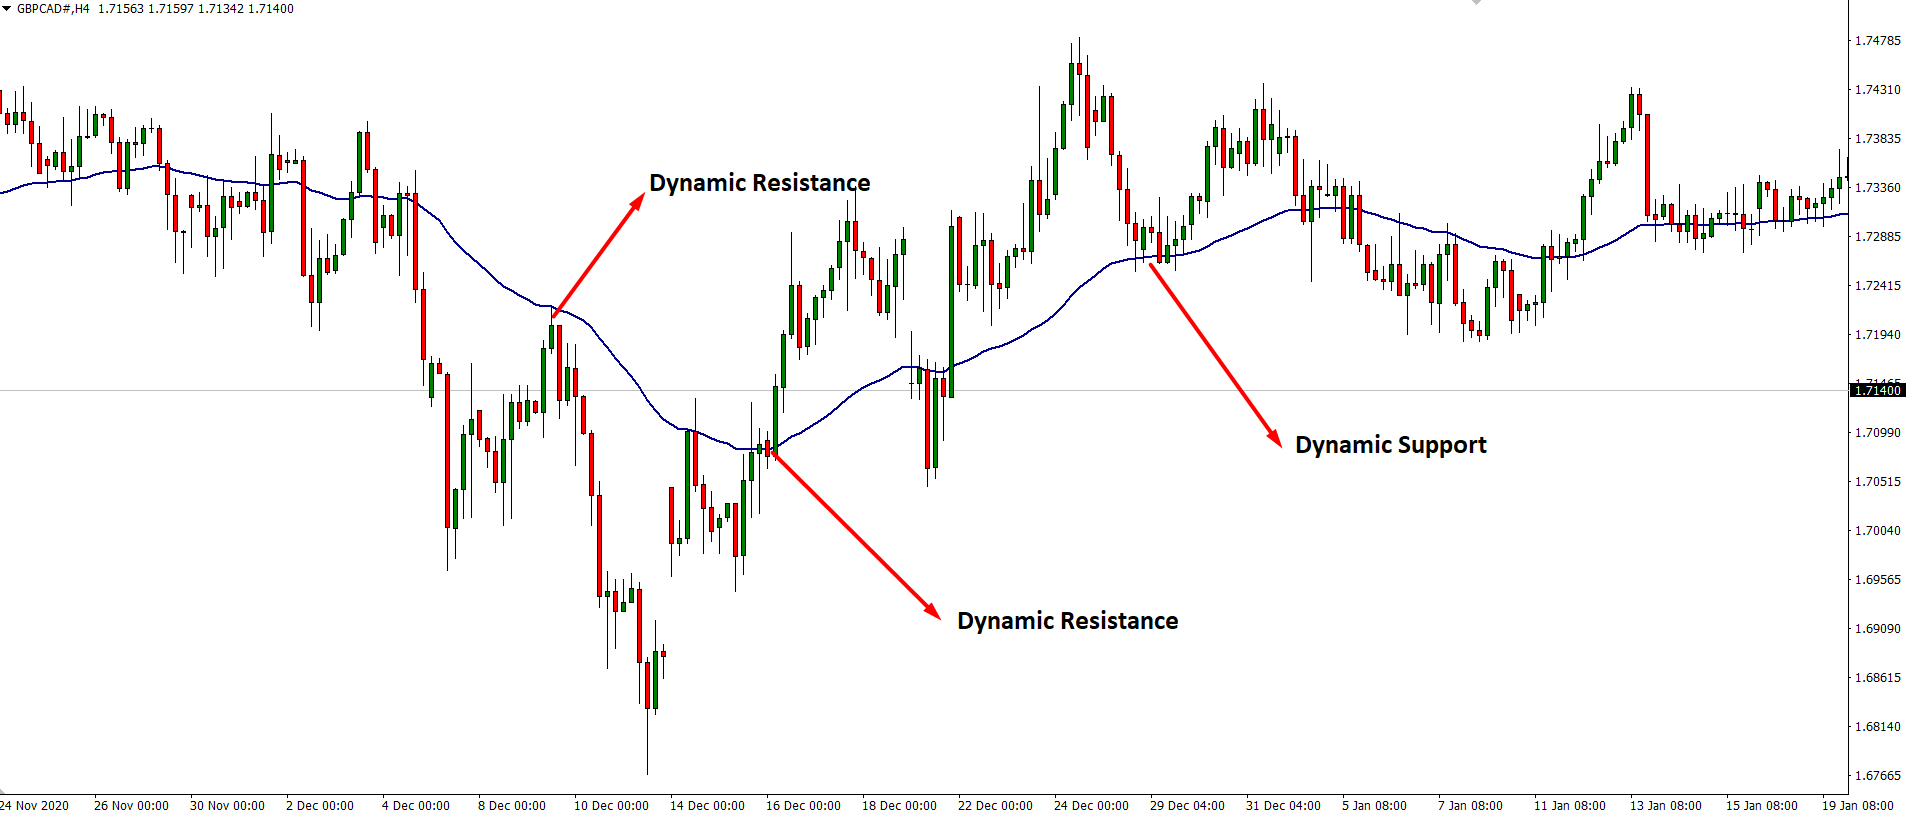
The dynamic level is a support or resistance level that moves with the price. Here is an example.
Checking the dynamic level is very important as you will learn the proper entries or exits. Simply identifying them will increase your profitability.
Trading idea based on top-bottom analysis
In this part, we will show how this type of analysis works.
The weekly chart
First, check the weekly chart of USD/CAD. The price remains at a complete downtrend since the beginning of the corona pandemic. By the end of the first quarterer in 2020, the price reached a high trend near 1.46. The recent low is near 1.20 by the first half of May 2021. So it’s a 2600 pips downward movement for the USD/CAD pair.
The daily chart
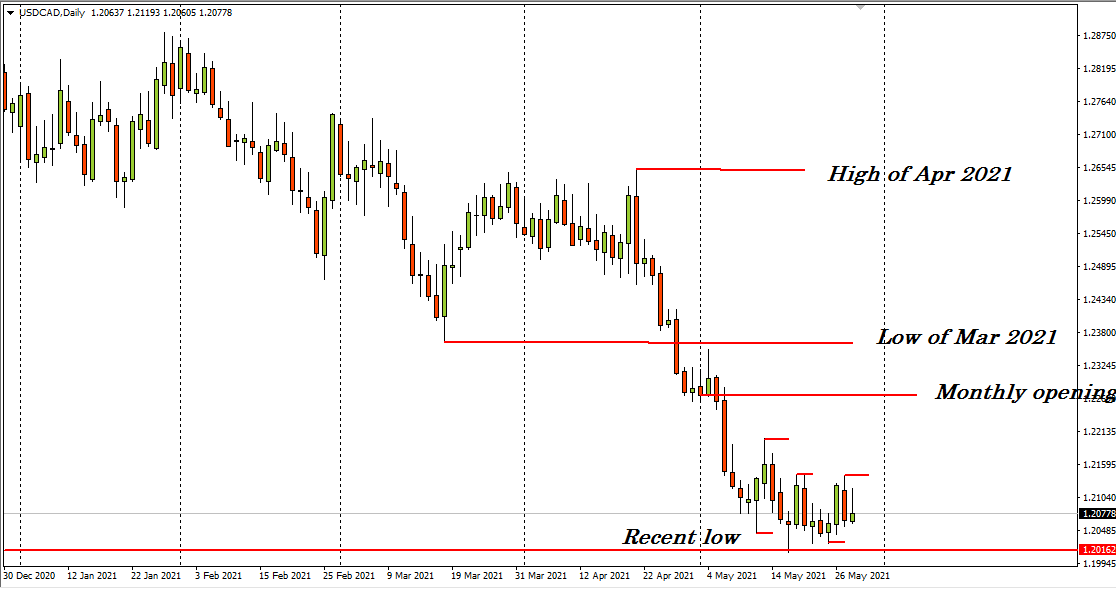
Now we check the daily chart of USD/CAD. It clearly shows that the trend remains intact till the first half of May 2021. Then, after making the lower low price starts to bounce back, and since then, the price is sideways.
The 4-hour chart
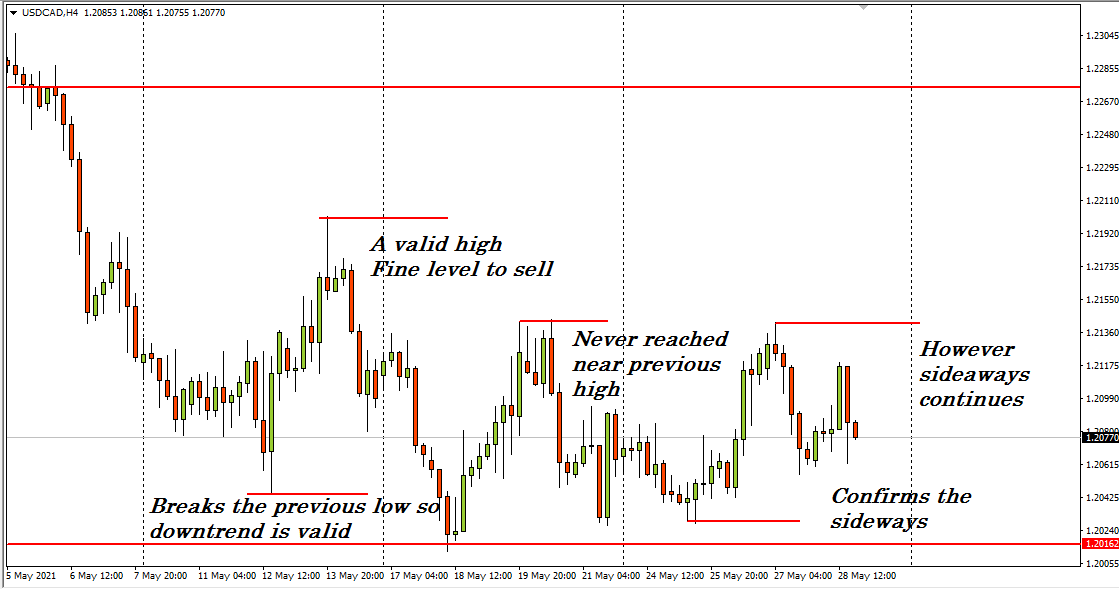
So now we check the 4-hour chart to look more inside. It shows several bounce-back price levels between the whole downtrend price movement.
The idea is so simple. You find the highs within the significant downtrend and sell orders as the trend remains intact at the higher time frame charts. Avoid the sideways and wait until there is any valid support or resistance breaks.
Simply the sell orders are safe as this kind of asset price chart shows until the price breaks the recent higher highs or rejects several times from lower low. Additionally, you will first find at the lower time frame charts when the trend may change the direction.
Final thought
The top to bottom analysis helps you to get the overall picture of the market. For example, in forex trading, it is mandatory to know what big players are doing. Retail traders have to follow giant traders in the market, and huge traders always follow higher time frames.
Besides, following a trading strategy, you should follow strong money management rules to get the maximum benefit from trading.






Comments