Many financial traders rely on candle formations to make trade decisions, as any candle represents participants’ actions during a specific period. The price action traders frequently use naked charts with candlestick patterns to define the price direction precisely. The rising three formations is one of the potent candlestick patterns in the financial market that can bring more profits for you.
However, it often requires combining the pattern formations with technical indicators to determine the most accurate entry/exit positions and create complete trading methods. This article will introduce you to the rising three candle formation besides trading strategies using this pattern with chart attachments for better understanding.
What is the rising three method?
It is a multi candle formation on any uptrend price movement. This pattern signals a continuation of the current trend. The rising three pattern contains five candles, and its appearance is the opposite of the falling three candlestick pattern. A minor retracement occurs on an uptrend during the entire formation.

The rising three formation
The first candle of this pattern is a buy candle. Meanwhile, the following three candles will be smaller than the first candle, and the body will be red or bearish. Lastly, the fifth candle of this pattern will be bullish that will close above all other candles. These five candles are together ‘The rising three’ candlestick pattern, a typical formation. Any trading method that uses this pattern to generate trade ideas is a rising three method.
How to trade using the rising three method
It is a typical formation on any financial asset chart. You can mark this pattern during the uptrend slows or wait for more upward pressure on the asset price. The first bullish candle represents sufficient buy pressure on the asset price, and the next day the buying pressure fades.
Then the price movement creates a small sell candle. Like the next two candles, the seller dominates the market, and the price holds still by creating a minor retracement on the uptrend. Lastly, on the fifth day, buyers get back, or an increasing demand pushes back the price higher above all other candles of this pattern.
Traders enter the market after the pattern finishes formation. Using many trading indicators such as MA crossover, MACD, RSI, Parabolic SAR, etc., will help you create complete trading strategies as this pattern only suggests an opening position.
A short-term trading strategy
Our short-term trading technique uses the popular MA crossover to sort out trading positions besides the rising three patterns.
We use EMA 10 (red) and EMA 30 (blue) in this strategy. When the red EMA crosses the blue EMA on the upside, it declares a buy pressure on the asset price and remains the same way as long as the uptrend remains intact. The exact opposite crossover between those EMA lines indicates a downtrend. This trading strategy suits any trading instrument. The preferable time frame is a 15-min chart and select trading instruments with sufficient volatility.
Bullish trade scenario
When you seek to open a buy position, follow the steps below:
- Confirm the current trend is bullish.
- The red EMA line crosses the blue EMA line on the upside.
- The rising three patterns are occurring.
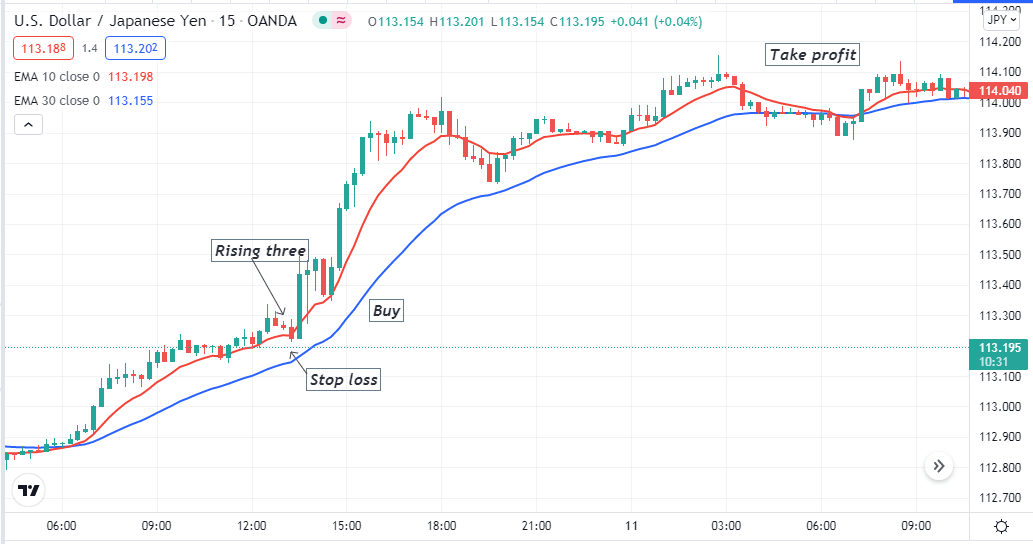
Bullish setup
Entry
Match these conditions above with your target asset chart and wait until the entire pattern appears. When it finishes, place a buy order.
Stop loss
The initial SL level will be below the first candle range of the pattern with a buffer of 5-10pips.
Take profit
You can continue the buy order till the buying pressure remains intact on the asset price. Close the buy position when the red EMA crosses the blue EMA on the downside.
Bearish trade scenario
This trading method suggests opening a sell position when:
- Confirm the current trend is bearish.
- The red EMA line crosses the blue EMA line on the downside.
- The falling three pattern is occurring.
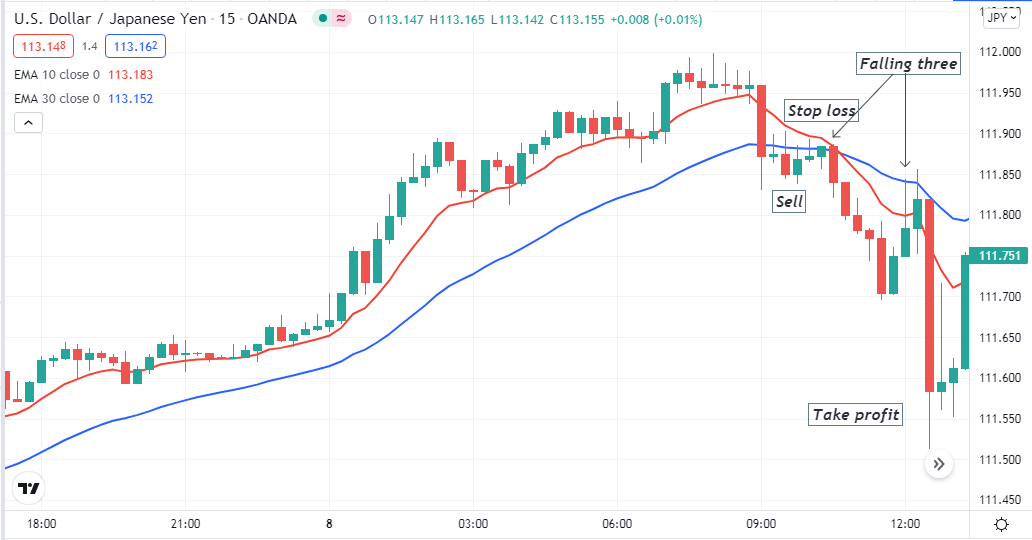
Bearish setup
Entry
Match these conditions above with your target asset chart and wait until the entire pattern appears. When it finishes, place a sell order.
Stop loss
The initial SL level will be above the first candle range of the falling three pattern with a buffer of 5-10pips.
Take profit
You can continue the sell order till the selling pressure remains intact on the asset price. Close the sell position when the red EMA crosses the blue EMA on the upside.
A long-term trading strategy
Our long-term trading technique uses a popular momentum indicator, the MACD, beside the multi candle pattern. The MACD indicator contains two signal lines, a central line and histogram bars of different colors at both sides of the central line.
This trading method suits any financial instrument. We recommend using an H4 or daily chart to catch the most potent long-term trading positions that will allow holding positions for a few days or even weeks.
Bullish trade scenario
This trading method suggest opening a buy position when:
- The price is on an uptrend.
- A rising three pattern takes place.
- The dynamic blue line is above the dynamic red line on the MACD window.
- Both signal lines are heading toward the upside.
- MACD green histogram bars take place above the central line.
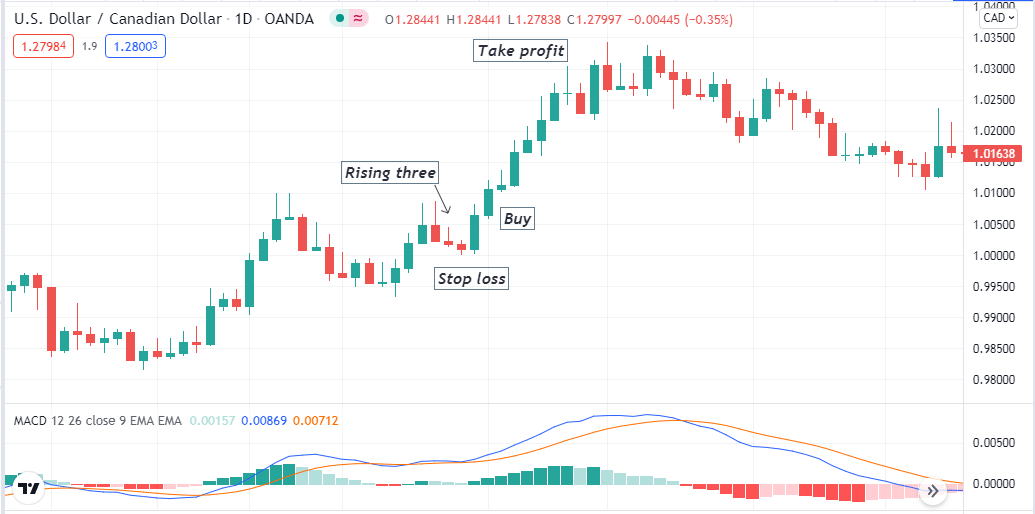
Bullish setup
Entry
When these conditions above match your target asset chart, wait till the entire pattern completes formation. Then place a buy order.
Stop loss
Set an initial SL below the first candle range of the rising three patterns.
Take profit
Close the buy position when:
- The dynamic blue line crosses the dynamic red line on the downside at the MACD window.
- MACD red histogram bars take place below the central line.
Bearish trade scenario
This trading method suggest opening a sell position when:
- The price is on a downtrend.
- A falling three pattern takes place.
- The dynamic blue line is below the dynamic red line on the MACD window.
- Both signal lines are heading toward the downside.
- MACD red histogram bars take place below the central line.
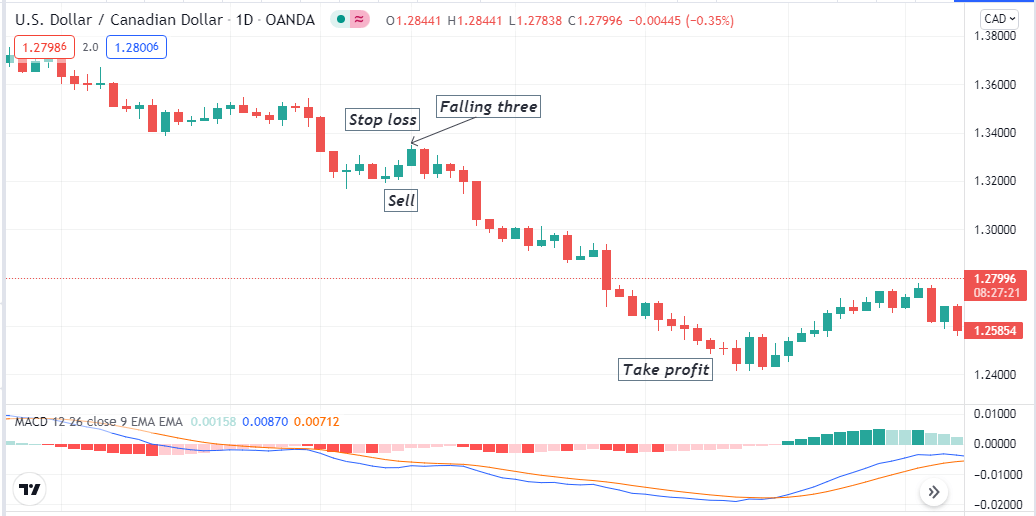
Bearish setup
Entry
When these conditions above match your target asset chart, wait till the entire falling three pattern completes formation. Then place a sell order.
Stop loss
Set an initial SL above the first candle range of the falling three pattern.
Take profit
Close the sell position when:
- The dynamic blue line crosses the dynamic red line on the upside at the MACD window.
- MACD green histogram bars take place above the central line.
Pros and cons
| 👍 Pros | 👎 Cons |
| This pattern supports price action methods. | This pattern doesn’t suggest complete trade setups. |
| It is a typical pattern on many trading assets. | Trading methods using this pattern can fail due to fundamental events. |
| This pattern allows opening positions in the trend direction. | It requires using other technical indicators to execute trades. |
Final thought
This article teaches one of the best potent multi candle pattern formations. We hope you find this article sufficiently educational and informative to execute constant successful trades using this pattern. We suggest following appropriate trade and money management while using these methods for trading.


Comments