Financial traders use many techniques to achieve constant profits from the financial market. Such techniques enable traders to participate in more profitable deals and control risks. Many traders may use swing trading techniques; meanwhile, others may participate using day trading techniques.
However, there are many trading strategies to approach the market besides these two, such as scalping, position trading, momentum trading, hedging, etc., which approach will suit you depending on your trading skills, capital size, return expectations, etc.
This article will explain day trading and swing trading — moreover, trade setups with chart explanation for both trading strategies.
Swing trading vs day trading
Trading practice in the financial market relates to different factors such as trading method, trading skills, assets, etc. Both swing trading and day trading are standard ways to participate in the marketplace.
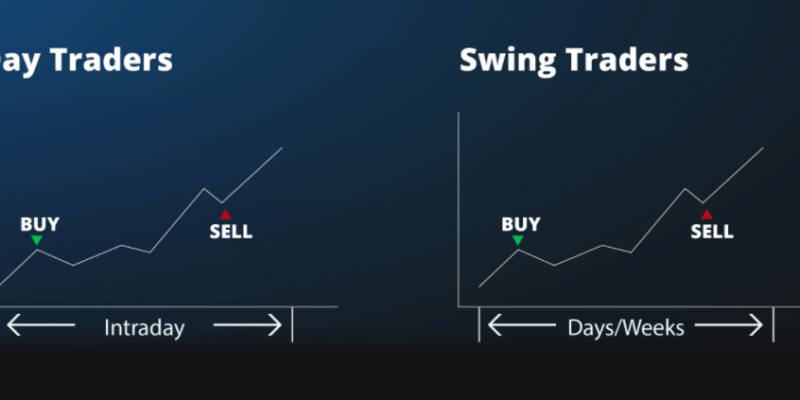
These methods to approach the marketplace may share some similarities but have many differences. The most considerable difference is “time” or duration of trading. Day traders may have goals to “trade within the day,” so they often use smaller time frames such as 1min-H1 charts.
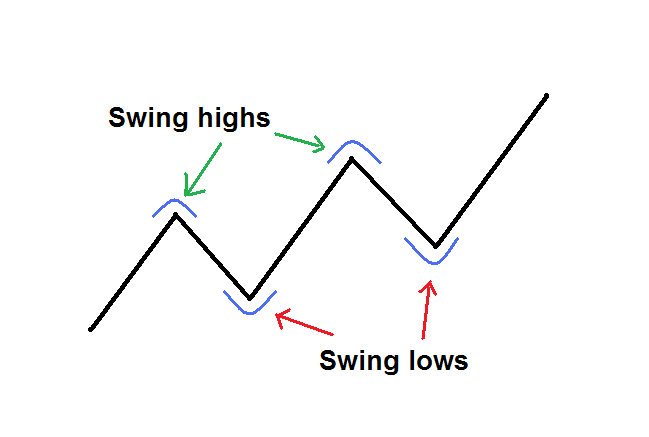
Swing points
Moreover, most of the time, day trading methods don’t allow overnight holding trading positions. Meanwhile, swing traders may hold the asset overnight and use H4 charts or above to catch desirable trading positions. It doesn’t mean you have to choose higher timeframe charts to practice swing trading; you can use any time frame you want to.
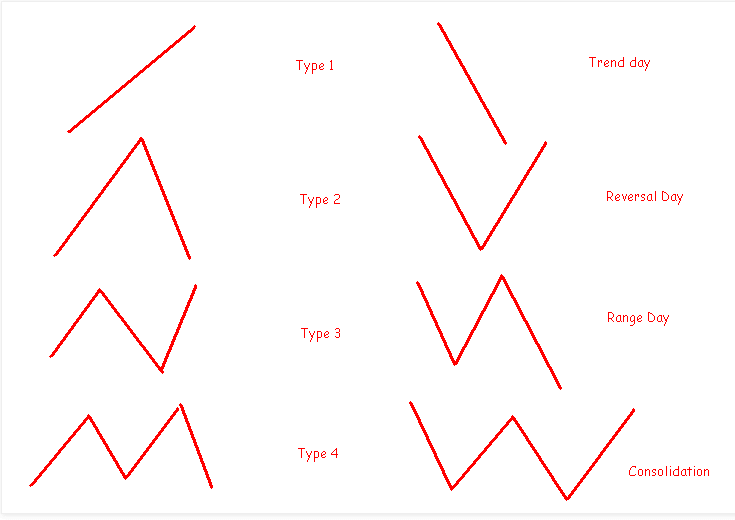
Day trading scenarios
Another common difference between these two is using leverages. Day traders often use more significant leverages to make quick money at a shorter time, which can be risky. Whereas swing traders commonly use low leverage on trading.
Profit target is also different for each type of trader. Day traders have smaller profit goals in comparison with swing traders. Swing traders often need to spend less time in front of the monitor than day traders. Additionally, day traders make more frequent trading positions than swing traders.
How to trade using these methods
You can practice many trading techniques for day trading. Day trading techniques involve price action trading, support resistance, technical tools, and indicators, etc. Profits targets are small, and trade duration is low, so day traders must be intelligent and skillful to make constant profits.
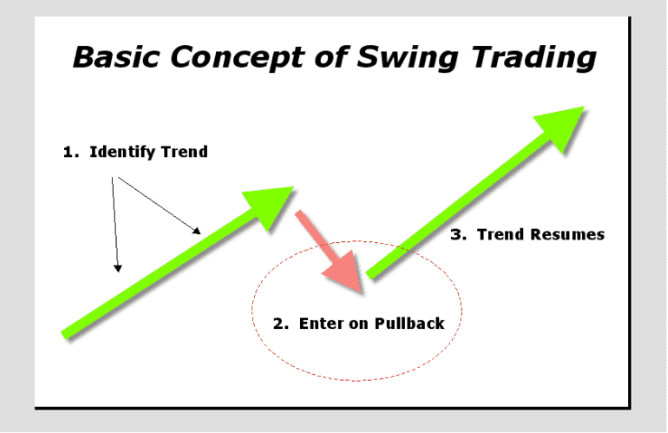
Swing concept
On the other hand, swing traders often make fewer trading positions than day traders. It only requires identifying potential swing positions and waiting till the price movement takes place according to expectations. Many technical tools and indicators are available to locate swing positions during the price movement as the price shifts by following many common patterns in the financial market. Swing traders may hold positions for days or weeks.
A short-term trading strategy
Our short-trading strategy involves two popular technical indicators: moving average crossover and the Parabolic SAR. We use EMA values of 9 and 21 periods. EMA 9 is green, and EMA 21 is blue.
Meanwhile, the parabolic SAR declares trends by dot appearance on both sides of price candles. This trading method works fine on any timeframe for any financial assets that have acceptable volatility. We recommend using a 15 min chart for day trading and major currency pairs as they are volatile enough to make frequent trading positions.
Bullish trade scenario
Implement those indicators in the chart of your target asset. Seek potential buy positions when:
- Parabolic SAR dots appear below price candles after a swing low.
- The green EMA line (EMA 9) crosses the blue EMA line on the upside.
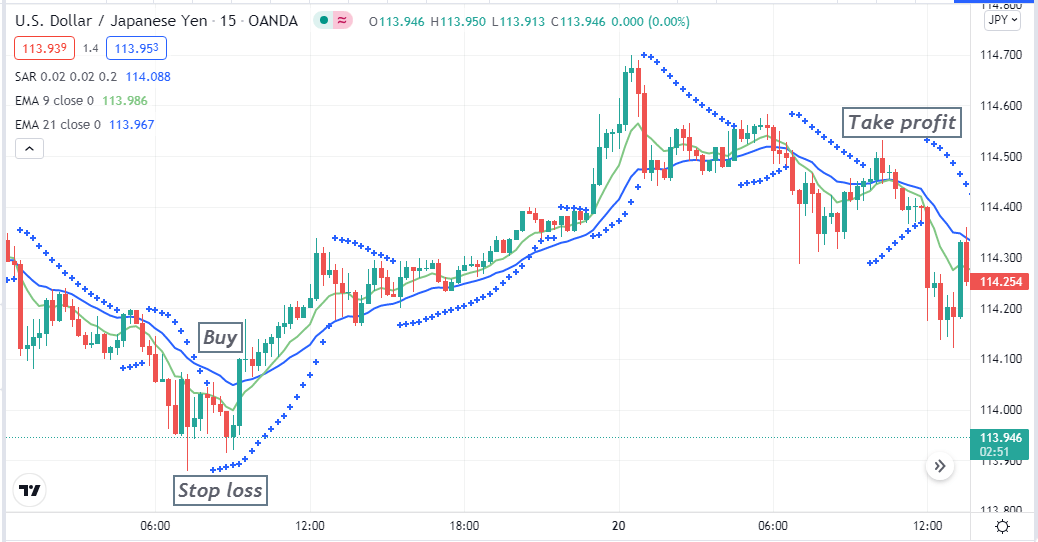
Bullish setup
Entry
Check these conditions above are true. Place a buy order after the current bullish candle closing.
Stop loss
The initial stop loss level is below the current swing low, where the first Parabolic SAR dot declares an uptrend.
Exit
Close the buy position when the opposite crossover (green crosses below blue) occurs between those EMA lines.
Bearish trade scenario
Seek potential sell positions when:
- Parabolic SAR dots appear above price candles after a swing high.
- The green EMA line (EMA 9) crosses the blue EMA line on the downside.
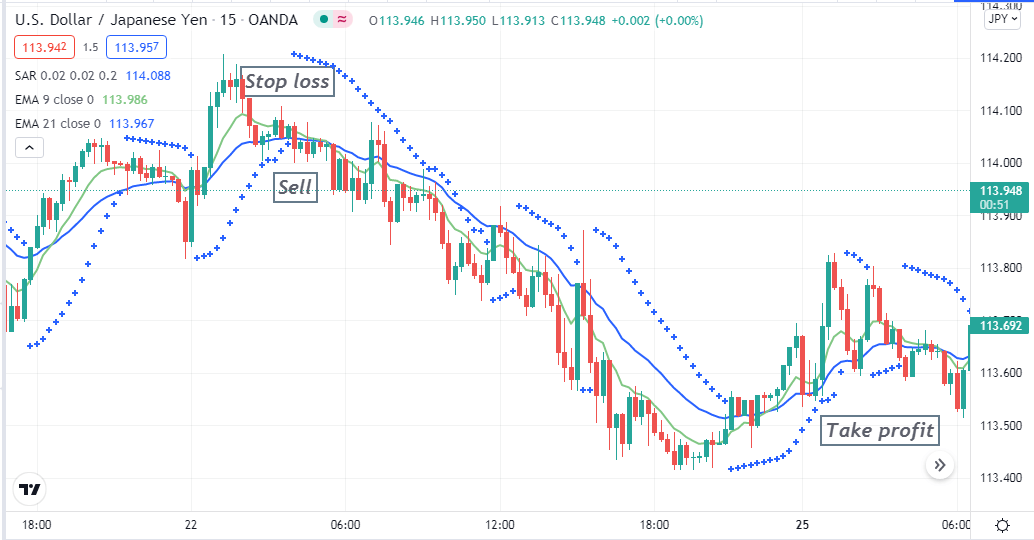
Bearish setup
Entry
Check these conditions above are true. Place a sell order after the current bearish candle closing.
Stop loss
The initial stop loss level is above the current swing high, where the first Parabolic SAR dot declares a downtrend.
Exit
Close the sell position when the opposite crossover (green crosses above blue) occurs between those EMA lines.
Pros and cons of day trading
| Pros | Cons |
|
|
|
|
|
|
A long-term trading strategy
Our long-term method is a swing trading technique that uses a popular technical tool, the Fibonacci retracement. You can catch trades at the trend. This method works fine on any financial asset using any time frame charts. We recommend using H4 charts to seek trade opportunities to eliminate fake swing high/low points on lower time frame charts. Meanwhile, the current trend confirmation comes from upper time frames such as daily or weekly charts.
Bullish trade scenario
When the price breaks the recent previous high, set the Fibonacci retracement tool from the swing low to the current high. Price declines back to 50% to golden ratio 61.8% level that enables the potential buy opportunity. Place buy order when price reacts at that particular level.
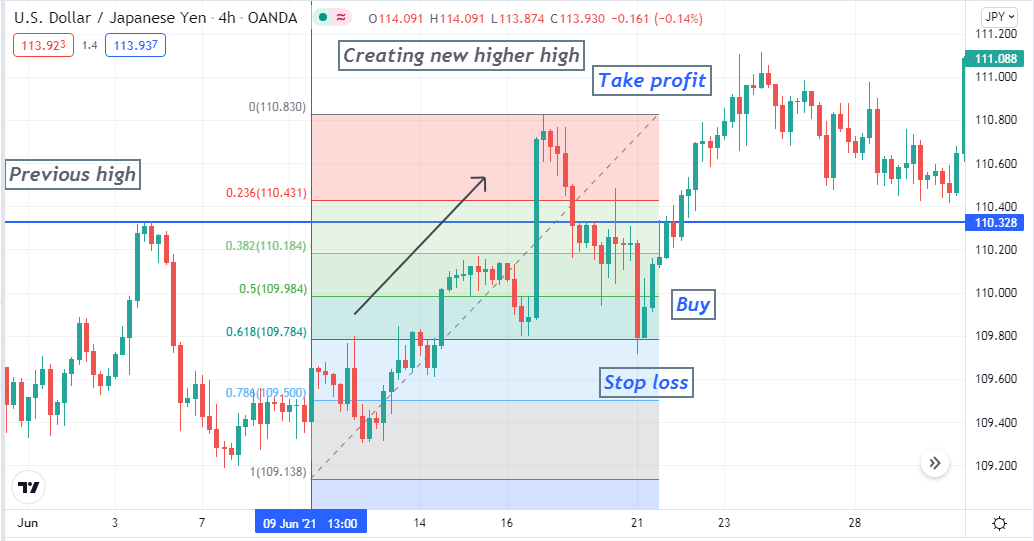
Bullish setup
Meanwhile, the profit target will be above the same range as the Fibonacci retracement range and stop loss below the new swing low.
Bearish trade scenario
First, confirm the current trend is bearish from the upper timeframe charts. Set the Fibonacci retracement tool from the current high to the recent lower low when the price breaks below the previous low. Place a sell order when the price returns to 50%-61.8% Fibonacci retracement level by observing the reaction.
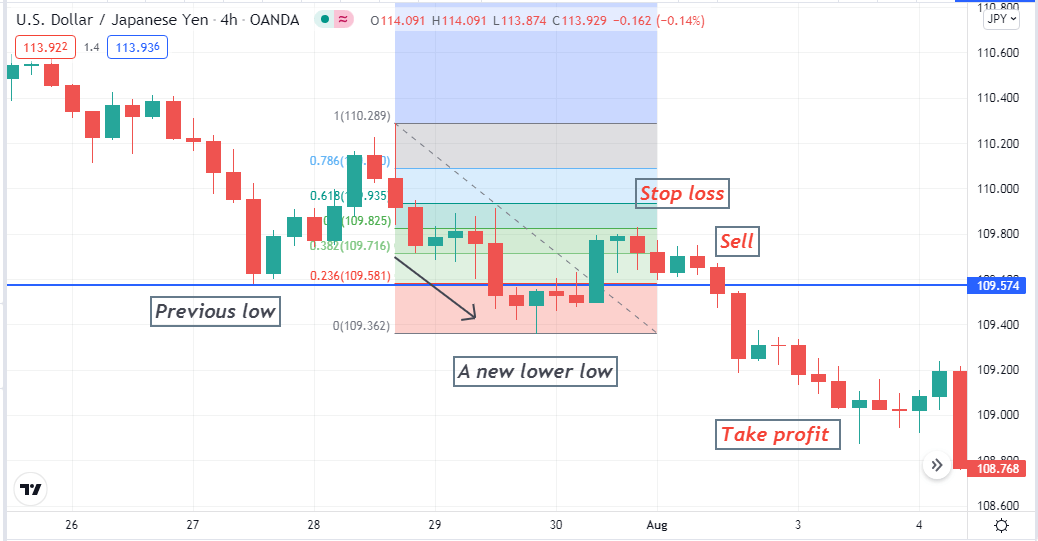
Bearish setup
The profit target will be below the same distance as the Fibonacci retracement range, and the initial stop loss level is above the current swing high.
Pros and cons of swing trading
| Pros | Cons |
|
|
|
|
|
|
Final thought
Finally, day trading or swing trading, which will suit you entirely, depends on your trading skills, return expectations, time availability, and other factors. You can make thousands of pips profits by using any of these methods. We suggest following good money and trade management rules to keep your capital safe.


Comments