
Once Benjamin Franklin wrote in his book that “Remember that time is money.” It is a compelling sentence in the financial market as trading duration is crucial for traders and investors. Successful traders make their trade decisions depending on the period. Moreover, different period charts will enable traders to obtain the market context differently.
However, trading strategies depend on time, and every trader must follow some critical rules to make constant profitable trading positions. This article contains the main directions for success in weekly trading besides different FX weekly trading strategies with chart attachments.
What is the forex weekly trading strategy?
It is a trading method in which the trading duration is usually longer than other trading strategies such as day trading, scalping, etc. Meanwhile, you can perform position trading or swing trading methods as a weekly trading strategy. There are some common rules to follow to be a successful trader.
Those are:
Discipline
The first rule is to follow a disciplined approach to the marketplace. It will increase your profitability, allow you to avoid overtrading, and keep your capital safe during volatility.
Trade for the long run
Remember, there is no way to be a millionaire overnight; it requires following an excellent strategy to invest in any trading asset. Most novice traders lose money by doing overtrading and revenge trading. So the second rule is to think for the long run, set a goal and achieve it.
Sufficient knowledge about asset
The third rule is to trade assets that you know better. It will enable opportunities to make considerable profits and reduce risks on trades.
Select two or more assets
It is the fourth rule that you should choose two or more assets to trade. Remember, don’t overload your portfolio with useless assets that have tiny potentiality. So you can diversify your investment.
Focus
The fifth rule is not to lose focus on your goal. Monitor your asset timely and observe opportunities to catch the best potential trades.
How to trade using weekly strategy?
You can trade using weekly strategies by following some simple steps:
- Determine the trend from daily, weekly, or monthly charts.
- Check the current trend.
- Seek buy/sell positions in H4 or daily charts.
- Otherwise, you can make buy/sell using weekly charts if your strategy suggests.
You can use many technical tools, patterns, and indicators to generate weekly trading ideas.
A short-term trading method
Our short-term trading strategy uses the ADX indicator and EMA crossover to seek potential buy/sell positions. The ADX value is above 20 signals the current trend has sufficient strength to continue. The value increases or decreases with the participant’s actions. When the movement becomes weak, the ADX value decreases.
We use EMA 21 (green) and EMA 50 (blue) to identify the trend. When the green EMA crosses above the blue EMA, it indicates buyers’ domination of the asset price.
Meanwhile, when sellers dominate the asset price, the green EMA crosses below the blue EMA, signaling a possible upcoming downtrend. Although this strategy applies to any time frame, we recommend using this strategy on an H4 chart to generate short-term weekly trading ideas.
Bullish trade scenario
Seek to place buy orders when:
- The green EMA line crosses the blue EMA line on the upside.
- The ADX value is above 20.
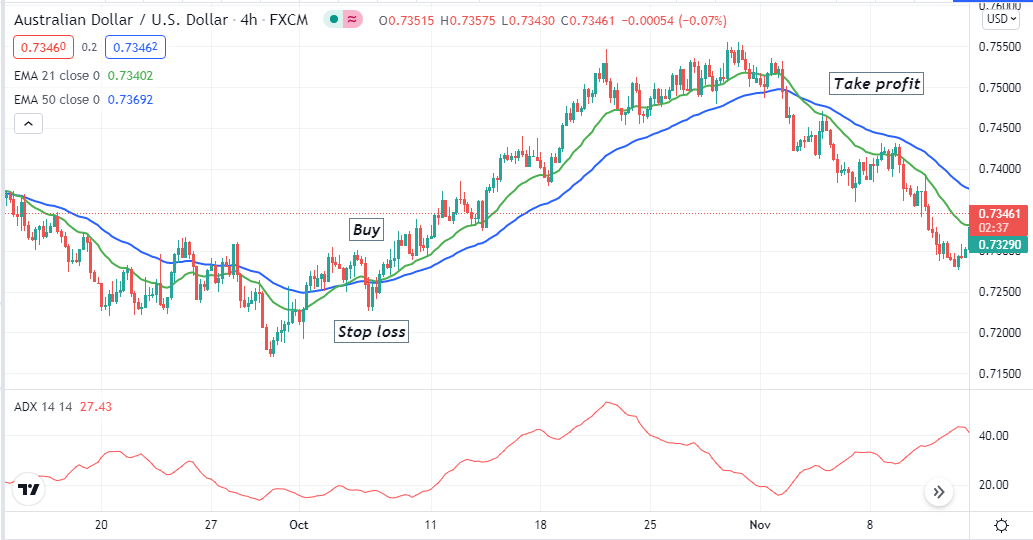
Bullish setup
Entry
When these conditions above match your target asset chart, it signals a possible upcoming bullish movement with sufficient force. Place a buy order after closing the current bullish candle.
Stop loss
The initial stop loss level will be below the current swing low. Set a stop loss for your buy order below that low with a buffer of 10-15pips.
Take profit
You can close the order after the price movement makes any new higher high. Otherwise, close the buy position when:
- The green EMA line crosses below the red EMA.
- The ADX value drops below 20.
Bearish trade scenario
Seek to place sell orders when:
- The green EMA line crosses the blue EMA line on the downside.
- The ADX value is above 20.
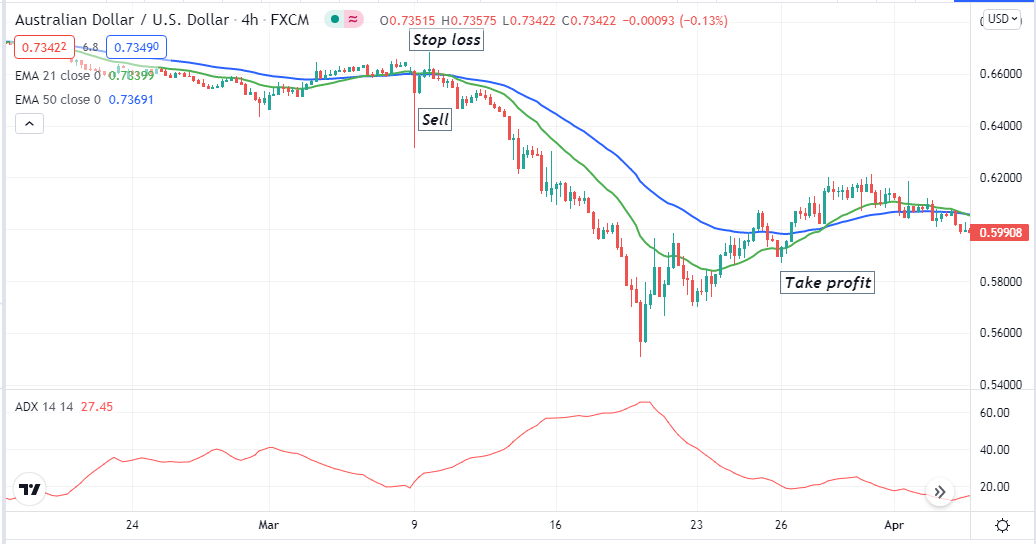
Bearish setup
Entry
When these conditions above match your target asset chart, it signals a possible upcoming bearish movement with sufficient force. Place a sell order after closing the current bearish candle.
Stop loss
The initial stop loss level will be above the current swing high. Set a stop loss for your sell order above that high with a buffer of 10-15pips.
Take profit
You can close the order after the price movement makes any new lower low. Otherwise, close the sell position when:
- The green EMA line crosses above the red EMA.
- The ADX value drops below 20.
A long-term strategy
Our long-term trading strategy contains the parabolic SAR beside another popular technical indicator, the RSI. This strategy works fine in any time frame; we recommend using a daily chart to obtain the best results.
Bullish trade scenario
The price movement is potential for buyers when:
- The parabolic dots take place below price candles.
- The RSI dynamic line is at or above the central (50) line moving toward the upside.
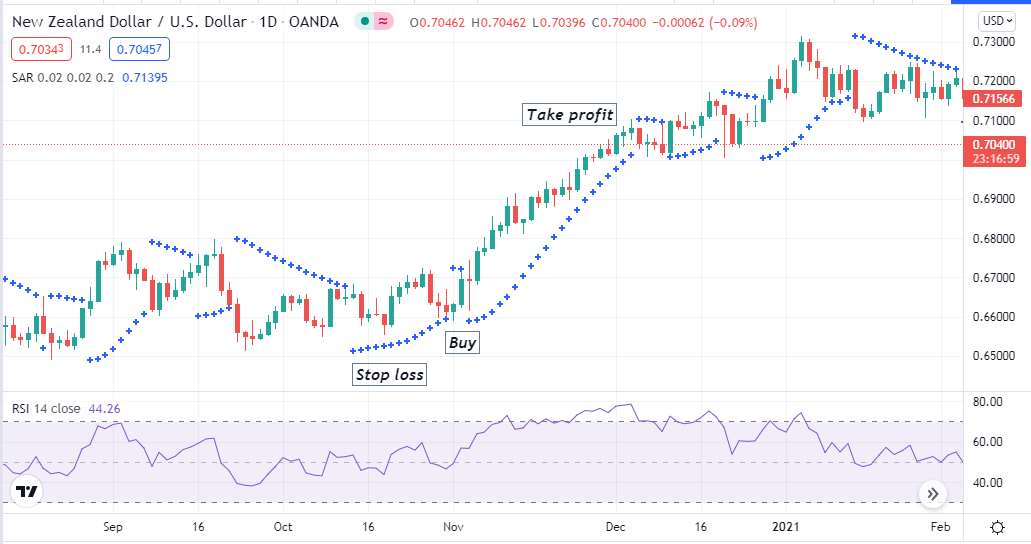
Bullish setup
Entry
Place a buy order when these conditions above match with your target asset chart.
Stop loss
The stop loss level for your buy order will be below the current swing low.
Take profit
Close the buy order when:
- The parabolic dot flips on the upside of price candles.
- The RSI dynamic line is at or near the upper (80) line moving toward the downside.
Bearish trade scenario
The price movement is potential for sellers when:
- The parabolic dots take place above price candles.
- The RSI dynamic line is at or below the central (50) line moving toward the downside.
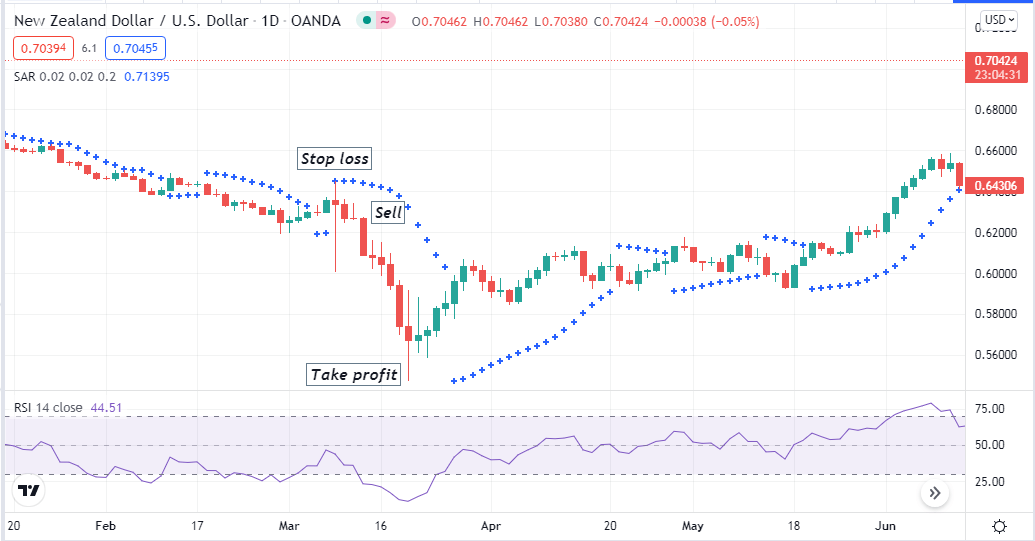
Bearish setup
Entry
Place a sell order when these conditions above match with your target asset chart.
Stop loss
The stop loss level for your sell order will be above the current swing high.
Take profit
Close the sell order when:
- The parabolic dot flip on the downside of price candles.
- The RSI dynamic line is at or near the lower (20) line moving toward the upside.
Pros and cons
| 👍 Pros | 👎Cons |
|
|
|
|
|
|
Final thought
We list the main rules of successful trading in our article. Moreover, we describe the two best strategies besides listing weekly trading strategies’ top pros and cons. Any of these strategies above suits fine on intraday or daily trading. Weekly trading is suitable for market participants who don’t have enough time to manage trades regularly or cannot spend much time trading.


Comments