
Trading with the trend is advice you will get from market participants everywhere. Even the great Dow Theory underscores the value of this trading mantra. But how can you trade with the trend? The easiest way to do that is through pullback trading.
This article will learn the various types of pullbacks you will see daily on your charts.
What is a pullback?
A pullback is any price movement opposite the prevailing trend. It is a short sell-off in an uptrend, while in a downtrend, it is a short rally.
Other traders call this market action a correction, retracement, bargain, discount, etc. All these terms mean the same thing.
Your goal as a trader is to determine the specific type of pullback, mark time until the pullback is over, find an entry in hopes of trend resumption, and capture as much profit as you can, trading the impulse swing back into the original trend direction.
Benefits of pullback trading
If you look at a trending market, you will see that it is characterized by a series of higher highs and higher lows for an uptrend and lower-high and lower-low for a downtrend. This is the structure of a trending market.
If you watch closely, you will find out that the trend consists of two swings:
- Impulse
- Correction
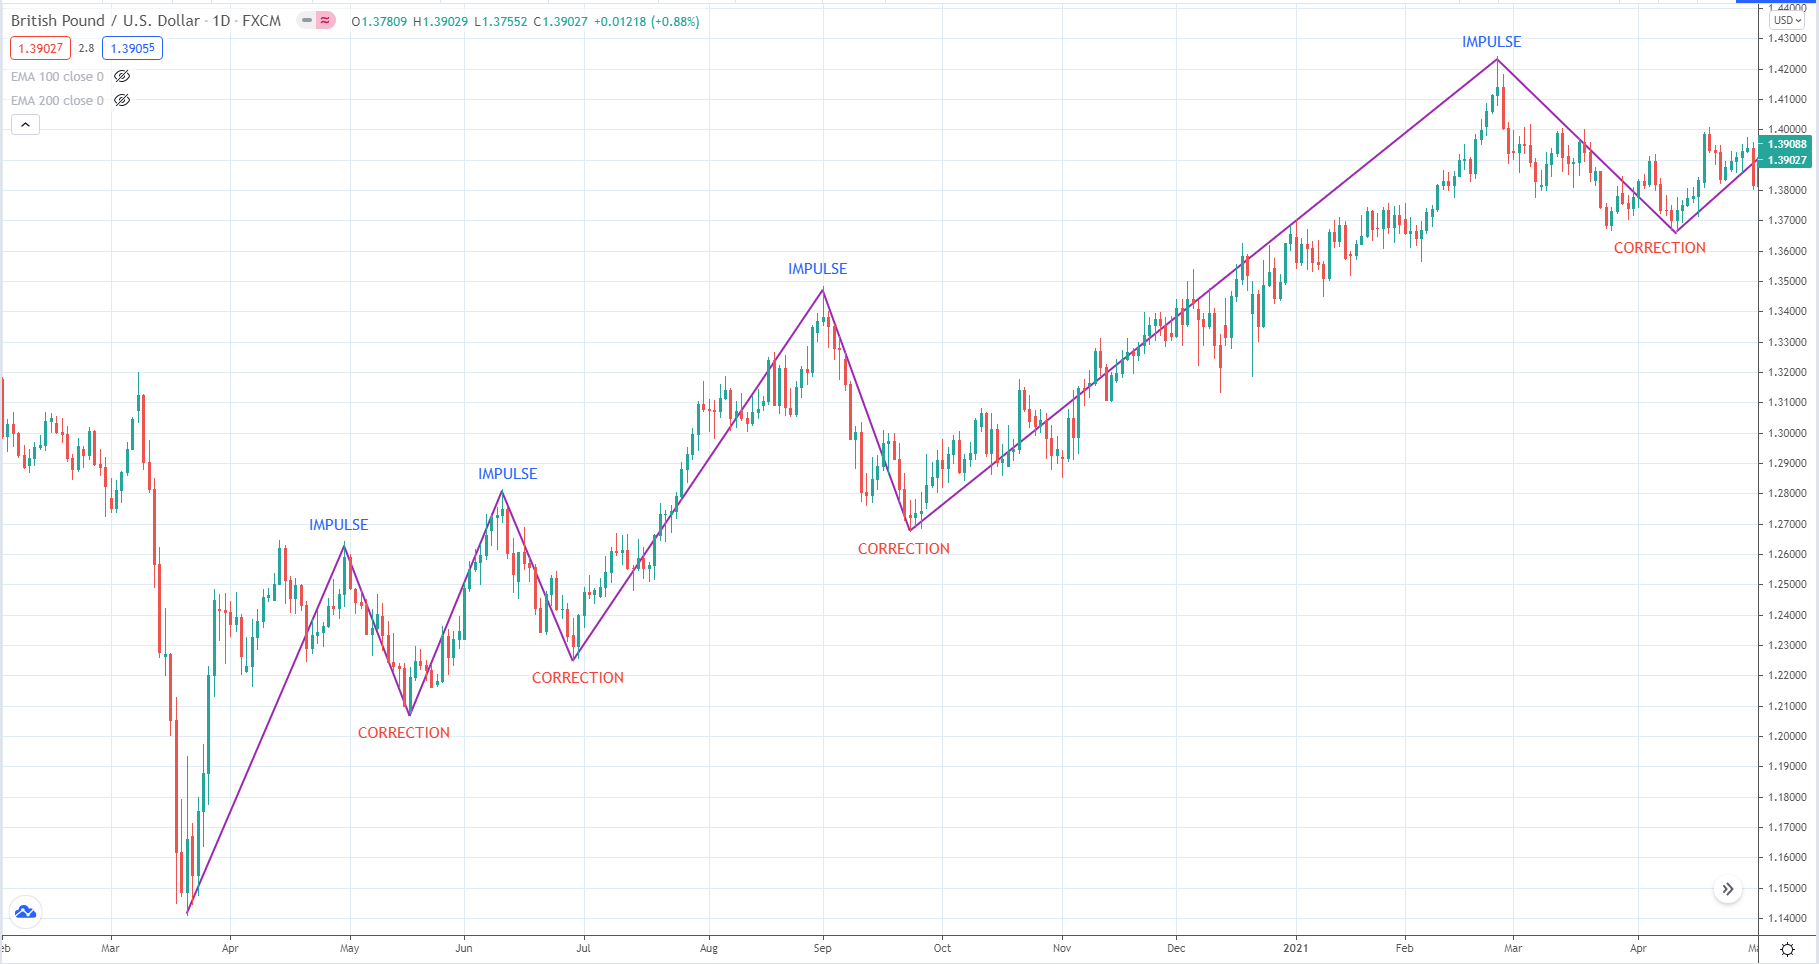
This alternation of impulse and correction continues until the trend changes direction. However, the concept of impulse-correction alternation remains. In addition, you will realize that impulse swings are longer in duration than corrective swings do. This is a crucial idea to grasp. Refer to the above GBP/USD daily chart.
Therefore, trading pullbacks allows you to aim for larger targets because you expect the current impulse swing to get past the ending point of the previous impulse swing. As you can see, greater profits await you when you trade pullbacks.
Another advantage of pullback trading is bigger reward than risk. Typically, you will set your stop loss at the endpoint of the pullback. Meanwhile, you will place your “take profit” at the recent swing high or swing low or even beyond. Because of this, you can afford to lose more trades than average and remain profitable over the long term.
Elements of pullback trading
There are four elements of pullback trading you must fully understand. So you have to consider the significant trend and three swings.
Below are these four elements:
- Determine the prevailing trend
- Identify the previous impulse swing
- Identify the corrective swing
- Trade the current impulse swing
Prevailing trend
The easiest way to determine the prevailing trend is to use long-term moving averages such as 100 EMA and 200 EMA. Although this is the most convenient way, the new trend has started earlier, even before the moving averages have seen it. The price action method of determining the trend using the market structure is still beneficial.
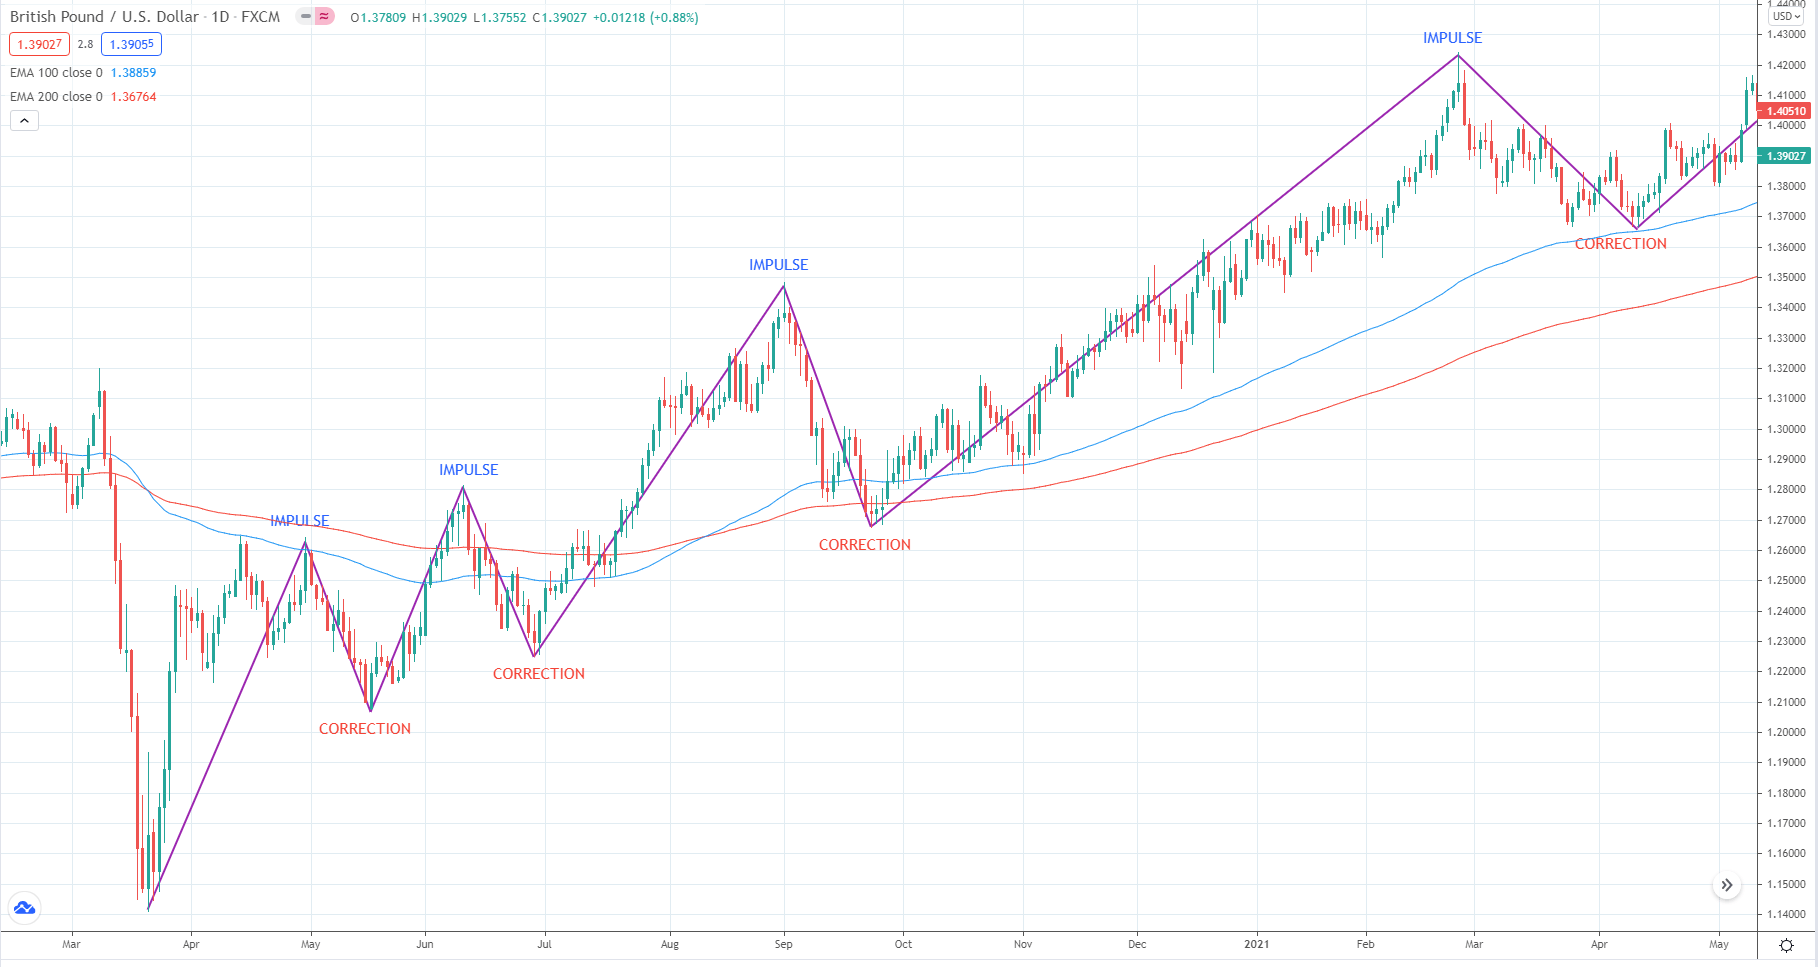
Refer to the above daily chart of GBP/USD. It is the same chart as the first chart in this article. However, this time we added the 100 EMA and 200 EMA. You could have seen the forming uptrend only after the third impulse swing to the upside with the use of these two EMAs.
Previous impulse swing
Despite the delayed trend confirmation, moving averages are still effective tools in trend trading. Using the above chart, you could take the third impulse swing as your previous impulse swing.
Corrective swing
The corrective swing in the above chart is the downswing after the third impulse swing. This corrective swing is your pullback swing. Here it is attempting to retest the moving averages.
Current impulse swing
The current impulse swing is the next swing after the pullback swing. This impulse swing is the trend continuation swing that will resume the overall uptrend. In pullback trading, your job is to predict the endpoint of the pullback swing so you can use it as a stop loss to your trade when you trade the current impulse swing.
In the next section, we will look at some pullback formations or patterns that can help you predict the end of the corrective swing.
Tradable pullback patterns
In this section, we will study seven of the most effective pullback patterns to watch out for. As you see them forming at the end of correction, refocus your trading compass and prepare to enter a trade back into the trend direction.
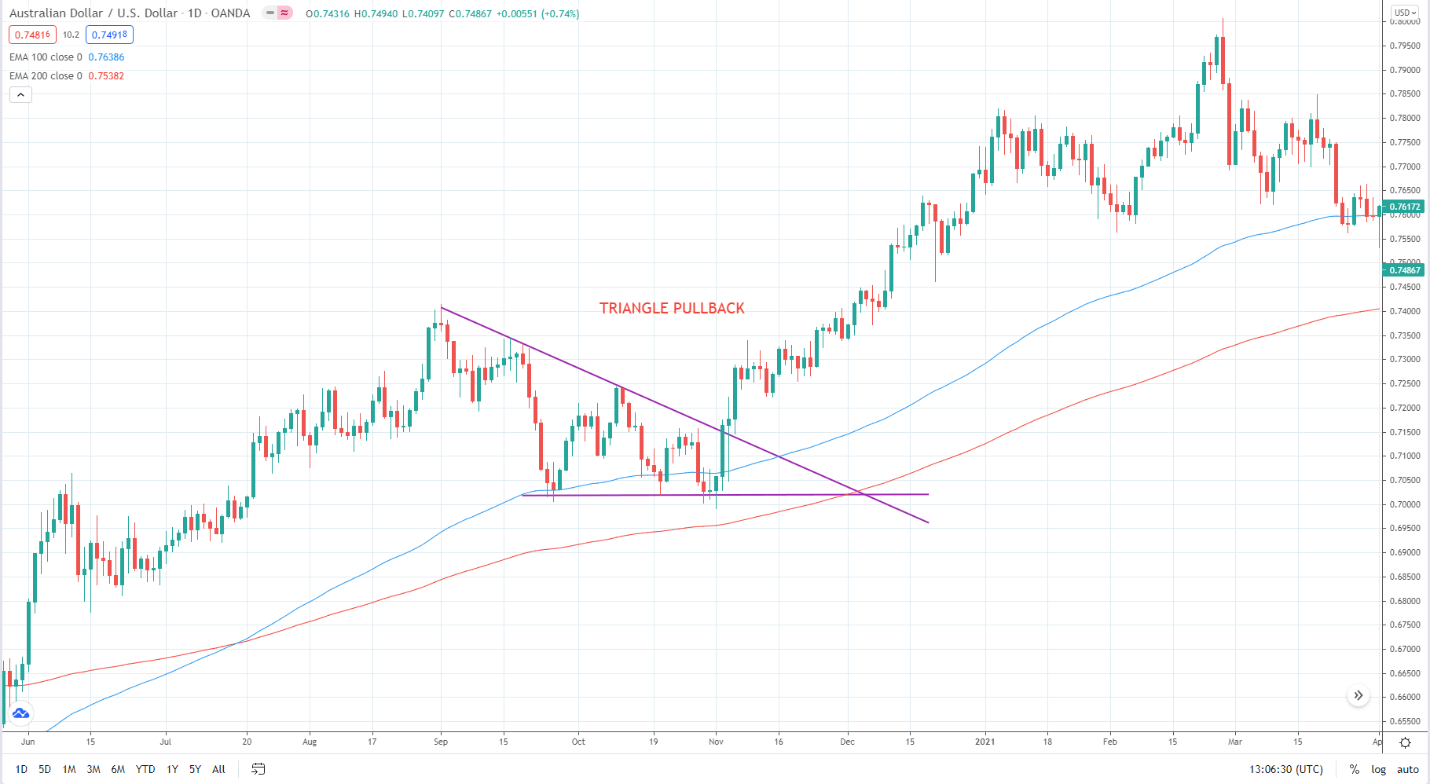
Triangle pullback
Consider the below AUD/USD daily chart. It shows a triangle at the end of the pullback. When you see this pattern forming while the corrective swing is in progress, prepare to open a trade the moment price breaks the triangle in the trend direction.
AB=CD pullback
The below daily EUR/GBP chart shows an example of an AB=CD pullback pattern in the context of an uptrend.
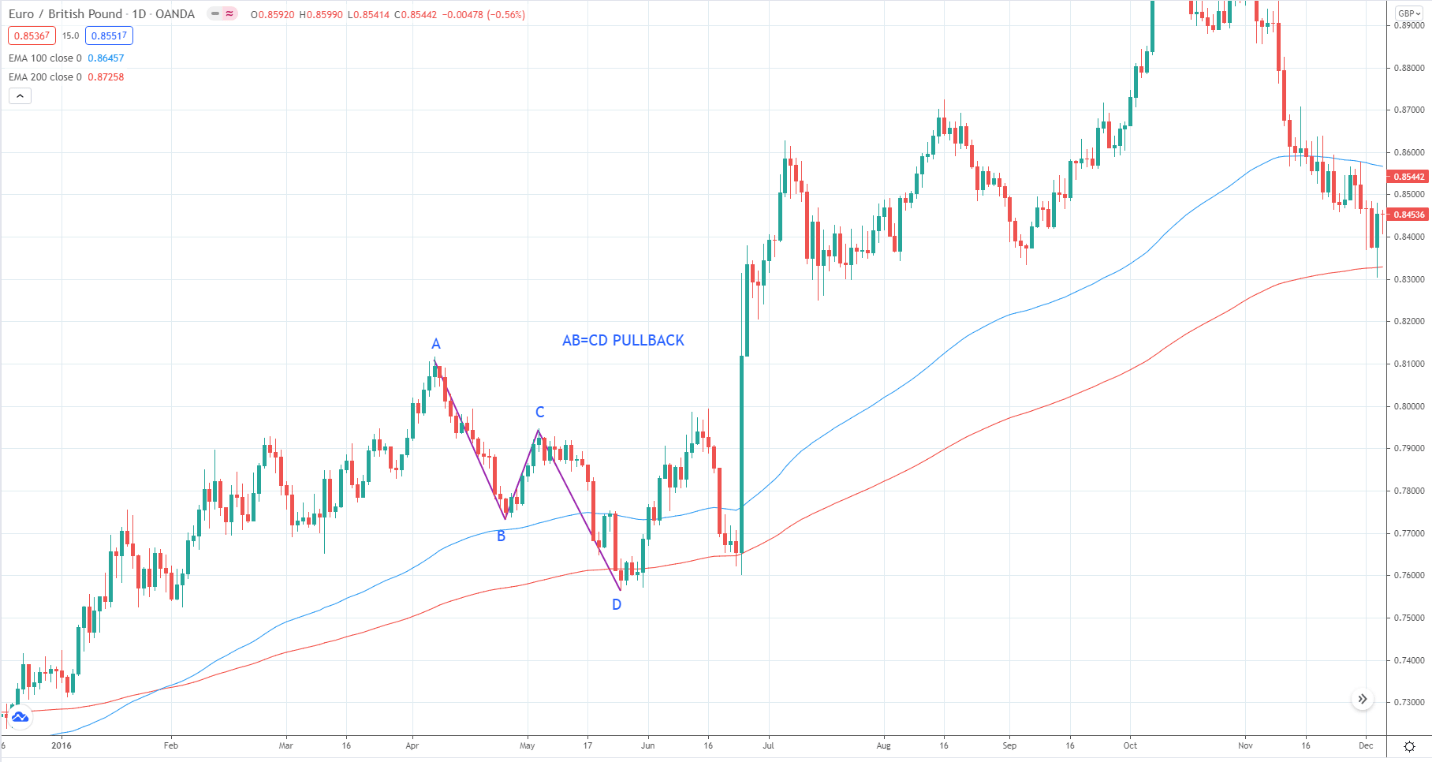
Opening a buy trade at point D can be challenging because the short-term momentum is still down. One way to enter this trade is finding another setup on the lower time frame near the completion of point D.
Complex AB=CD pullback
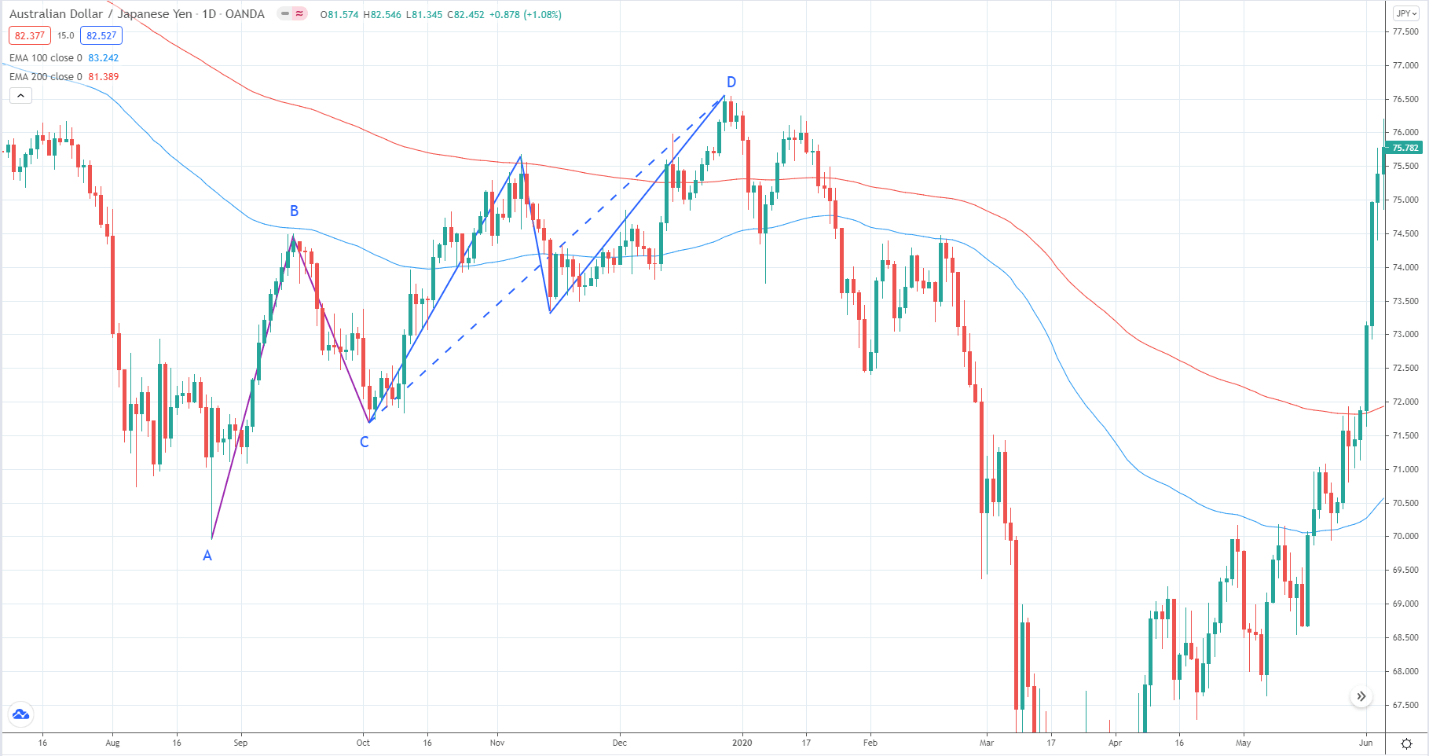
The below AUD/JPY daily chart shows an example of a complex AB=CD pullback. It is called “complex” because we take the last three swings as one leg of the more significant AB=CD pattern.
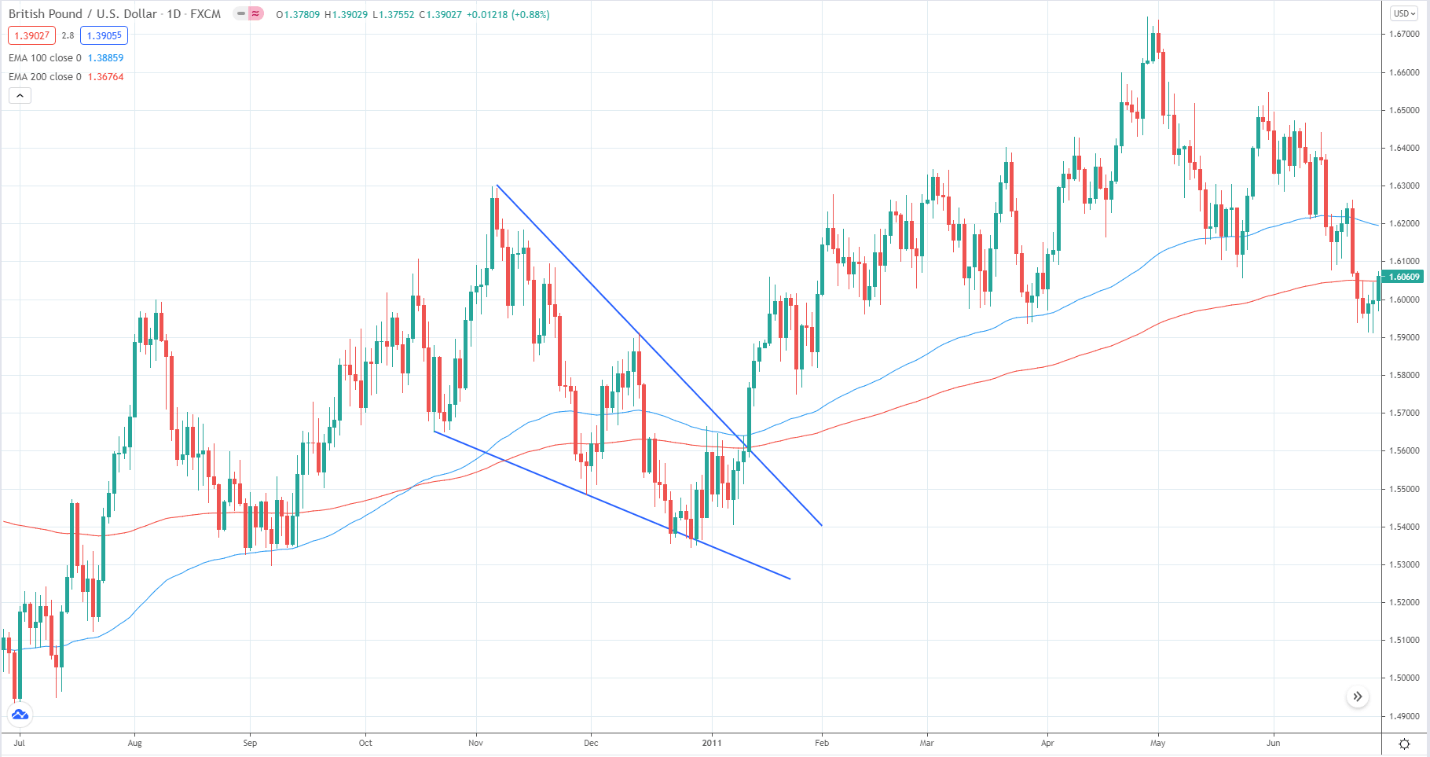
Wedge pullback
In the below GBP/USD daily chart, the price dipped a little below the 100 and 200 EMAs. However, you can already see that price is forming a falling wedge while the price is moving down. At this point, the uptrend was not yet that strong, so this offshoot occurred.
1-2-3 pullback
The below GBP/JPY daily chart gives us an ideal 1-2-3 pullback pattern. Your entry, in this case, would be the break of point 2. Therefore, you can place a buy stop a little above point 2 in anticipation of trend continuation.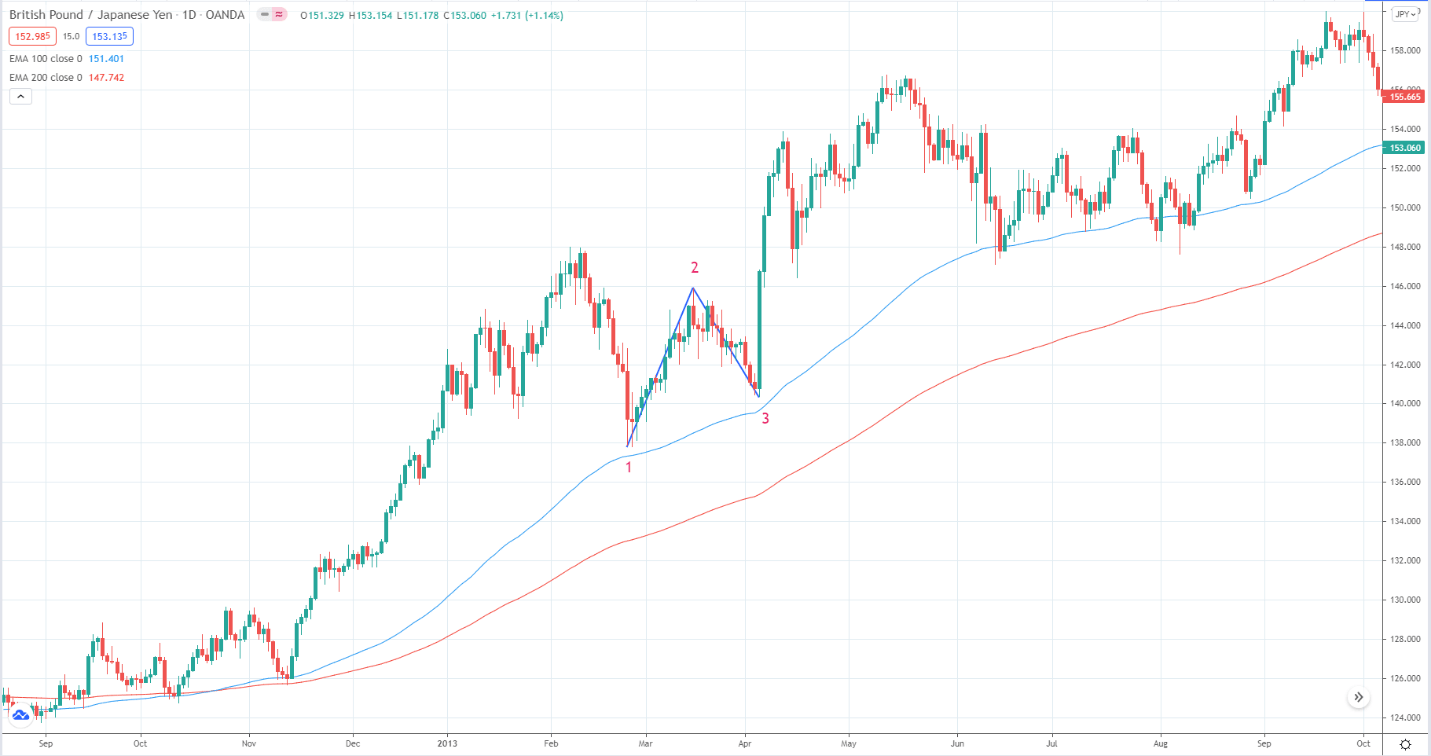
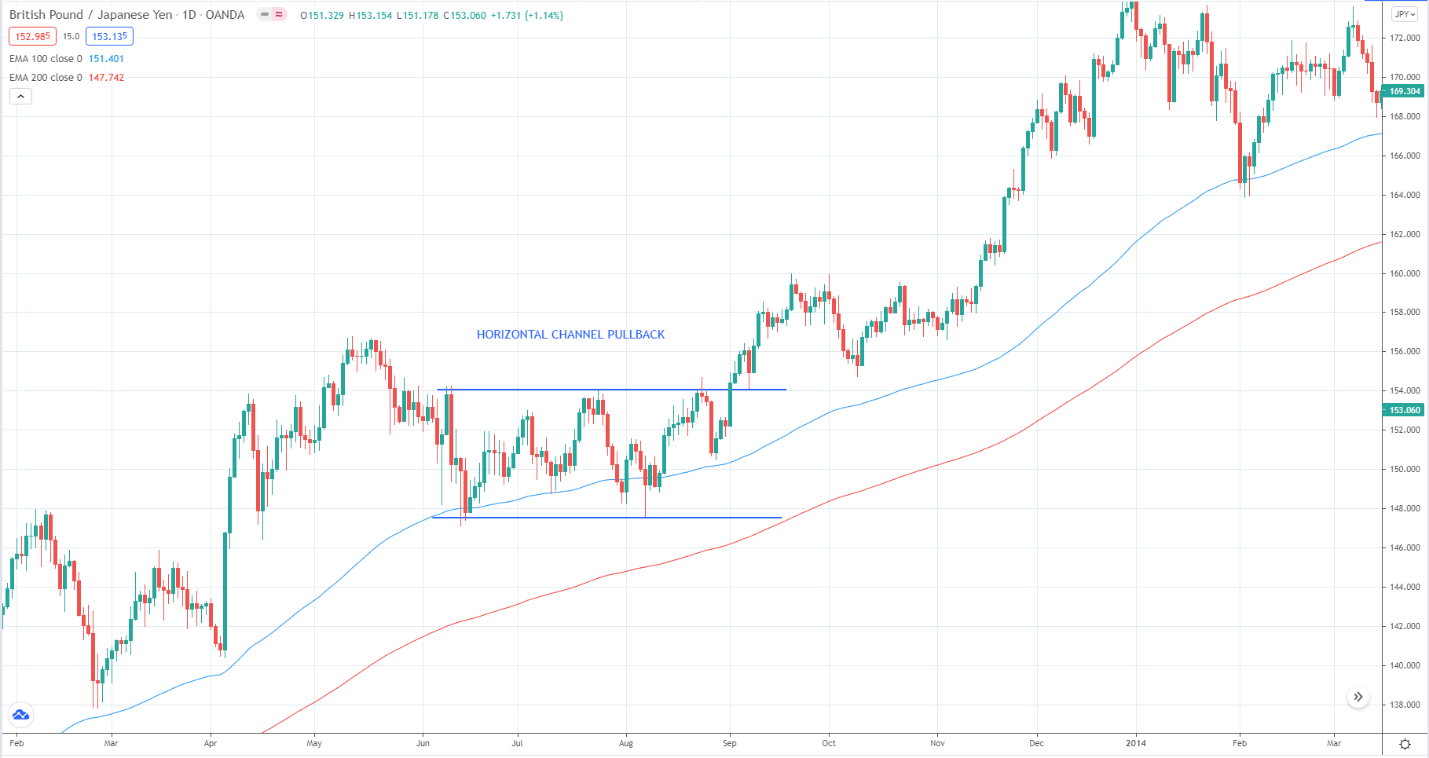
Horizontal channel pullback
On this GBP/JPY daily chart, you can see a clean horizontal channel pullback before the trend continuation. As you can see, the trend is still intact the whole time since the 100 EMA, and 200 EMA maintain a significant distance from each other.
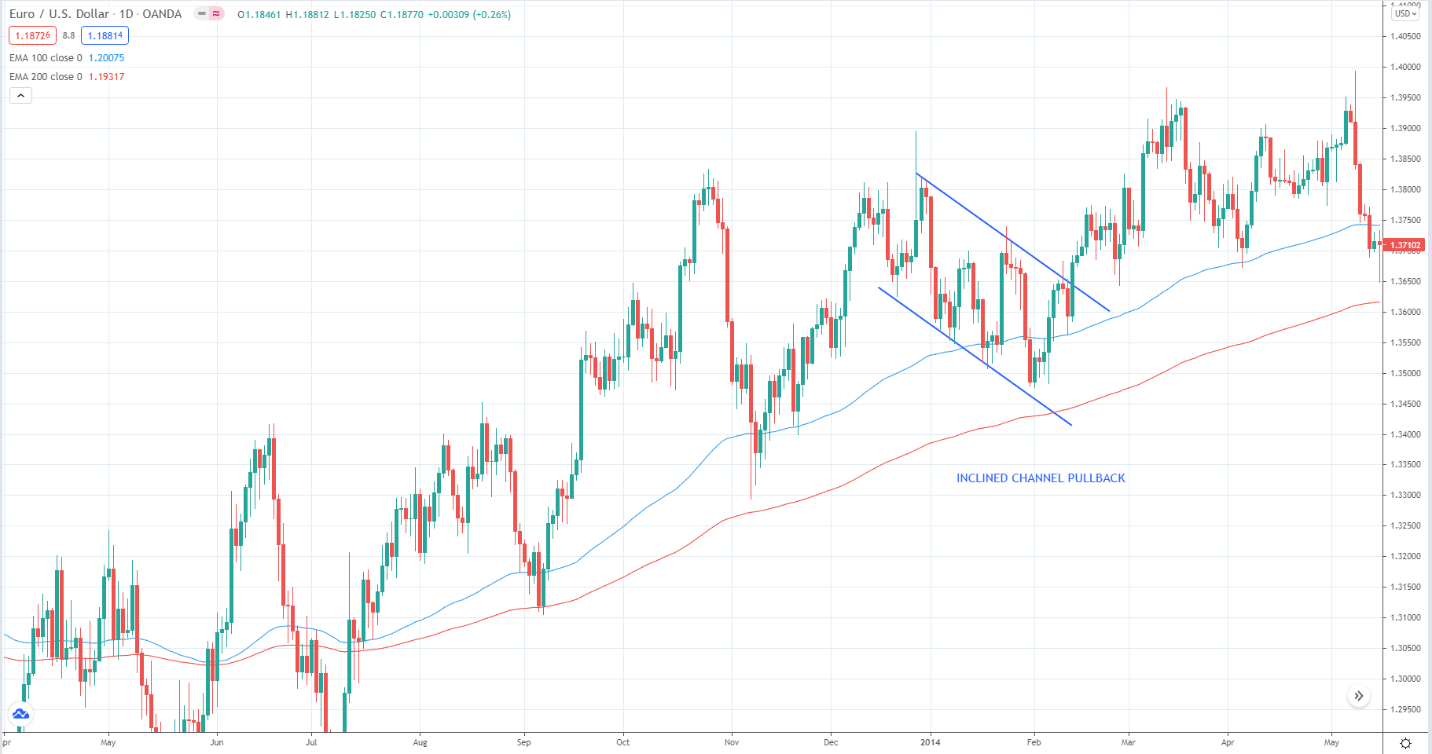
 Inclined channel pullback
The inclined channel pullback is another common pullback theme. Consider the below daily EUR/USD chart. Since the uptrend is still intact, you can start looking for a buy entry when the price entered the zone between the two EMAs.
Final thoughts
These pullback patterns occur very often in the markets at the end of retracements. Taking trades back into the trend direction using these patterns can lead to profitable trades. This is because the patterns themselves are tradable formations.
Understanding pullback patterns then can help improve your win rate and overall trading success. If you can add other factors such as divergence into the strategy, then the quality of your trades will increase severalfold.


Comments