The AB=CD pattern is a popular price pattern being traded by a group of traders known as harmonic traders. Scott Carney presented this setup in his Harmonic Trading book series. The AB=CD setup is the foundation underpinning the other advanced harmonic patterns.
Many traders trade this pattern because it is so easy to identify in charts. The pattern may form in any symbol and time frame, from one minute to the monthly chart.
What is the AB=CD pattern?
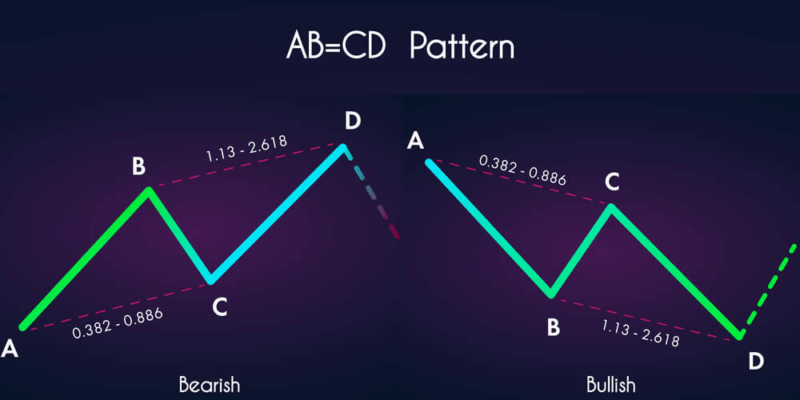
It is a price pattern composed of three swings: two impulses and one corrective. A good pattern is such that follows a given sequence.
- First, the price must thrust in any direction.
- Mark the starting point of this first impulse swing as point A and the ending point as point B.
- Next, the price must correct a portion of the impulse swing, but the correction should stop before starting the impulse swing.
- Mark the endpoint of the correction as point C.
Finally, the price continues in the direction of the first impulse swing and breaks the ending point of that swing. When price reaches a point beyond point B central to the vertical distance between points A and C, the AB=CD pattern is complete. The ending point of the second impulse swing is point D.
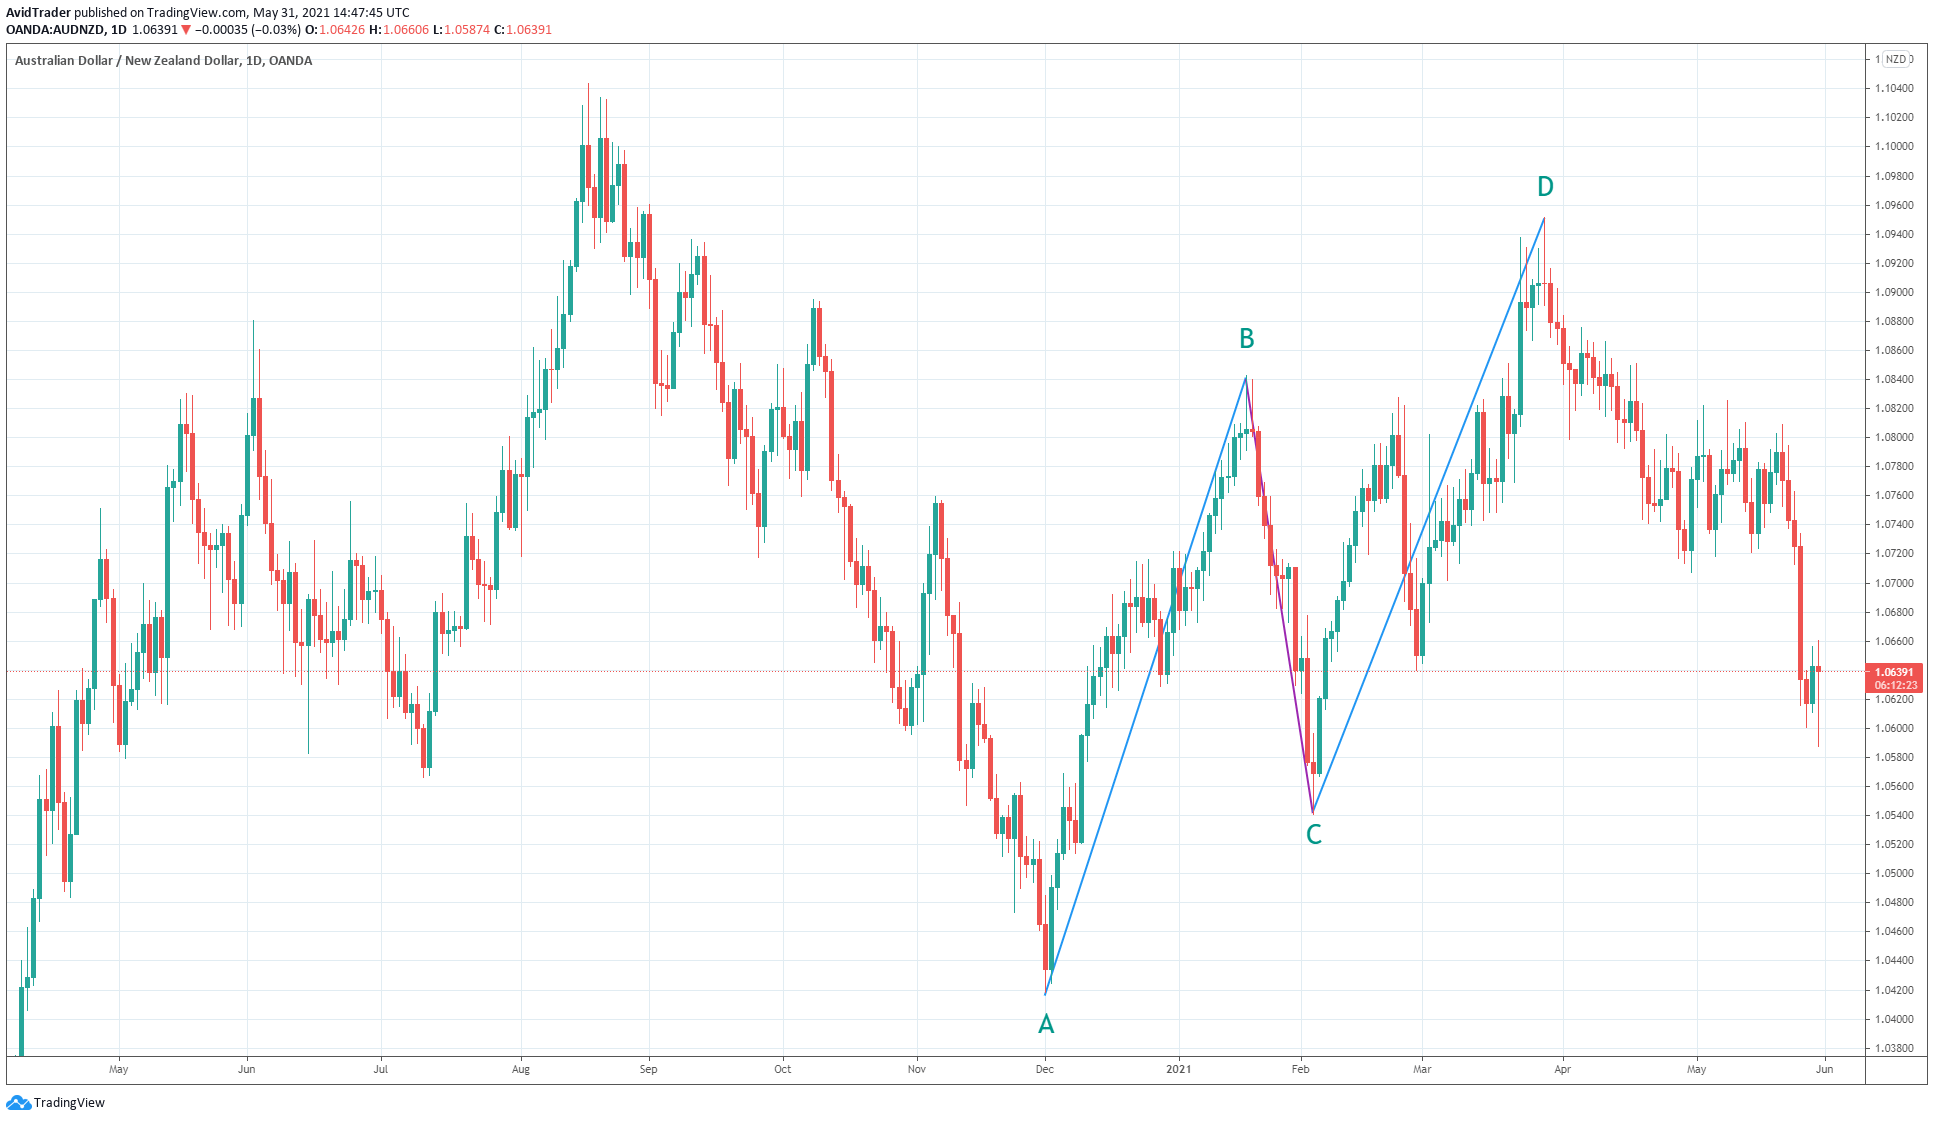
Look at the big AB=CD pattern that formed on the daily chart of AUD/USD. The two impulse swings look very symmetric. See the subsequent reversal after the completion of the pattern.
What qualifies as an AB=CD pattern
The original setup presented by Scott Carney uses specific measurements to qualify the pattern. These measurements use Fibonacci numbers. To have a proper setup, the length of swings must end at or near the defined Fibonacci ratios.
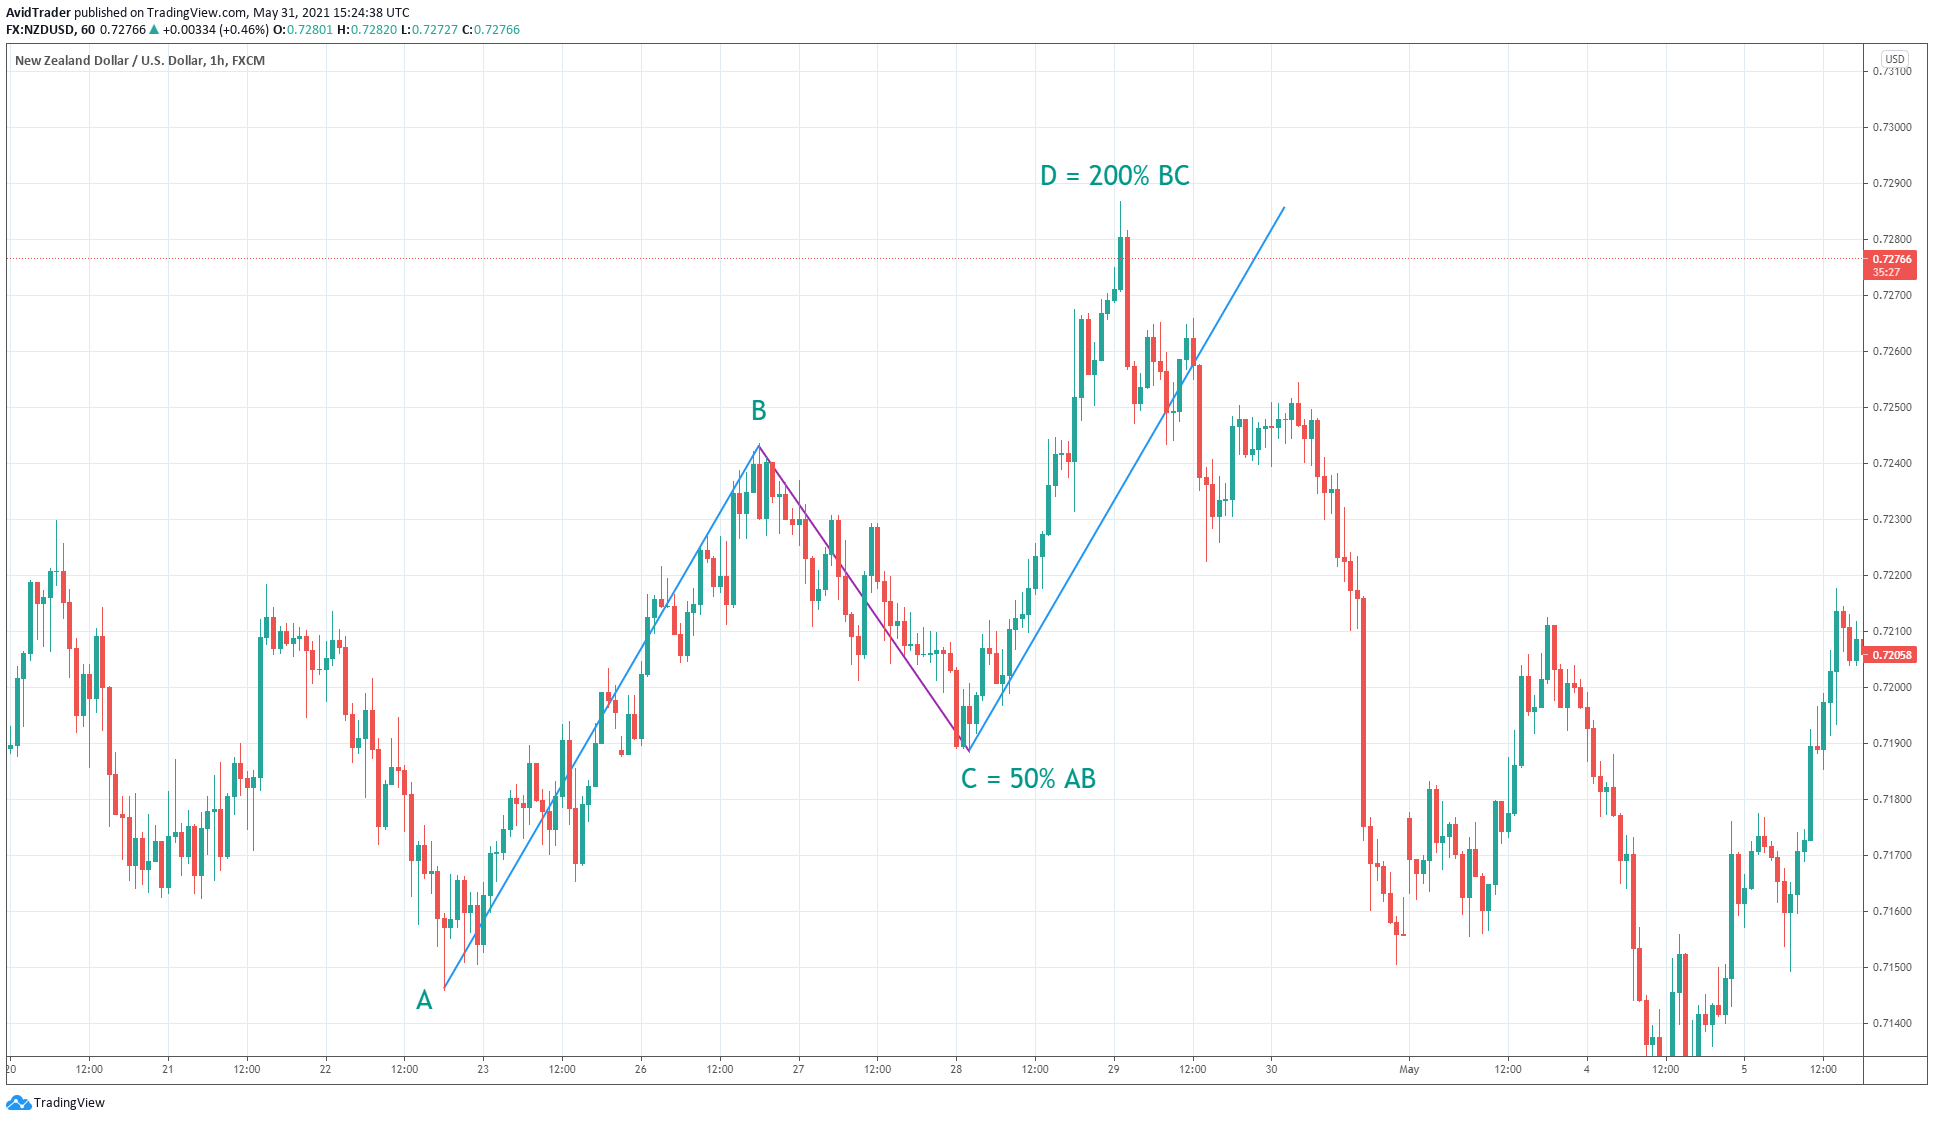
The above hourly NZD/USD chart presents a perfect AB=CD setup. A proper setup should look like this. A perfect AB=CD pattern is one whose point C ends at the 50% level, and point D ends at the 200% projection of swing BC.
The following table shows other combinations considered as perfect AB=CD setups:
|
Point C retracement |
Point D completion |
|
38.2% |
224% |
|
61.8% |
161.8% |
|
70.7% |
141% |
|
78.6% |
127% |
|
88.6% |
113% |
However, note that the length of swings doesn’t need to follow the prescribed measurements. What is essential is that point C culminates near the required retracement level, and point D ends near the completion point.
A simple approach to identify AB=CD pattern
You can draw the AB=CD pattern even if you are not aware of the specified Fibonacci numbers. However, there is an easier way to find AB=CD patterns on your chart. You do not even need the Fibonacci retracement tool. This method is a more subjective way of drawing the AB=CD pattern, but its effectiveness is nonetheless on par with the original approach.
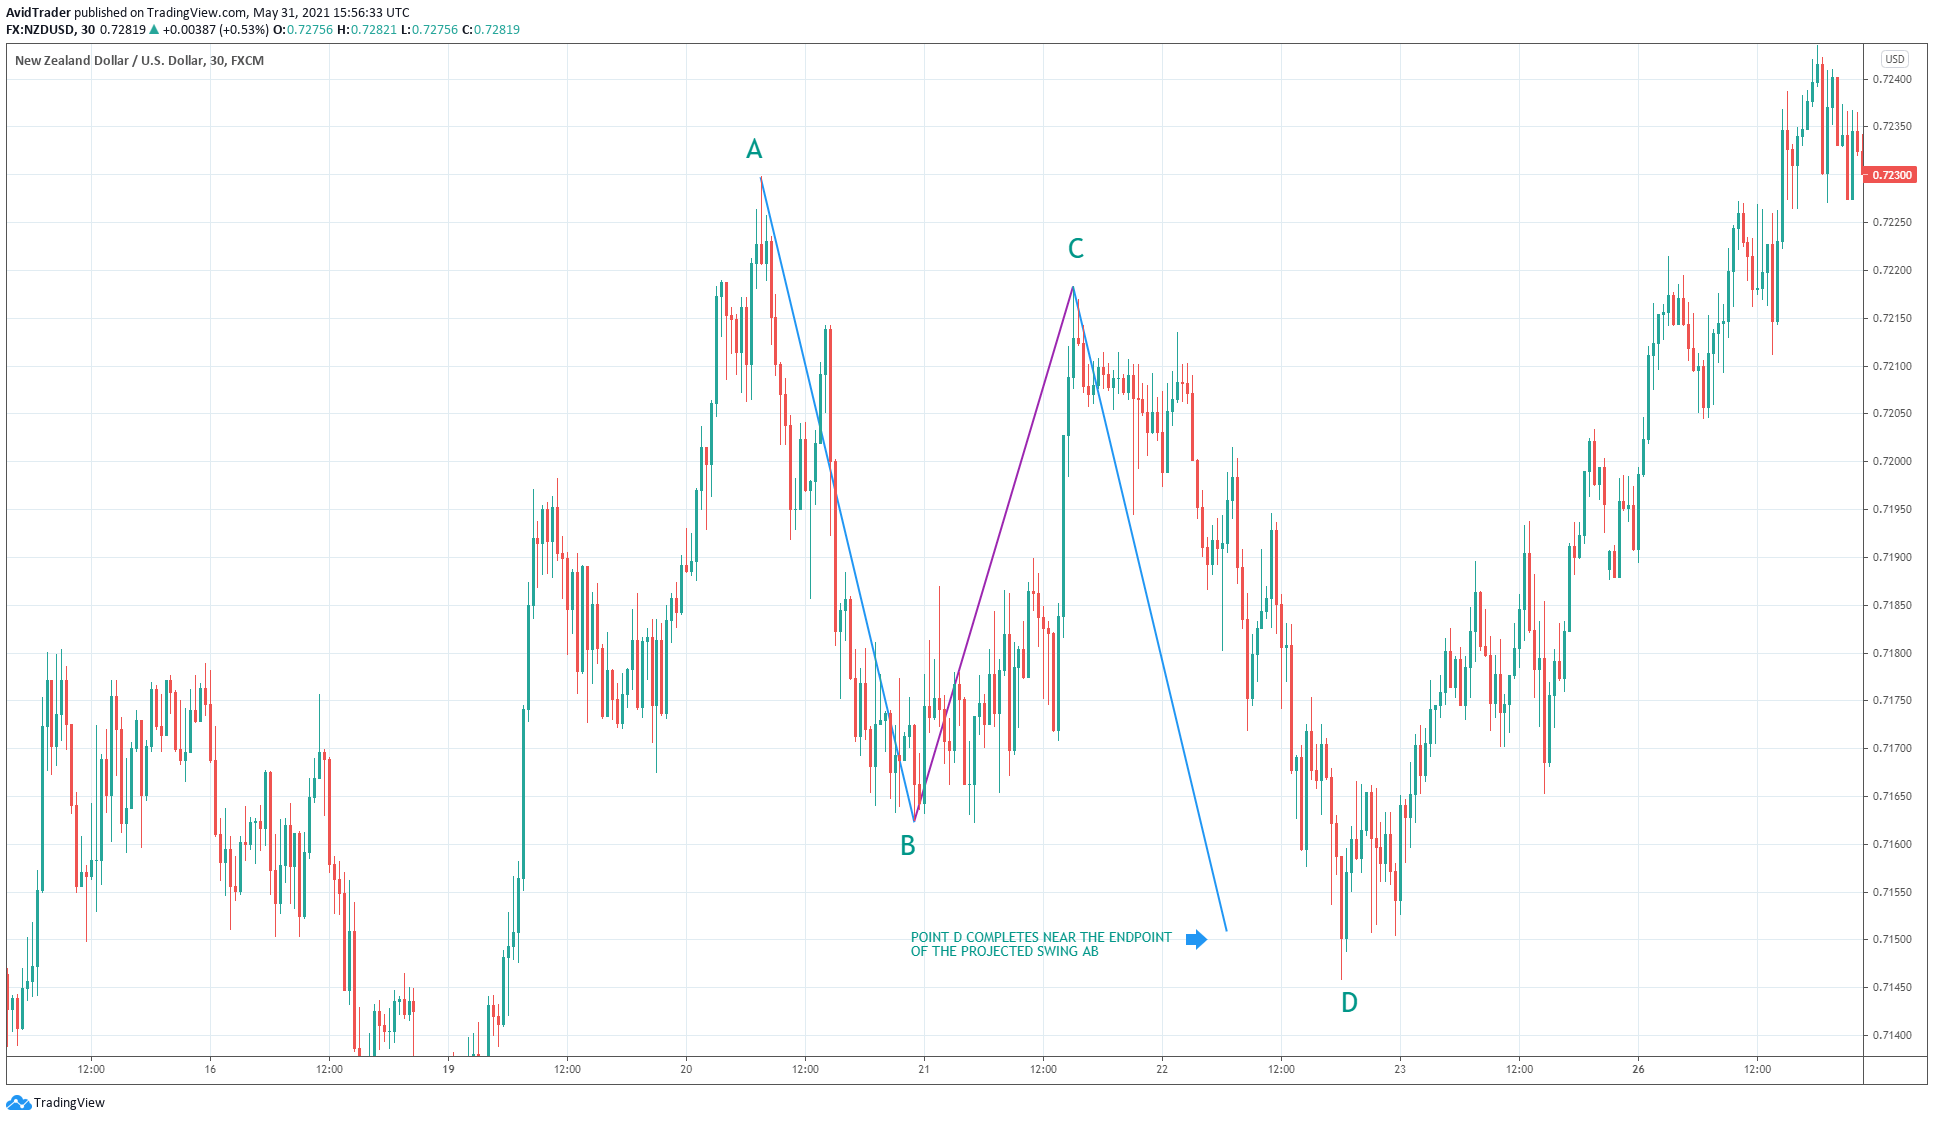
What you need are just trend lines to mark the three swings. Then, if the length of swing AB is equal to the length of swing CD, you have found a good pattern. That is why Scott Carney called the setup AB=CD, not merely ABCD.
Refer to the above 30-minute chart of NZD/USD and follow along the steps below to construct the pattern using trend lines:
- Identify a swing (up/down), draw a trend line from the starting point to the ending point of that swing.
- Draw a trend line from the ending point of the previous swing to the ending point of the corrective swing.
- Copy the first trend line and align its starting point with the disciplinary swing endpoint.
As you can see in the chart above, the endpoint of the projected swing did not coincide with the actual point D. It is no big deal in defining and trading the AB=CD pattern. The price factor is more important than the time factor.
Trading AB=CD pattern with confluence
If the AB=CD pattern works as a standalone reversal signal, how much more than when used in conjunction with classical support and resistance. This approach is known as trading with confluence.
The good thing about combining the pattern with support and resistance is that these tools complement each other in giving one signal. This signal is a price reversal at the point of intersection.
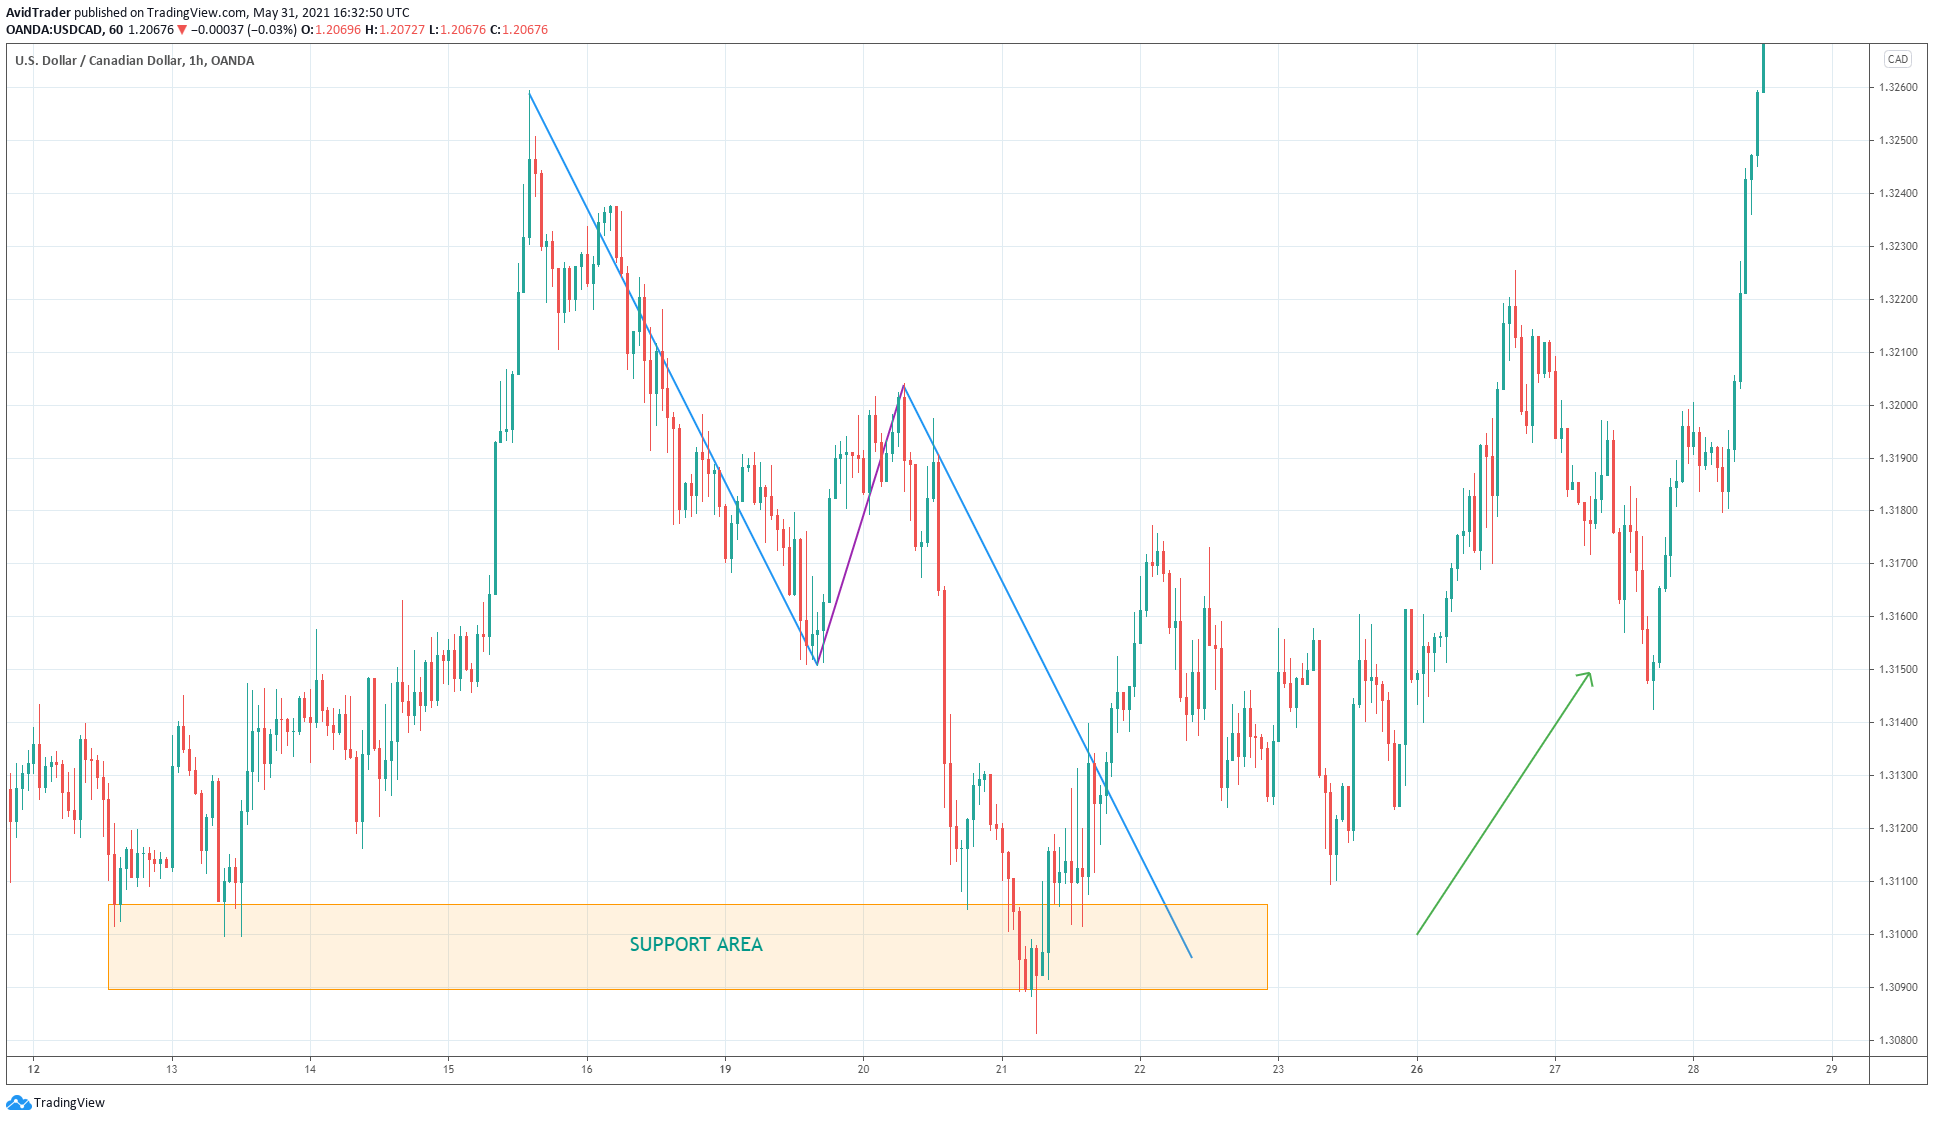
In harmonic trading parlance, the completion point of the AB=CD pattern is called the potential reversal zone. Meanwhile, support and resistance levels are also supply and demand areas where orders are waiting to fill. Thus, when price enters those areas, there is a better chance of reversal than a continuation.
Consider the above hourly chart of USD/CAD. Price formed three swings as it moved toward the prominent support area. Although the price got past the completion point of the AB=CD pattern and broke the area a little, it eventually stopped and turned the other direction. What follows was a strong trend reversal to the upside.
The best way to trade the AB=CD pattern
Sure, you can find plenty of AB=CD setups on your chart day in and day out. However, many of them run counter to the trend on the active time frame. While it is possible to trade such setups successfully, the probability of success is low as you are trying to stop a moving locomotive in a manner of saying.
The best way to trade the AB=CD pattern, like all other setups, is when it aligns with the trend. Dealing this way has higher chances of success than sailing with the wind on your back. Trading with the trend has an inherent advantage over otherwise.
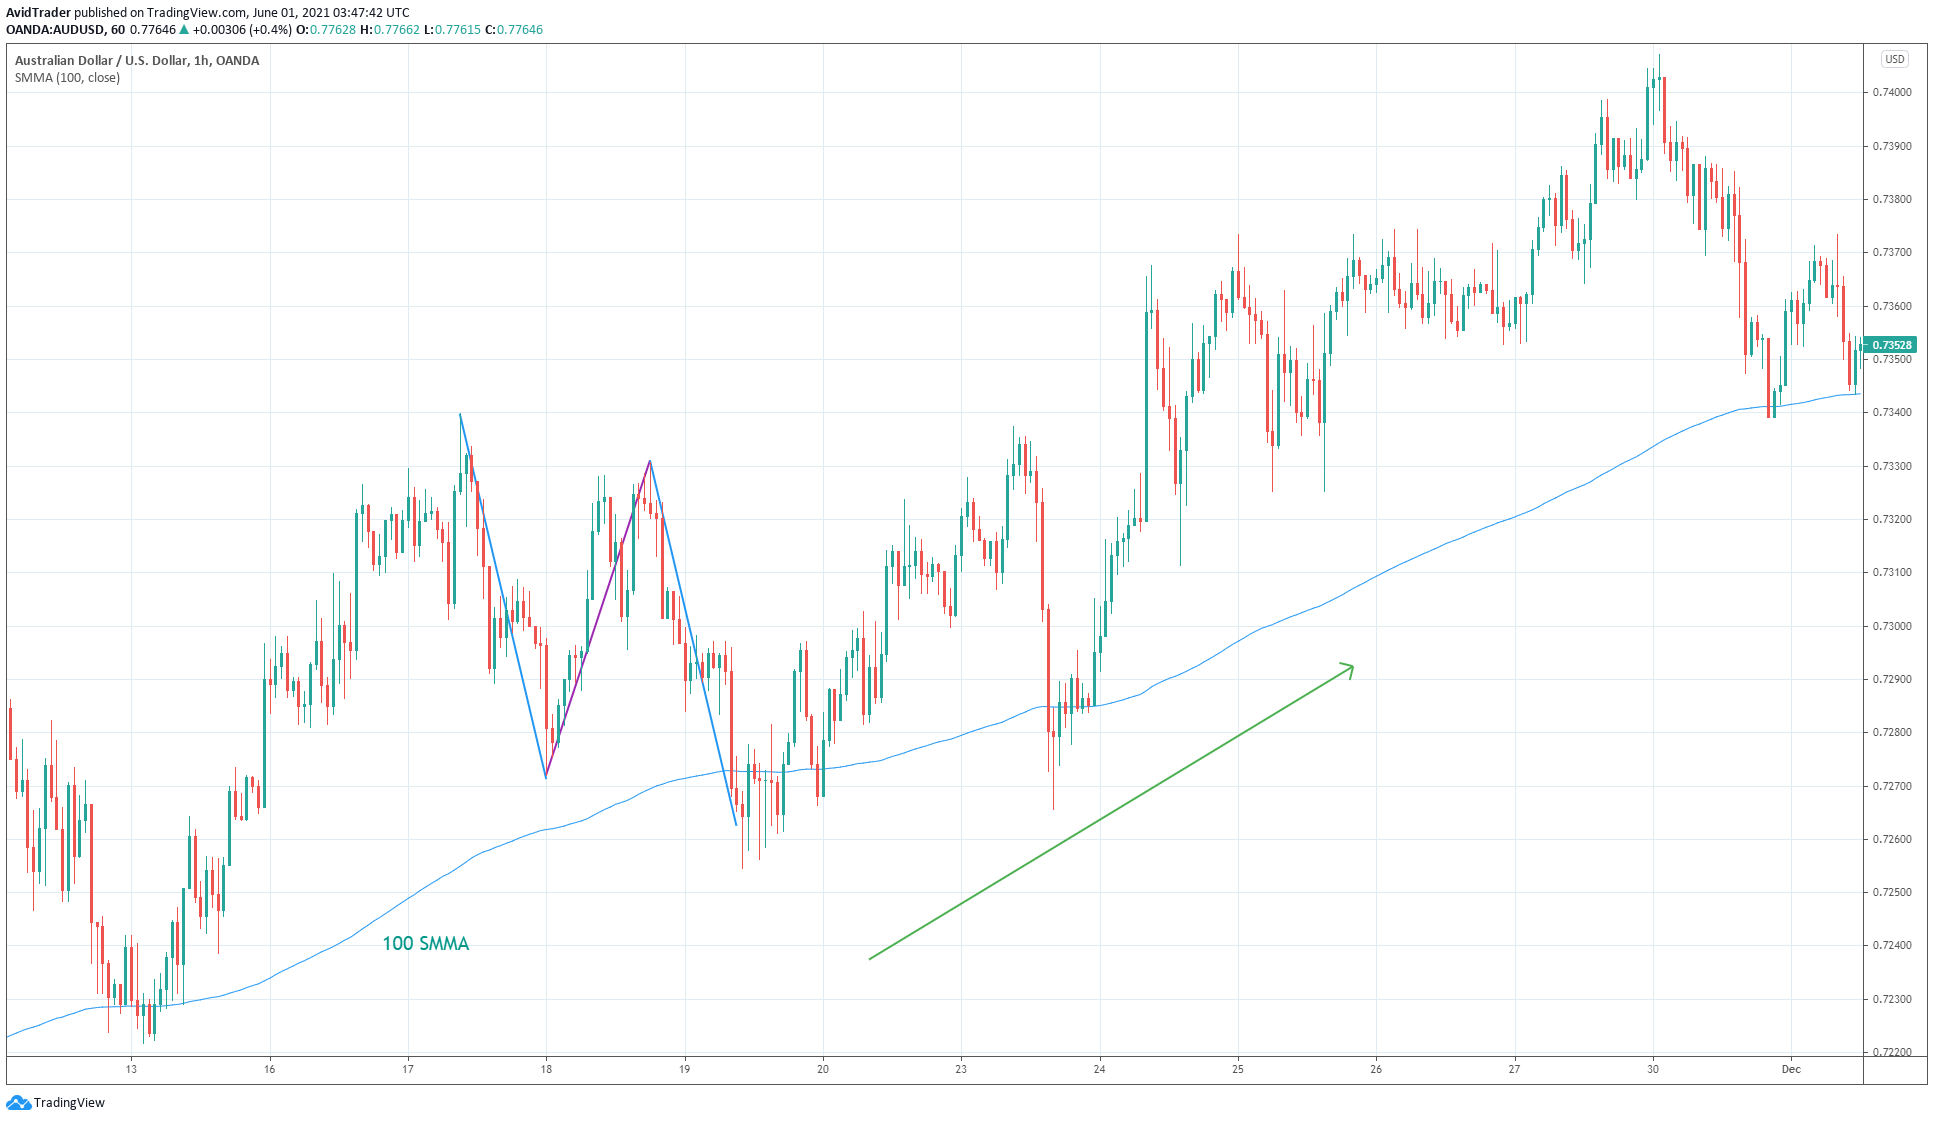
Consider the hourly chart of AUD/USD above. The buy AB=CD setup formed in line with the prevailing uptrend indicated by the 100 smoothed moving average. If you had taken this buy entry, you could have enjoyed a hefty profit as the trend took price dramatically higher.
Therefore, you should avoid taking sell AB=CD setups when the dominant trend is bullish. On the other hand, you must ignore buying AB=CD setups occurring in a predominant bearish trend.
Final thoughts
You cannot discount the power of the AB=CD pattern as an indicator of price reversal. However, you can find many successful setups when you look at your charts. Plenty is even forming as you read about this article.
To trade this pattern successfully, use it in line with the trend and other confirmatory tools. What comes next is practice trading through a demo account. Then you will see firsthand if indeed the pattern holds water when traded in real-time.


Comments