
As a trader, you must be familiar with the maxim, “The trend is your friend.” Did you know where this concept came from? Without much fuss, the idea comes from Dow Theory, which is older than the currency market itself. While the forex market started in 1931, Dow Theory surfaced 30 years earlier, in 1901.
This means that Dow Theory was not developed for currency traders. It existed to provide an understanding of how the stock market works. So why are we talking about this theory when we trade currencies? One reason is that this theory applies to all financial markets. The concepts it put forward still hold value now as it was more than a century ago.
This article will learn about the salient points of Dow Theory that you can apply to your trading.
Definition of a trend
Dow Theory identifies two types of market: bull and bear. The term market refers to none other than the trend itself.
- A bull market prints higher highs and higher lows.
- A bear market registers lower highs and lower lows.
So this is the structure of a trend. Although the price may range/correct within the trend, the market is considered intact as long as the overall structure is in place.
Look at the daily chart of USD/JPY.
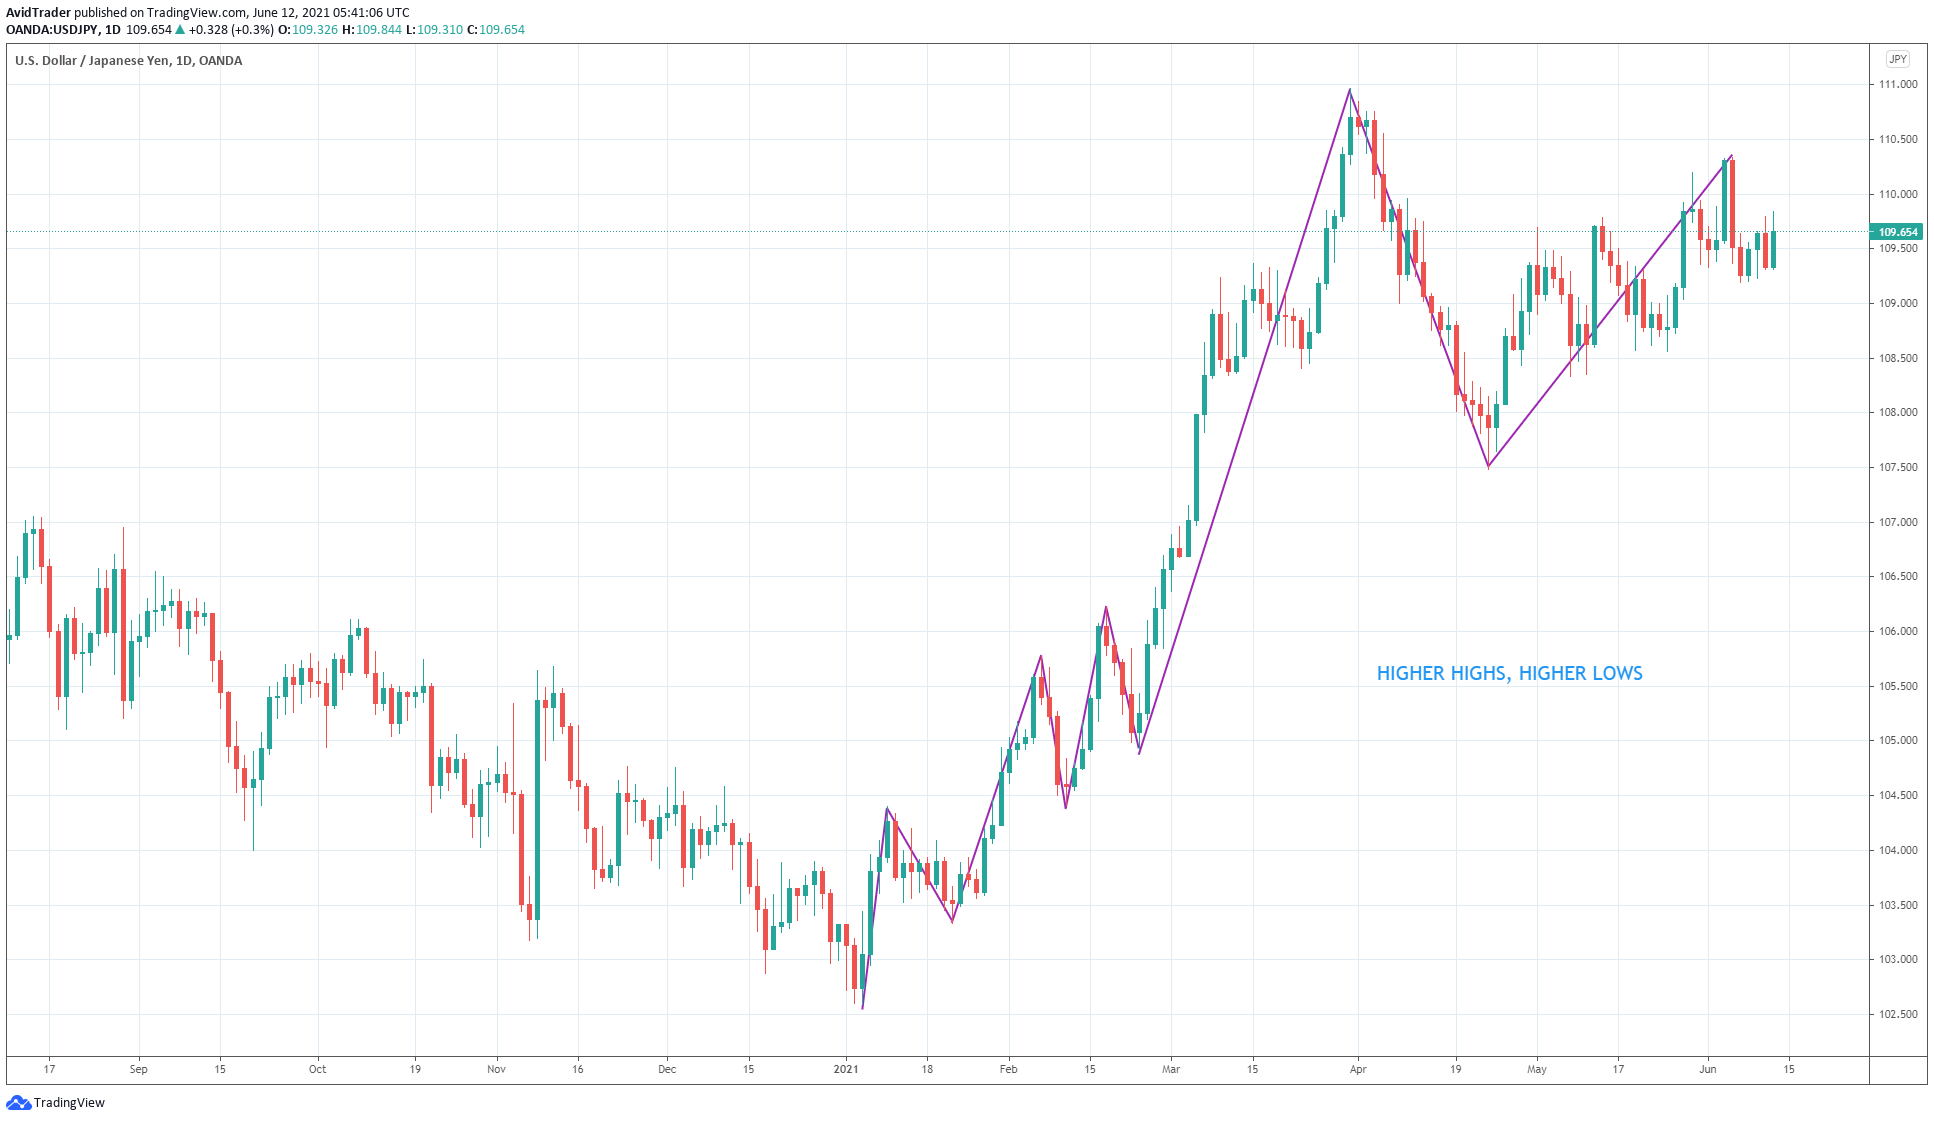
You can see that the price made higher highs and higher lows while moving up. This shows that a bull market is in place. Currently, the price is within the range of the previous peak on 31 March 2021 and the swing low on 23 April 2021. As long as the price stays above this low, assume this uptrend continues.
Early detection of a trend reversal
Dow Theory provides a clear definition of a trend reversal. A broken market structure will signify this event. For example, when a bull market exists and suddenly the market prints a lower low suspects a shift in market sentiment. If a lower high transpires later, followed by a break of the new low, then you are seeing the official inception of a bear market.
The EUR/AUD daily chart shows an example of a bear market transposing into a bull market.
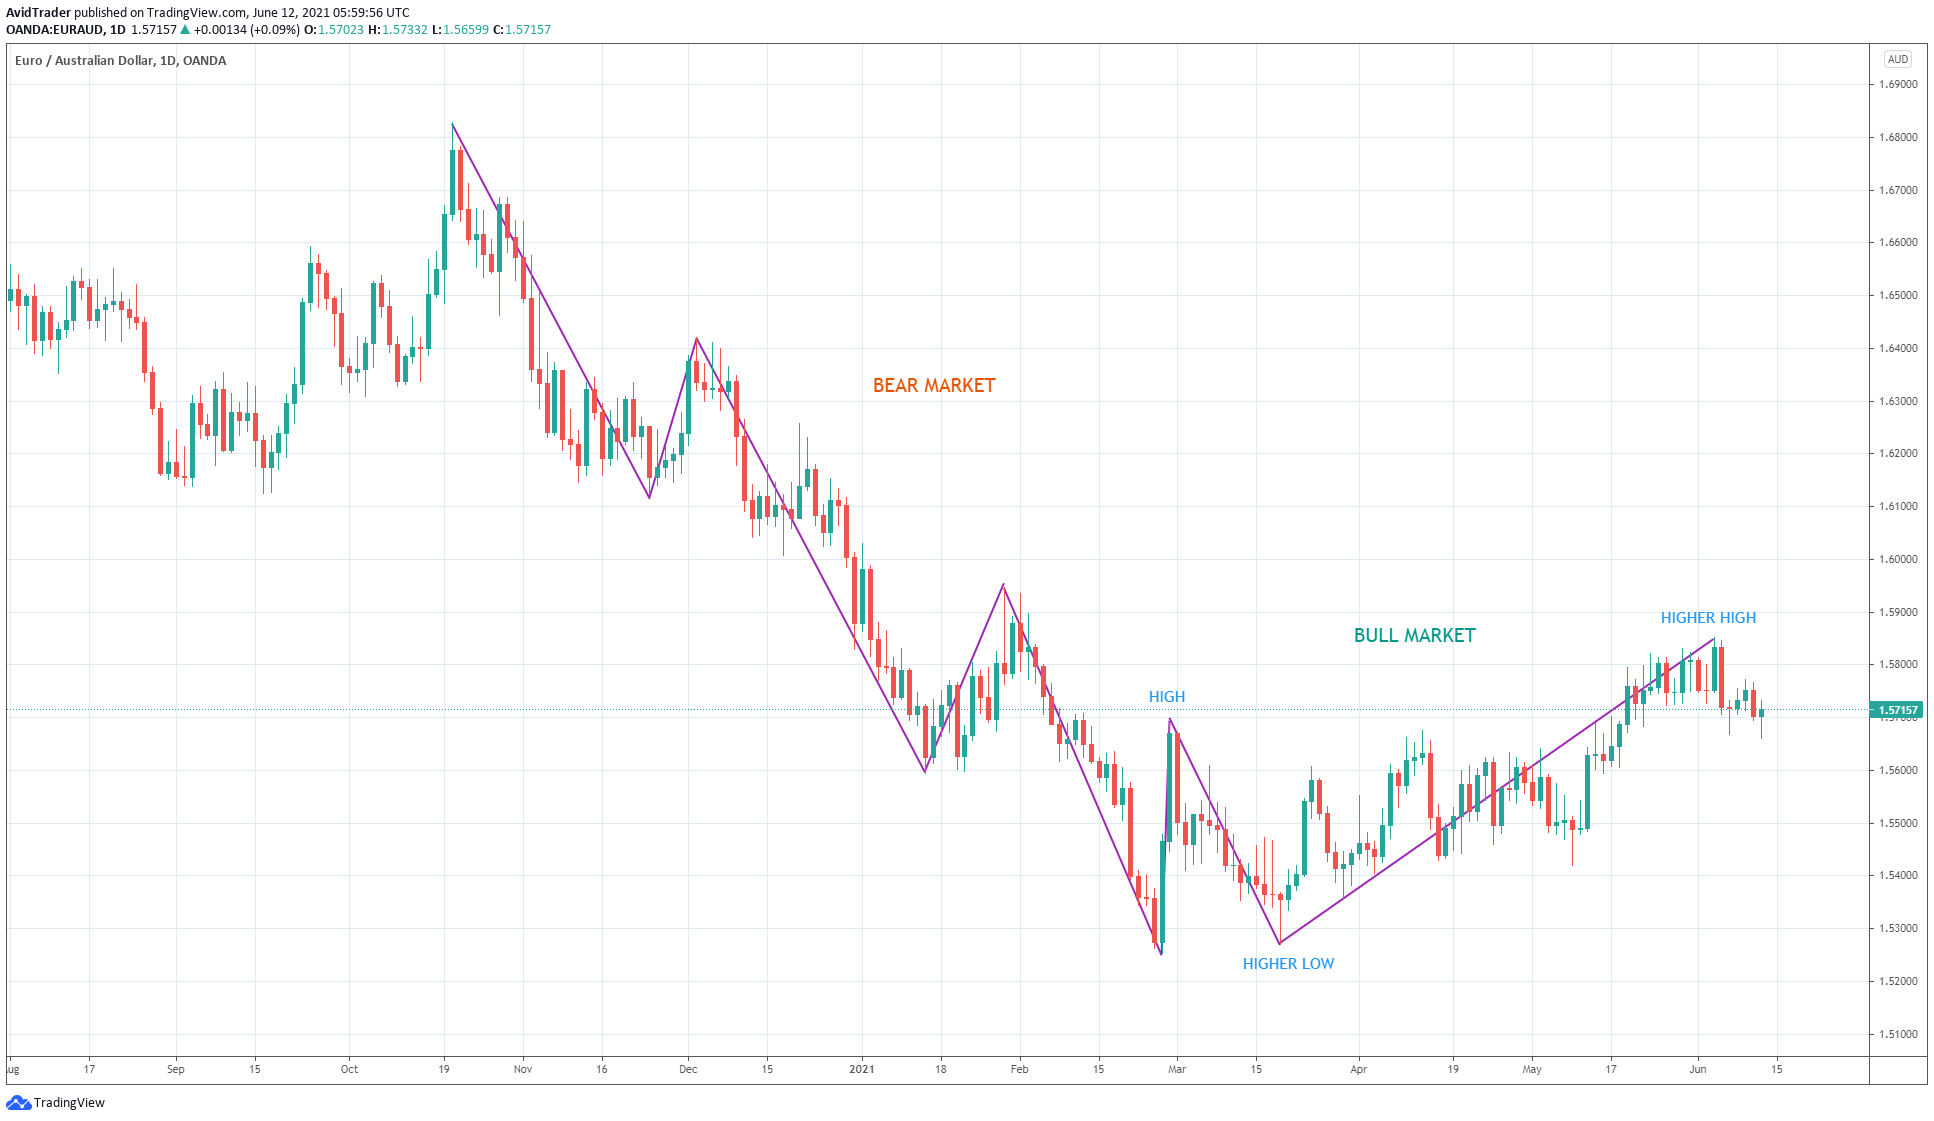
The bear market started on 20 October 2020 when a peak to the left of the chart was established. Then, on 25 February 2021, the market made the recent lowest low followed by a higher low on 18 March 2021. Finally, a new higher high came about on 03 June 2021. This price action is telling us that a bull market has begun on this instrument.
Three types of market movement
This theory posits three types of market action. Learning about this can help you trade with the rhythm of the market regardless of your trading profile. Everyone is already familiar with this concept as we use it every day, though in different terms. These market movements are the following:
- Primary movement
- Secondary movement
- Daily fluctuations
The primary movement is the impulse swing, while the second movement is the corrective swing. For a bull market, the impulse swing is the price advance, and the corrective swing is the price decline. Conversely, the impulse swing is the sell-off for a bear market, and the corrective swing is the rally.
On the other hand, daily fluctuations are simply the sentiments of individual bars on the daily chart.
- If a candle closes above the open price, it is called an up day.
- If a candle closes below the open price, it is called a down day. These individual candles can also give a clue about the potential direction of the market’s near term.
For example, if the previous day is an up day, traders will open long if the price takes out the last day’s high. Of course, this assumes the previous day’s sentiment to continue.
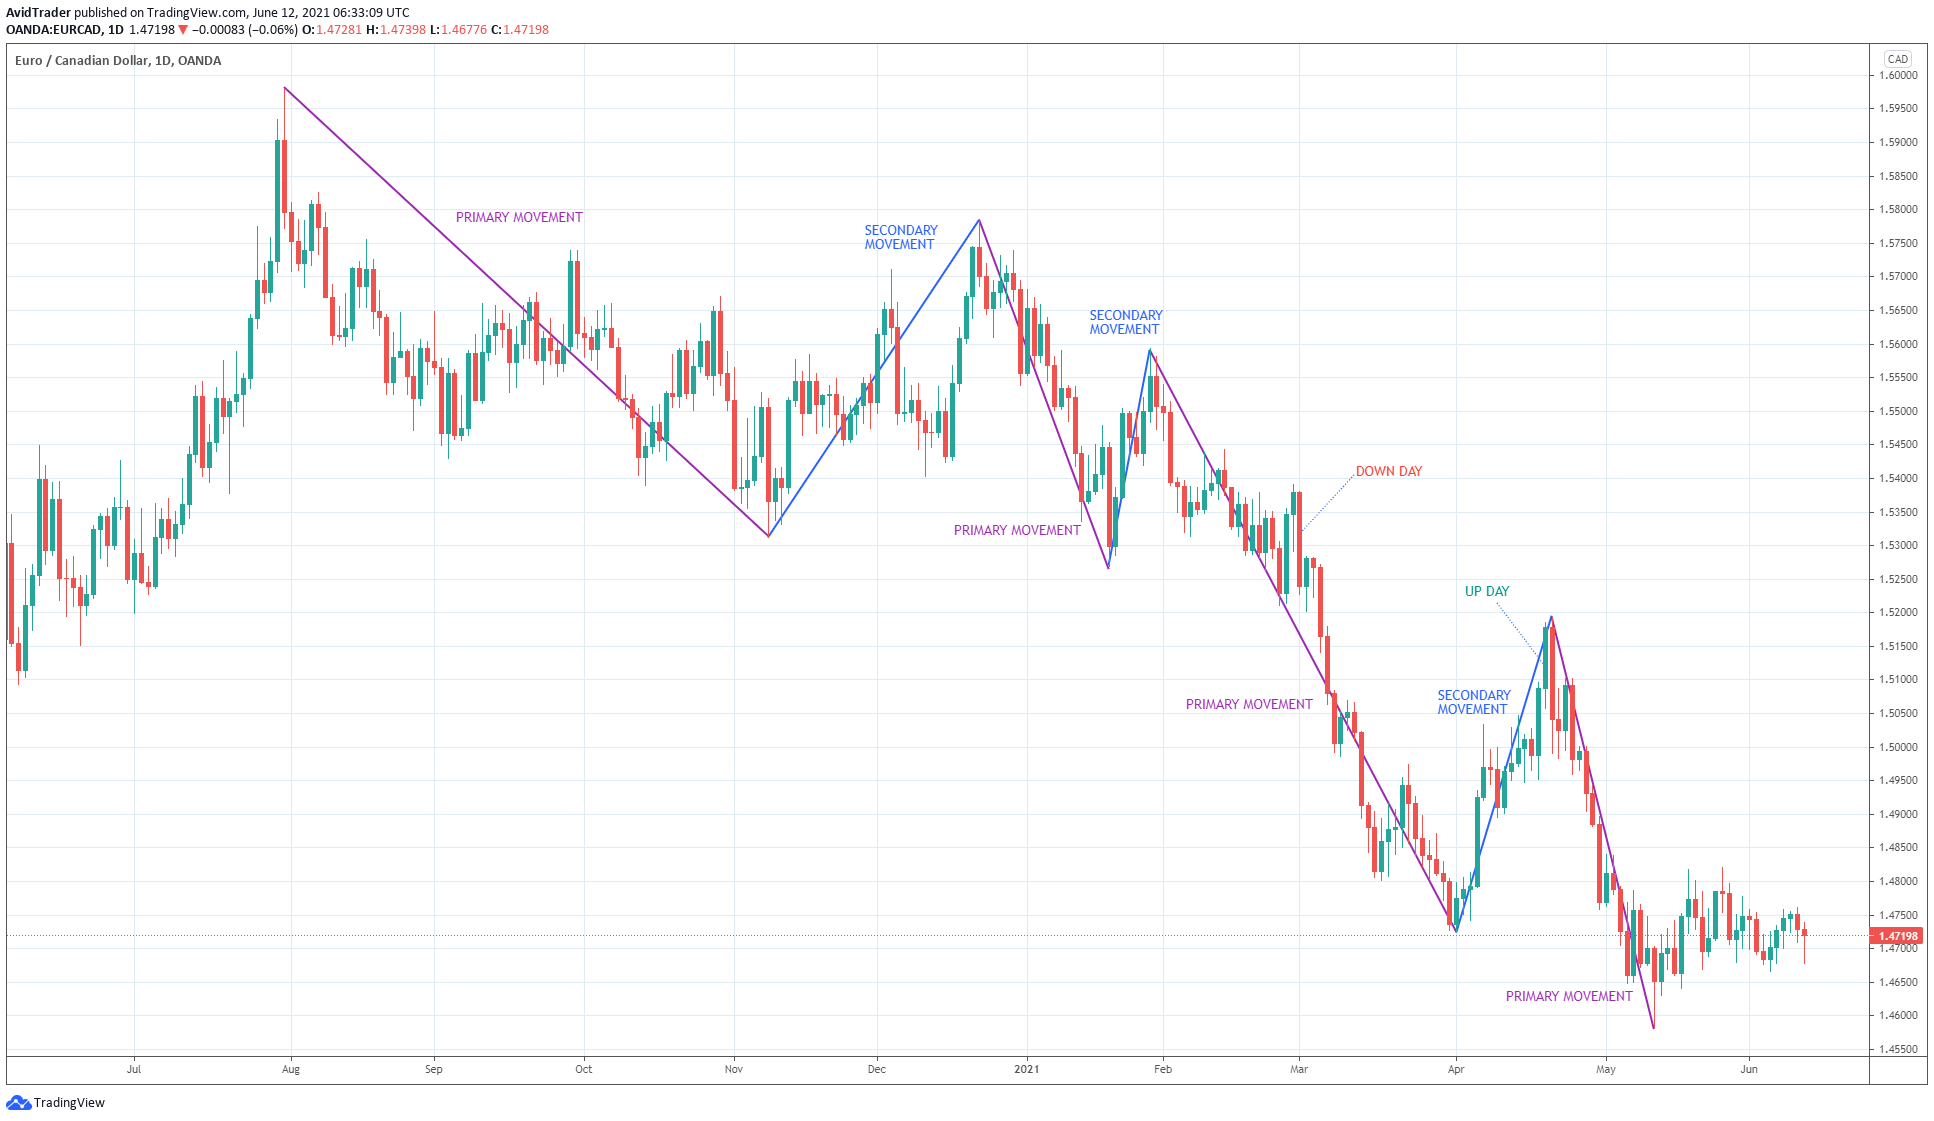
The above EUR/CAD daily chart illustrates the three types of price movement. Since the structure is lower low and lower high, the current market is bearish. Each impulse swing down is the primary movement, while each counter swing is the second movement. Meanwhile, each daily candle can be an up or down day, depending on its color.
“How can this information help me as a trader?” you might ask.
This information will help you take high-quality trades. Since you know the trend is bearish, you must trade in that direction. But first, you need to wait for a correction. After the correction, you can enter the trade on a down day. This ensures your deal is in sync with the short-term sentiment and the long-term trend.
Three market stages
It was Dow Theory that first put forward the idea of market stages in bull and bear markets. Knowing the market’s stage can help you plan the trades. This way, you can join in as the market transitions from one stage to the next.
The table below presents the three stages for each type of market:
| Bear market | Bull market |
| Distribution | Accumulation |
| Big move | Big move |
| Despair | Excess |
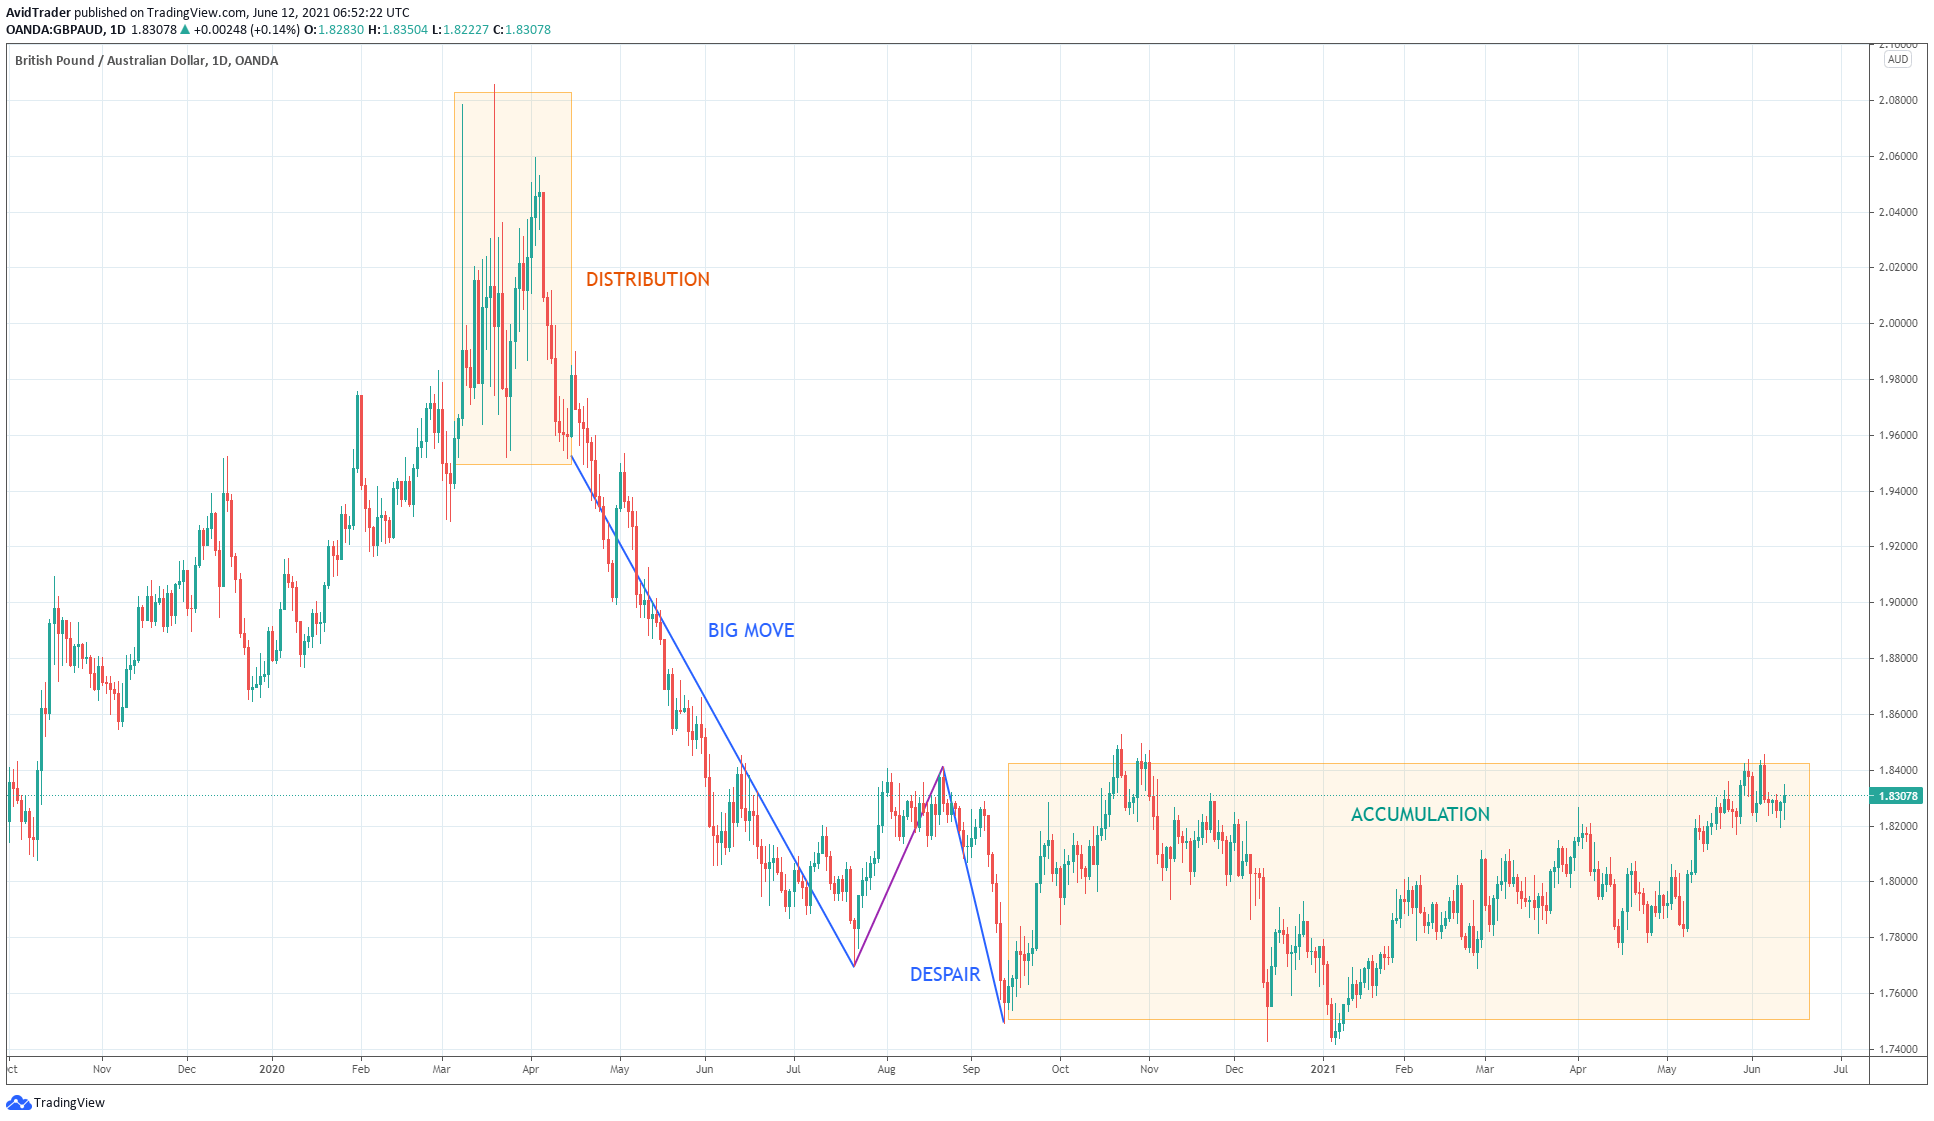
The above GBP/AUD daily chart shows a transition from a bear market to a bull market. The first shaded box is the end of the previous bull market and marks the beginning of the ensuing bear market. This is the distribution phase. When the price broke down, the next stage transpired. You can see the big move is an extended price movement.
After making a short correction, the price made the final impulse swing to the downside, managing to create a new low. After the down move, a rally ensued, breaking the high point of the previous correction. This last downward push is the despair stage. Shortly after, the market enters the accumulation phase. Once the price breaks out of the accumulation zone to the upside, a new bull market begins.
Final thoughts
This article shows the practical use of Dow Theory. It will allow you to analyze the markets using pure price action. You do not need a technical indicator at all. With this approach, you do not lose sight of the trend. Instead, you know which stage the market is in at any given time. Then you can plan your trades ahead of time to enter when the market sentiment and overall trend are aligned.


Comments