
Technology makes the FX market more accessible to individual traders. This pushes market participants to make profits every day.
There is no limit on how much a trader can earn. There is one unique fact about trading FX. You can make money from both rising and declining price movements where the outcome depends on the price change and risks.
Making constant profit involves proper trading strategies, mindset, capital size, money and trade management, discipline, etc. This article includes two daily trading strategies. One is short-term, and another is long-term.
Let’s check how to use both for continuously making money from the forex market in 2021.
How much can you earn from 0?
It is a relative question depending on several facts, such as trading skills, money management, trade management, trading method, capital size, etc.
For example, the Chinese trader Chen Linkuy made nearly $100,000 in a few weeks by depositing $100. Indeed, he didn’t follow the money and trade management rules and must involve misuse of leverage by following highly-risky strategies.
You can find so many stories of traders on the internet that they make $1000 to $10,000.
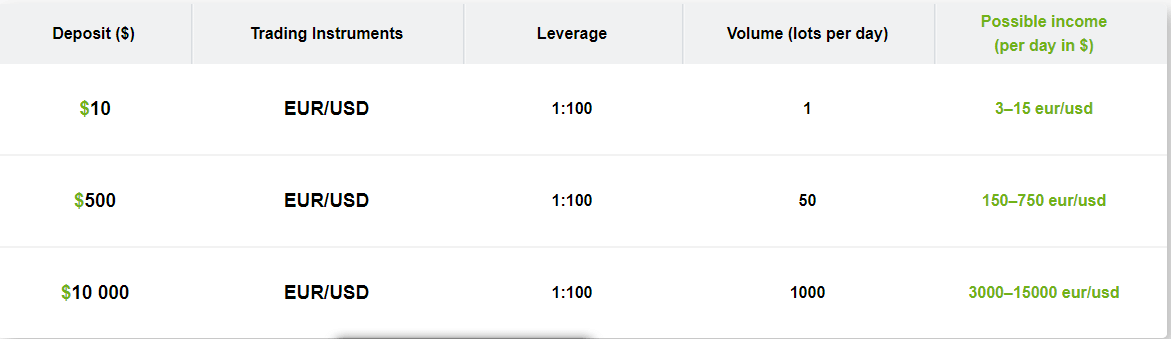
Possible income chart
Traders usually calculate profits by percentages rather than specific dollar amounts. For example, daily 1% profit may be a tiny amount for individual traders. Meanwhile, for traders of the leading banks or financial institutes who control massive deposits, 1% daily profit is enormous.
The use of leverage increases the risk on the capital. The ideal amount traders take 1-2% trading capital risk when making trading positions. The possibility of income from the FX market in 2021 is unlimited.
A short-term strategy
It involves frequent trading in the financial market. We use two popular and effective technical indicators in this short-term trading strategy:
HMA is a unique moving average indicator that calculates differently than SMA by reducing lags. Meanwhile, the RSI is one of the most popular and familiar technical indicators for currency, stock, and commodity traders.
This strategy works fine in a 1-hour chart. The HMA indicator slope generates trade ideas; we use HMA (21) in our method, and confirmation comes from the RSI indicator.
Bullish trade setup
When the HMA line is heading upside at the chart, it indicates buyer domination in the asset price. Check price candles appear above the HMA line. It’s the condition where you can place a buy order.
For confirmation, check the RSI indicator window. Confirm that the RSI signal line is above the middle line of that window and heading toward the upside.
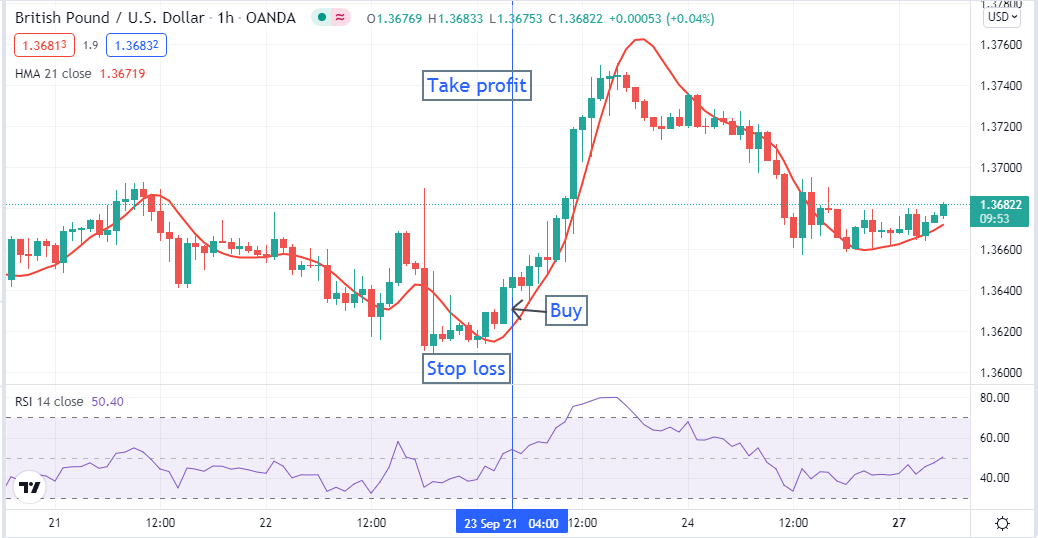
Bullish setup
When all these conditions meet your target asset price, wait until the current bullish candle closes and place a buy order. Put an initial stop loss below the recent swing low with a buffer of 5-10pips. Close the buy position when the price candle crosses below the HMA line. The RSI signal line starts to move toward the middle line from the upper line. It is confirmation that bullish pressure is ending for the asset price.
Bearish trade setup
When you are seeking to sell an asset go to the 1-hour chart. Check the RSI window that the RSI signal line crosses below the middle line and heads toward the lower line.
When the HMA line is heading toward the downside, it indicates a declining asset price. When all these conditions meet, wait until the current candle closes below the HMA line and place a sell order.
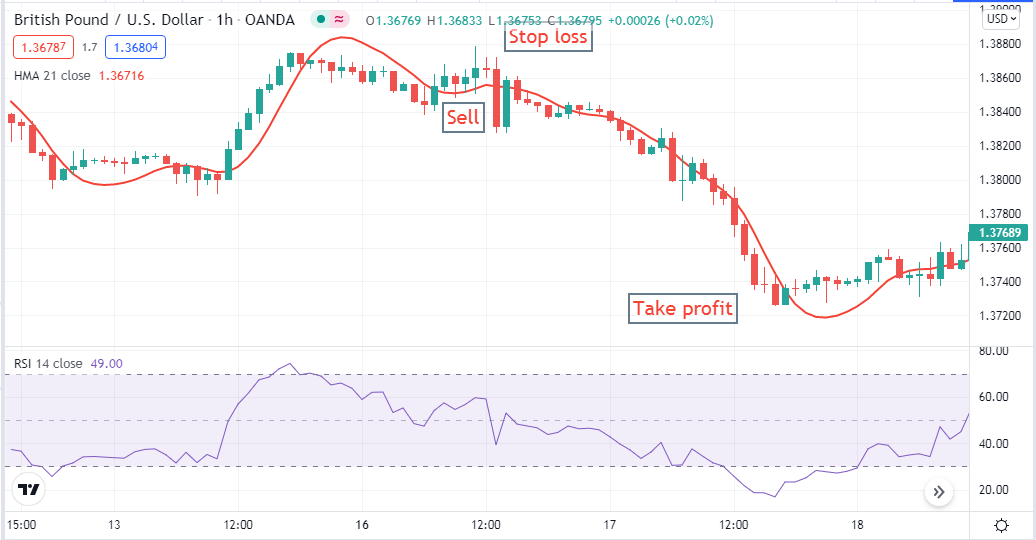
Bearish setup
Stop loss will be above the recent swing high with a 5-10pips buffer. Continue the sell order till the price remains at the declining phase. Close the sell order when candles cross above the HMA line, and the RSI signal line changes its direction, starts to move toward the upside.
A long-term strategy
This trading method will allow holding any trading positions for a few days, maybe weeks. We use moving average crossover and MACD to generate profitable trading ideas. The chart’s two moving averages are red (MA 20) and blue (MA 50) lines, when the red MA crosses above the blue MA confirms bullish pressure on the asset price.
Conversely, the red MA crosses below the blue MA indicates seller domination at the asset price. For more confirmation, check on the MACD window before making entries. This strategy generates the most exemplary trading ideas on the daily chart.
Bullish trade setup
When the red MA line crosses above the blue MA line, check the MACD window for more confirmation. MACD blue line crosses above the MACD red line and heads toward the upside, and both signal lines cross above the middle line.
Histogram bars appear above the middle line of the MACD window. These all confirm it is an ideal place to go long on the asset. Place buy order and stop loss will be below the recent low with a buffer of 10-15pips.
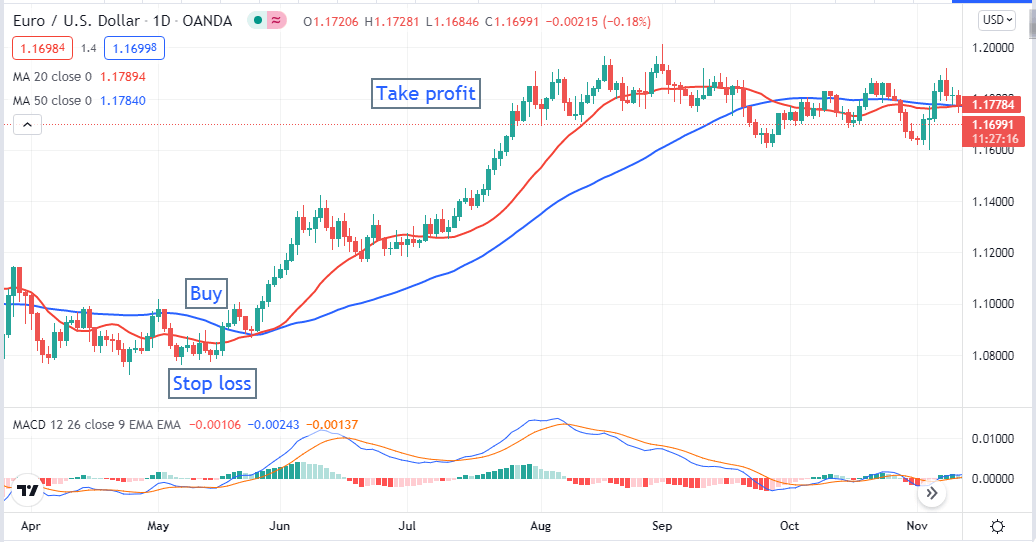
Bullish setup
Close the buy position when the red MA line crosses below the blue MA.
Bearish trade setup
Seek the bearish crossover that happens on MA lines that red MA crosses below the blue MA line. MACD blue line below the MACD red signal line, and both lines are heading toward the downside. When both signal lines of the MACD window cross below the middle line and the MACD histogram bar appears below the middle line, it indicates a potential sell position. Wait till the current candle closes and place a sell order.
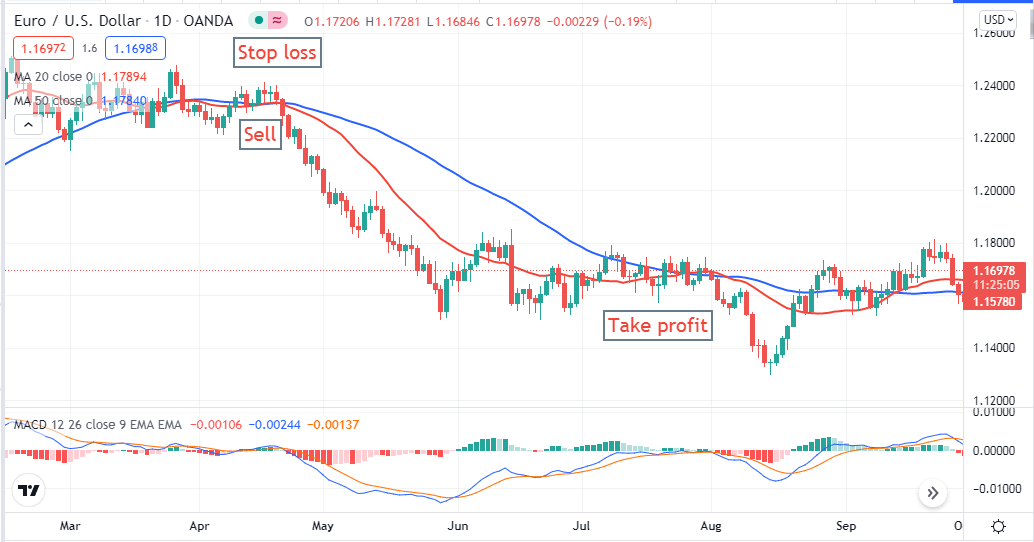
Bearish setup
Place an initial stop loss above the recent swing high and exit from the sell order when the red MA line crosses above the blue MA line.
Pros & cons
There are also some limitations besides the advantages of such trading strategies.
Pros |
Cons |
|
|
|
|
|
|
Final thoughts
Finally, you can make unlimited profits from the strategies above. The money you will make from the FX market will depend on your trading style, skills, capital management, etc. We suggest practicing any trading strategy on the demo chart before using it for real trading.


Comments