
The Arnaud Legous moving average is a unique indicator that uses different calculations than convenient moving averages (MA). It is an effective trading tool that helps traders interpret the market context by analyzing data in different ways.
However, it is worth learning the interpretation and components of this indicator before using it to catch potentially profitable trades and avoid risks on trading. This article will introduce you to the ALMA indicator besides describing successful trading methods using this tool.
What is the ALMA indicator?
It is a technical indicator that eliminates small fluctuations in price movements and determines trends using unique calculations. This indicator is a comparatively new addition in the branch of MA indicators, and the developers of this tool are Arnaud Legoux and Dimitrios Kouzis Loukas in the year 2009.
The indicator is more effective than other traditional moving averages as it eliminates the noises by applying zero-phase digital filtering and generates more reliable trading signals.
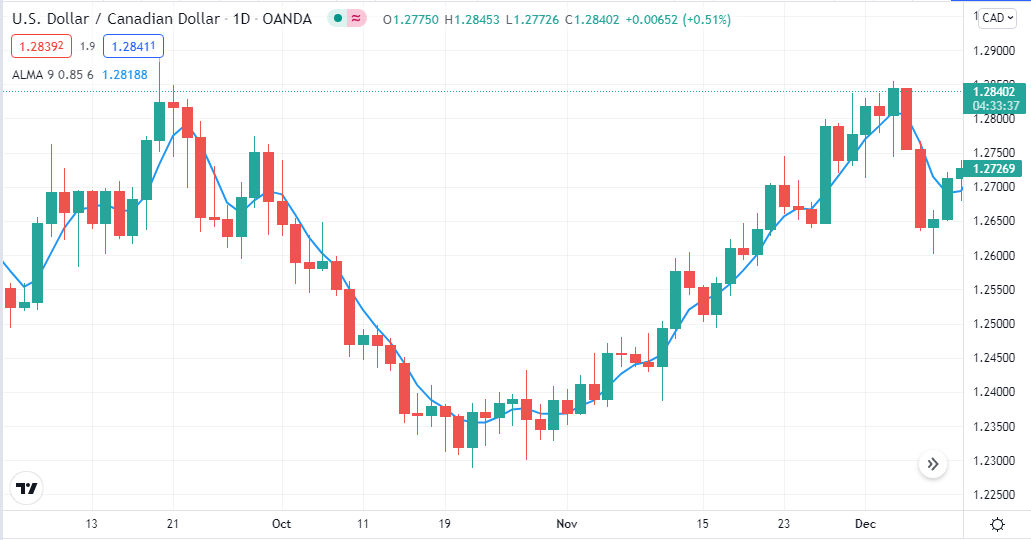
The ALMA indicator on a daily chart of USD/CAD
The EMA moves so fast and closely relates with the prices, so it often generates false signals, and the SMA moves slowly, giving late signals. The ALMA is much superior as it is free from all those issues. This indicator applies the MA twice for more effectiveness, one from the right and one from the left, and improves the result to identify trends.
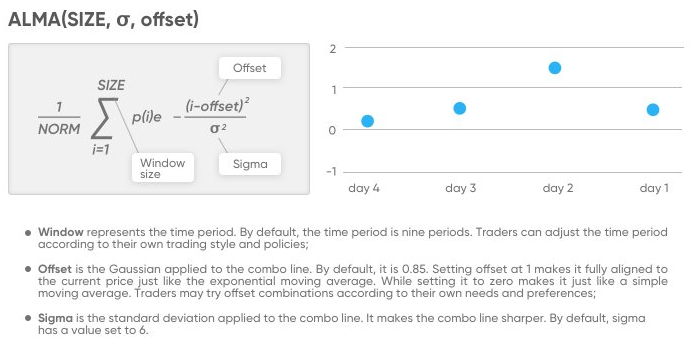
The ALMA components and formula
The indicator uses a complicated calculation to obtain market context. The fact is you don’t have to do it yourself.
| The three components of this indicator | ||
| Window | Offset | Sigma |
| The Window uses a default value of 9 periods; you can change it according to your trading method or desire. | The Offset has a default value of 0.85. When this value is 1, it will act like the EMA, and if you set the offset value to zero, it will serve like the SMA. | The Sigma has a default value of 6, which makes the combo line sharper. |
How to use ALMA in trading strategies
There are several different ways to use the ALMA indicator for successful trading. Although the calculation is complicated, the concept is simple.
- When the indicator moves on the upside and price candles break above the ALMA line, it declares sufficient bullish pressure on the asset price.
- When the price reaches below the indicator line and the indicator heads to the downside, it declares a declining pressure on the asset price.
Professional traders are always comfortable using other indicators or technical tools alongside the ALMA indicator to determine precious entry/exit points. So you can use this indicator as a standalone tool to generate trade ideas. For example, when the price exceeds the ALMA line and breaks above any support resistance line, it may be a potential place to open a buy position.
A short-term trading strategy
This short-term trading method uses the RSI indicator and the ALMA indicator with a value of 50 periods to determine trading positions. The ALMA determines the trend and the momentum indicator; the RSI window confirms the momentum is suitable or not to open any position. You can apply this method to any trading instrument; we recommend choosing assets with sufficient volatility for forex trading; the major pairs are preferable.
Time frame
For short-term trade suggestions, use a 15-min chart.
Entry
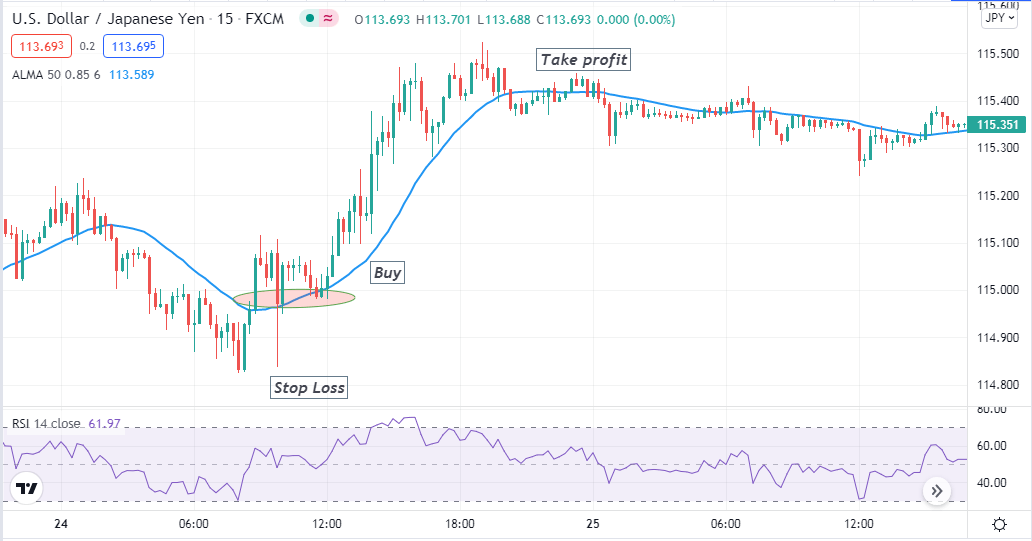
Bullish setup
Check the RSI indicator window when the price reaches above the ALMA line. RSI dynamic line is at the central (50) line or above it heads to the upside declares an upcoming buy pressure. Open a buy position here.
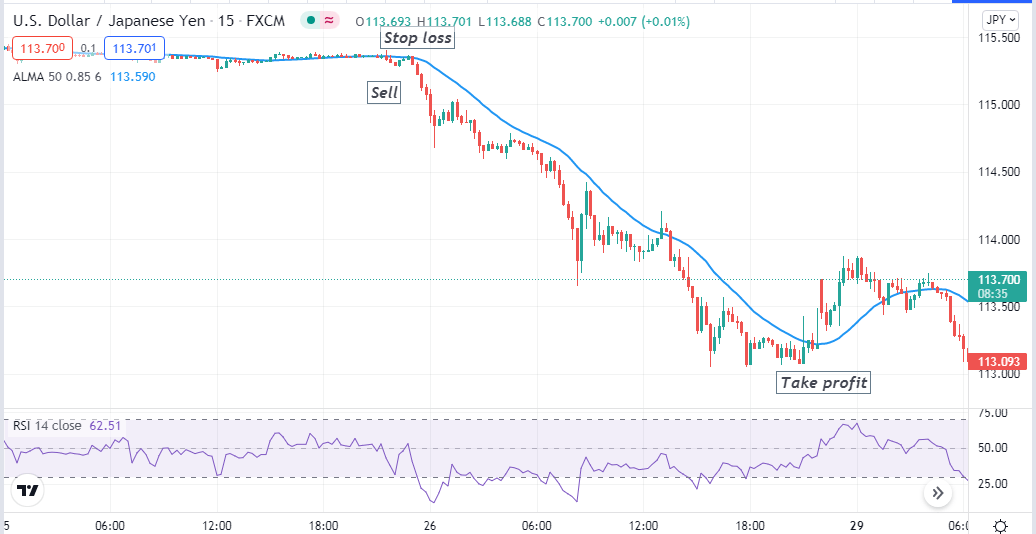
Bearish setup
On the other hand, when the price reaches below the ALMA line and the RSI line is near the central (50) line or below it heading toward the downside declares an upcoming sell pressure on the asset price. Place a sell order.
Stop loss
Use proper stop loss positions on your executing trades. For orders, place a stop loss below the current low of the bullish momentum. Meanwhile, place a stop loss above the bearish momentum when opening a sell position through this trading method.
Take profit
Continue your trades till the market context remains positive with your order type. Close the buy order when the price comes below the ALMA line and exceeds the ALMA line exit from the sell order.
A long-term trading strategy
We use a simple EMA crossover alongside the ALMA indicator in our long-term trading method. We use the ALMA value of 50 periods (blue), two EMA values of 10-days(red), and 20-days (green). Interaction between those EMA lines and combining readings with the ALMA generate trade ideas.
Time frame
The best time frame is to use a daily chart.
Entry
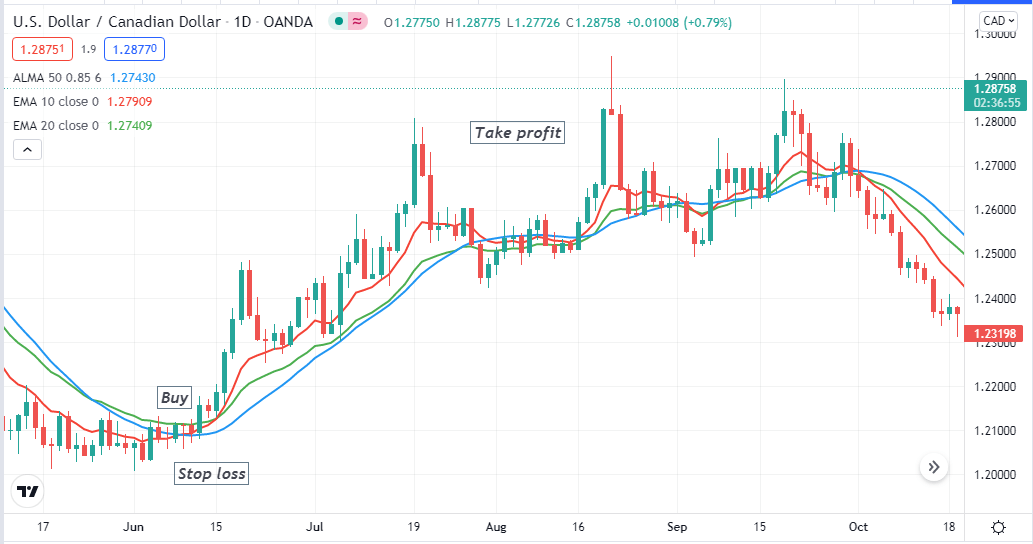
Bullish setup
When the price reaches above the ALMA line, check the EMA lines. Match the red EMA above the green EMA signals sufficient bullish pressure, then place a buy order.
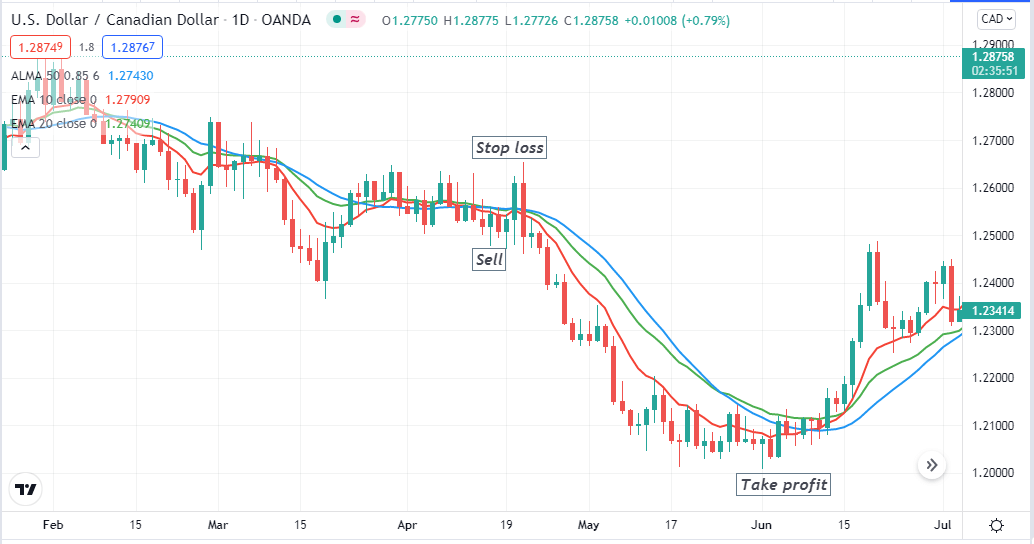
Bearish setup
On the other hand, when the exact opposite crossover occurs between those EMA lines, the red EMA crosses below the green EMA, and the price reaches below the ALMA line; this method suggests opening a sell position.
Stop loss
Place reasonable stop loss above or below the swing points. For a buy order, the stop loss level is below the current swing low, and for a sell order, place a stop loss above the recent swing high.
Take profit
Close your trades according to the market context. Close the buy order when the red EMA crosses below the green EMA. Meanwhile, when the red EMA reaches above the green EMA, it declares bullish pressure so close the sell trades.
Pros and cons
| 👍 Pros | 👎 Cons |
|
|
|
|
|
|
Final thought
The ALMA indicator may be a new addition to the group of MAs; you can consider it among the most potential trading indicators. You can also use other indicators such as Parabolic SAR, MACD, ADX, etc., to develop invincible trading strategies by combining them with the ALMA indicator. These trading strategies above are so potent that you can execute constantly profitable trades using them.


Comments