
Smart traders follow patterns like ascending or descending to execute successful trades from a reliable correction. The ascending channel is a typical formation on any financial instrument chart with higher profitability and risk tolerance.
This article will reveal the ascending channel pattern and the procedure to identify it. Later you will see successful trading strategies using this pattern with chart attachments for better understanding. However, it requires identifying the pattern correctly and learning the most potent levels to execute trades through any candlestick pattern.
What is the ascending channel pattern?
It is a candlestick formation that usually takes place during an uptrend, or in other words, this formation declares an uptrend channel.
- A sloping upward parallel line where the upper line connects the higher highs and the lower line connects the lower lows.
- The upper line represents the resistance level, and the lower line represents the support level of the price movement.
Many also call this formation “channel up” or “rising channel,” declaring an uptrend, the exact opposite appearance of the descending channel. Financial traders use this formation to determine trends, identify reversals and breakouts.
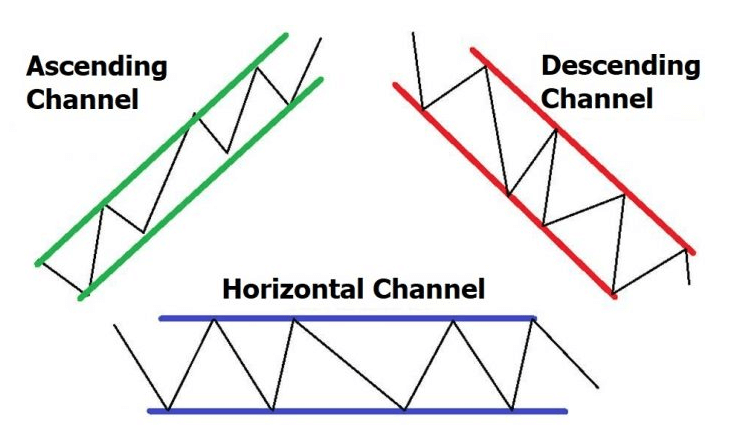
Different channel patterns
However, it is sometimes complicated to spot an ideal ascending channel pattern, although typical formation in financial instrument charts. It is a parallel upward sloping channel where price touches the upper and lower line several times. This pattern may share similarities with the rectangle pattern, but the difference is, it slopes upside.
How to trade using an ascending channel pattern
The initial part is to identify the pattern in the chart when you want to execute trades through this candlestick formation. You already know that this pattern takes place during an uptrend price movement. Financial traders often execute buy orders when the price reaches the support level and open sell positions when the price comes to the resistance level, which is aggressive type orders.
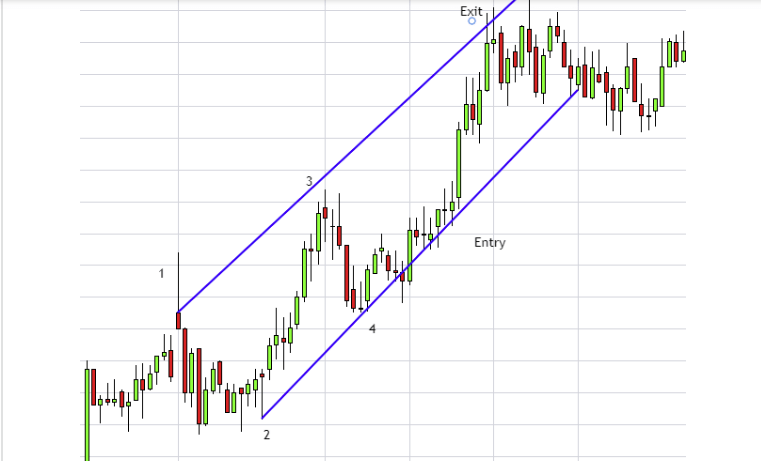
Trading concept
You can use many technical tools and indicators for more accuracy while making trade decisions. For example, you may use a MA crossover then place a buy trade while the price hits at the lower line, and the MA crossover declares bullish pressure on the asset price.
It is wise to open buy positions through this formation, declaring an overall bullish trend. While this pattern fails or the price comes below the entire formation range, it probably signals a bearish upcoming price movement.
A short-term trading strategy
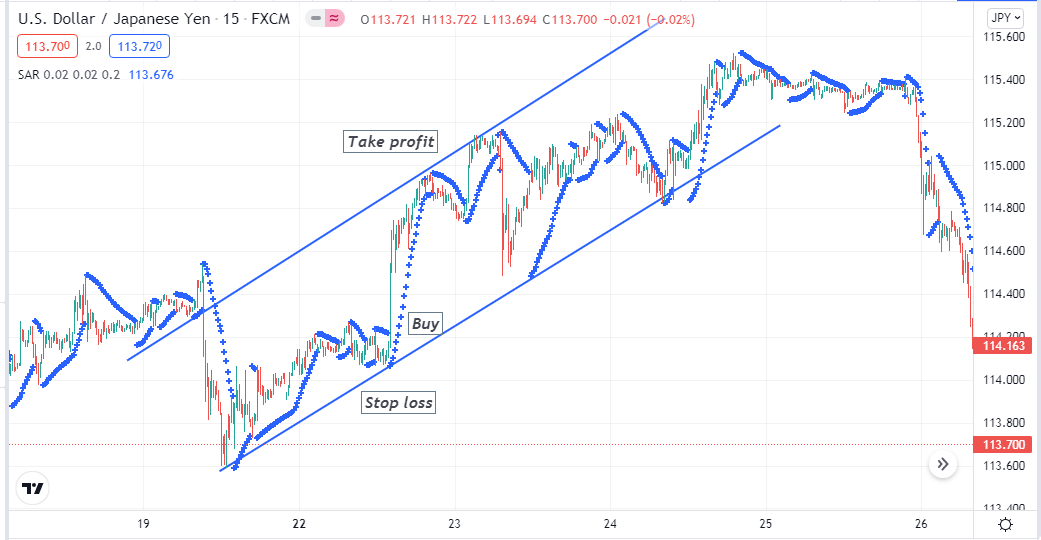
We use parabolic SAR to determine short-term entry/exit positions. It is a valuable indicator that identifies the swing points that occur by the price movements. It declares a valid swing low by creating dots below price candles and makes a series of dots till the uptrend remains intact. Meanwhile, the Parabolic dot switches positions to the upside of price candles for a valid swing high. This strategy suits any time frame; choose a 15-min chart to spot excellent short-term trading positions.
Bullish trade scenario
Mark an ascending channel pattern on your chart by drawing two trendlines above and below price candles. Wait till the price reaches the support.
Bullish setup
Entry
When price comes to the lower line and starts bouncing back to the upside, check the Parabolic SAR dot takes place below price candles. Place buy order.
Stop loss
The initial stop loss will be below the support level with a buffer of 5-10pips.
Take profit
Close the buy trade when the price reaches the resistance or upper line of the channel.
Bearish trade scenario
Mark a descending channel pattern on your chart by drawing two trend lines above and below price candles to seek sell opportunities. Wait till the price reaches the resistance.
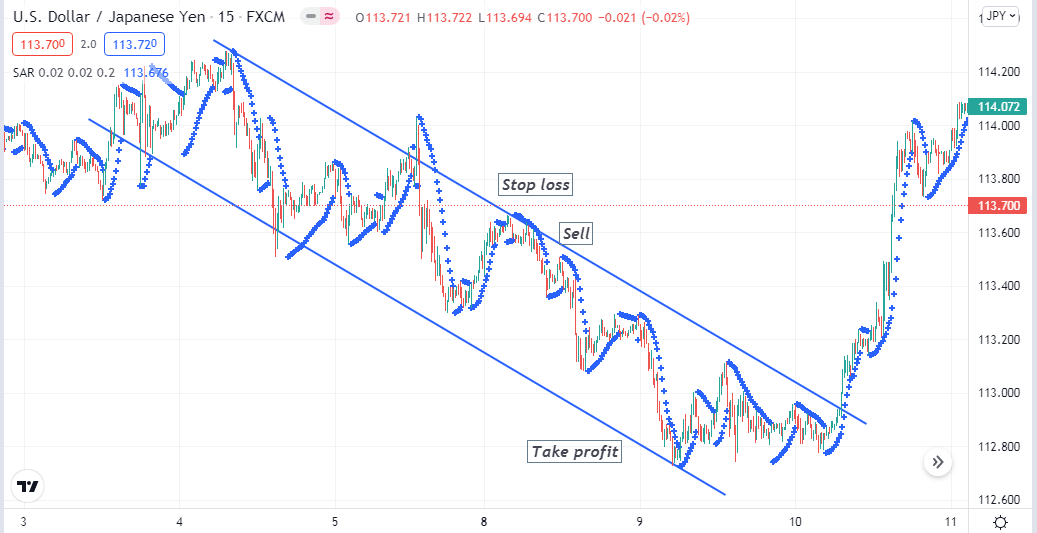
Bearish setup
Entry
When price comes to the upper line and starts declining back to the downside, check the Parabolic SAR dot takes place above price candles. Place a sell order.
Stop loss
The initial stop loss will be above the resistance level with a buffer of 5-10pips.
Take profit
Close the sell trade when the price reaches the support or lower line of the channel.
A long-term trading strategy
We use the RSI indicator alongside the pattern to seek potentially profitable trading positions in our long-term trading method. When the dynamic RSI line crosses or remains above the central line, it declares sufficient bullish pressure on the asset price. Meanwhile, the line below the central line heads on the downside when the declining pressure increases. This trading method suits any time frame chart; we recommend using at least an H4 or above chart to determine long-term trading positions.
Bullish trade scenario
Spot the ascending channel on your chart and seek to open buy positions when the price reaches the bottom line. Meanwhile, the RSI line is at the central (50) line or above it heading toward the upside.
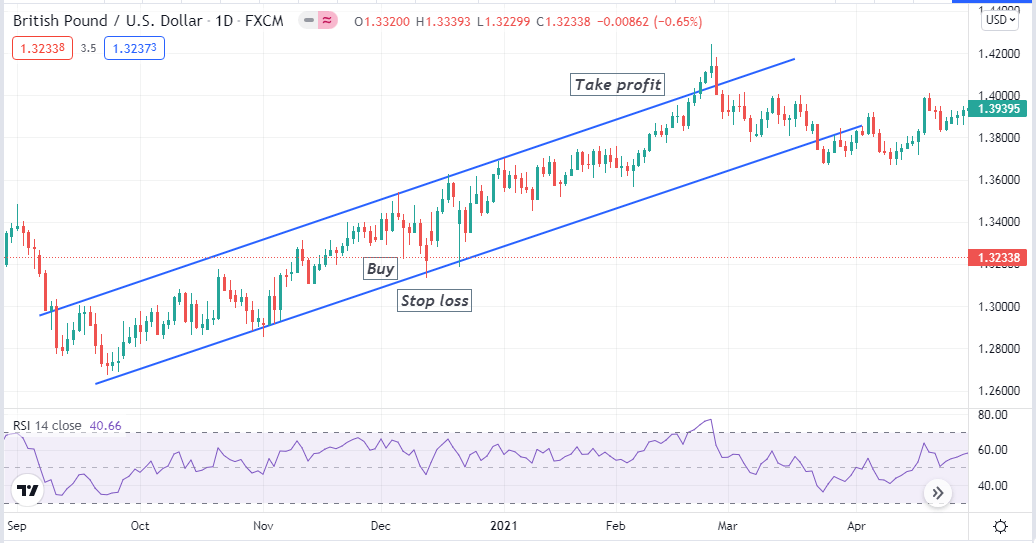
Bullish setup
Entry
When your chart matches those conditions above, place a buy order.
Stop loss
The initial stop loss level will be below the support or bottom line.
Take profit
The profit target for your buy order will be below the top trendline or resistance.
Bearish trade scenario
Spot the descending channel on your chart and seek to place sell orders when the price reaches the upper line. Meanwhile, the RSI line is at the central (50) line or below it heading toward the downside.
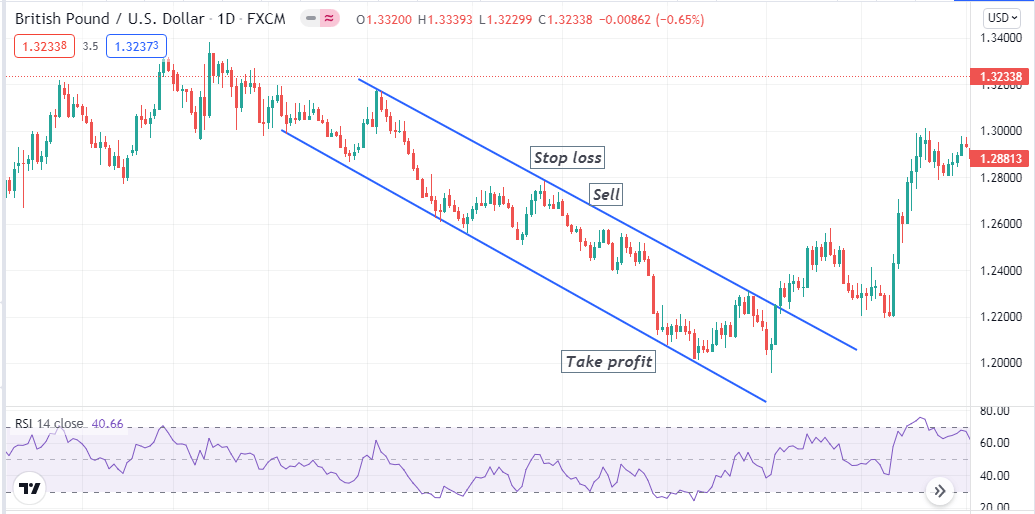
Bearish setup
Entry
When your chart matches those conditions above, place a sell order.
Stop loss
The initial stop loss level will be above the resistance or upper line.
Take profit
The profit target for your sell order will be above the bottom trendline or support.
Pros and cons
| 👍 Pros | 👎 Cons |
|
|
|
|
|
|
Final thought
Finally, this article introduces you to one of the most effective patterns in the forex market. We recommend avoiding executing trades through this pattern during major fundamental events or news releases. Moreover, use the supportive indicators wisely and double-check the readings before executing trades.


Comments