
Traders have been seeking invincible trading methods through examining the market data using various calculations. Many market participants observe the price changing of any financial asset in a particular period. So it becomes easier to predict the future direction of the target asset. The concept of moving average (MA) is an excellent technique for various financial traders.
This article is about MAs containing two long and short-term trading strategies with chart attachments that utilize this concept and describe it.
What is a simple moving average trading strategy?
It is the concept that shows the price change of financial assets in a particular period. There are diverse moving averages available that use different formulas to demonstrate the market data.
Various moving averages include Smoothed moving average, Simple moving average, Weighted moving average, Exponential moving average, Tillson moving average, and Hull moving average. This concept is to determine the ranging, corrective or trending environment for financial assets. It is a standard technical tool for investors and fund managers to evaluate a particular period’s potential reversing areas or support-resistance levels.
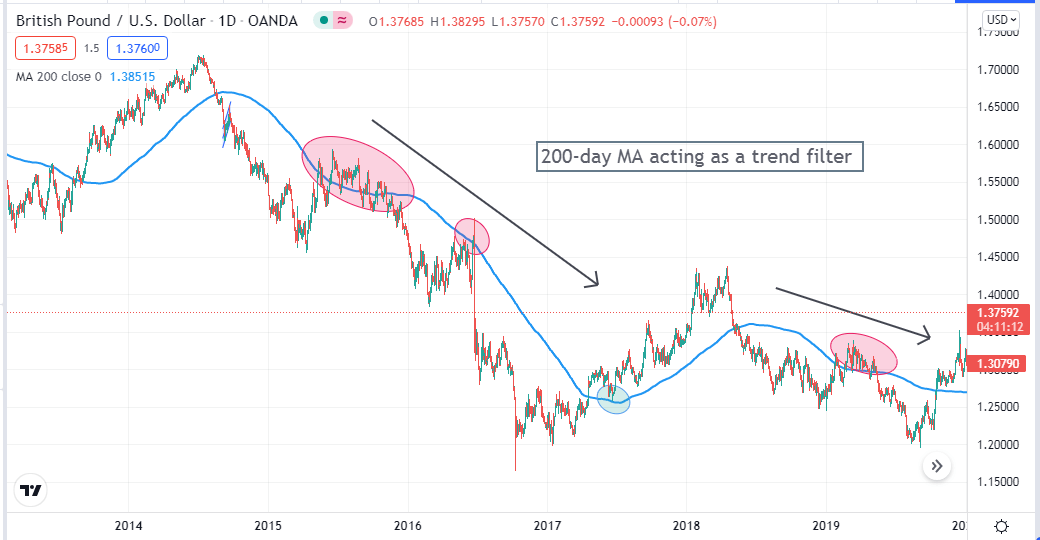
GBP/USD daily chart with 200 SMA
The figure above shows how effectively the 200 SMA acts as support and resistance on a daily chart of GBP/USD.
How to trade with moving averages?
Moving averages are a straightforward applying tool. You can use these technical tools for analyzing nearly any tradable financial asset, such as securities, stocks, indexes, commodities, forex, etc.
Professional traders often use two different periods of MA to obtain profitable trade ideas. For example, the golden crossover is familiar to any trader who knows about moving average trading techniques.
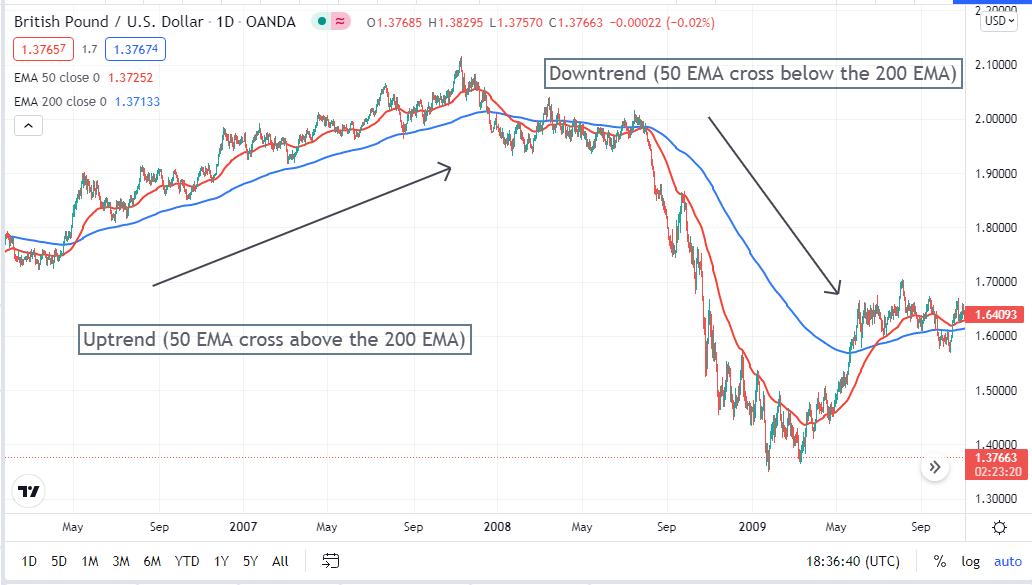
EMA crossover at GBP/USD daily chart
Golden crossover theory involves 50 and 200 moving averages. When the 50 MA crosses the 200 MA at the upside, it indicates an uptrend, and inversely, the opposite crossover between these two moving averages signals a bearish trend.
This golden crossover concept works fine on the D1 chart. You can use the moving average of any period or different MA crossover for generating trade ideas or combine moving averages values with other technical tools and indicators. It always depends on your trading skills and expectations.
A short-term strategy
This strategy shows noticeable results on any time frame chart for tradable financial assets. We recommend a 15-min chart to apply this trading method containing exponential moving averages (EMA) of three different periods.
The red line is EMA (21), the blue line is EMA (50), and the yellow line is EMA (200). Trading ideas come from the crossover between these three MA dynamic lines. You can catch potentially profitable trading positions frequently by using these three moving averages.
Bullish scenario
This strategy signals buy opportunities when:
- The red (21) EMA crosses the blue (50) EMA on the upside.
- The blue (50) EMA crosses above the yellow (200) EMA.
- Both the red and blue EMA cross the yellow EMA on the upside.
- Both the red and the blue EMA direction is upward.
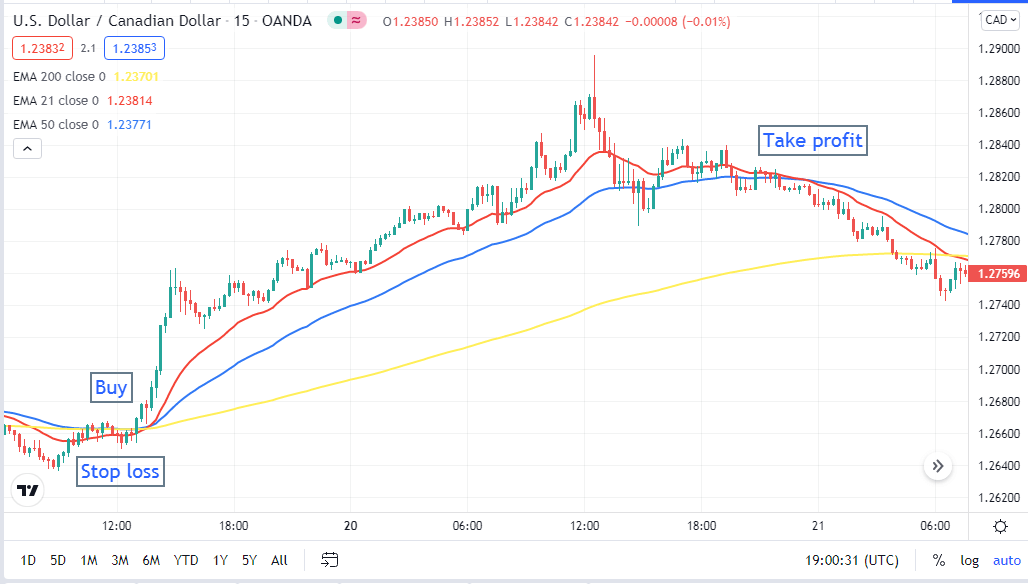
Bullish setup
Entry
Check all these crossovers above take place on your target asset. Wait till the current bullish candle closes and make a buy position.
Exit
Close your buy position when:
- The red (21) EMA crosses below the blue (50) EMA.
- The blue EMA crosses below the yellow EMA.
Stop loss
That buy order’s initial stop loss level will be below the EMA lines and recent swing low with a buffer of 5-10pips.
Bearish scenario
This strategy signals sell opportunities when:
- The red (21) EMA crosses the blue (50) EMA on the downside.
- The blue (50) EMA crosses below the yellow (200) EMA.
- Both the red and blue EMA cross the yellow EMA on the downside.
- Both the red and the blue EMA direction is downward.
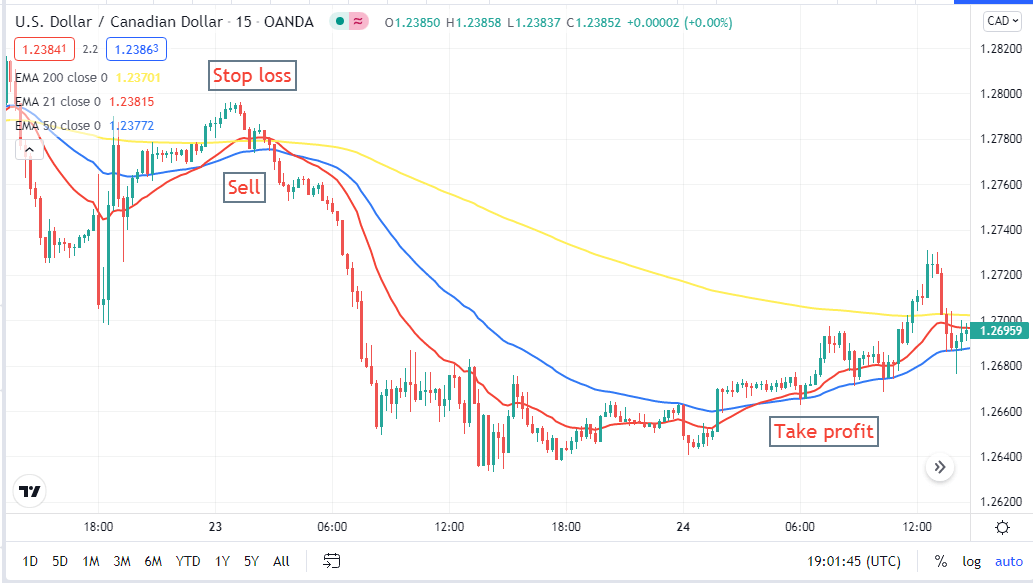
Bearish setup
Entry
Check all these crossovers above take place on your target asset. Wait till the current bearish candle closes and make a sell position.
Exit
Close your sell position when:
- The red (21) EMA crosses above the blue (50) EMA.
- The blue EMA crosses above the yellow EMA.
Stop loss
That sell order’s initial stop loss level will be above the EMA lines and recent swing high with a buffer of 5-10pips.
A long-term strategy
In our long-term strategy, we use two Hull moving averages, another leading technical indicator, moving average convergence/divergence (MACD). Hull moving average is a comparatively new concept that eliminates lags by using different calculations. Moreover, it is more smooth and faster than other moving averages.
We use HMA 21 (red) and HMA 51 (blue) crossover to generate trade ideas. Meanwhile, the MACD indicator window has two dynamic signal lines and different color histogram bars at both sides of the middle (0.0) line. The recommended time frame of this strategy is D1.
Bullish scenario
This strategy suggests buy orders when:
- The red (21) HMA crosses the blue (50) HMA on the upside.
- Geen histogram bars show up above the middle (0.0) line of the MACD window.
- The dynamic blue line crosses the dynamic red line on the upside of the MACD window.
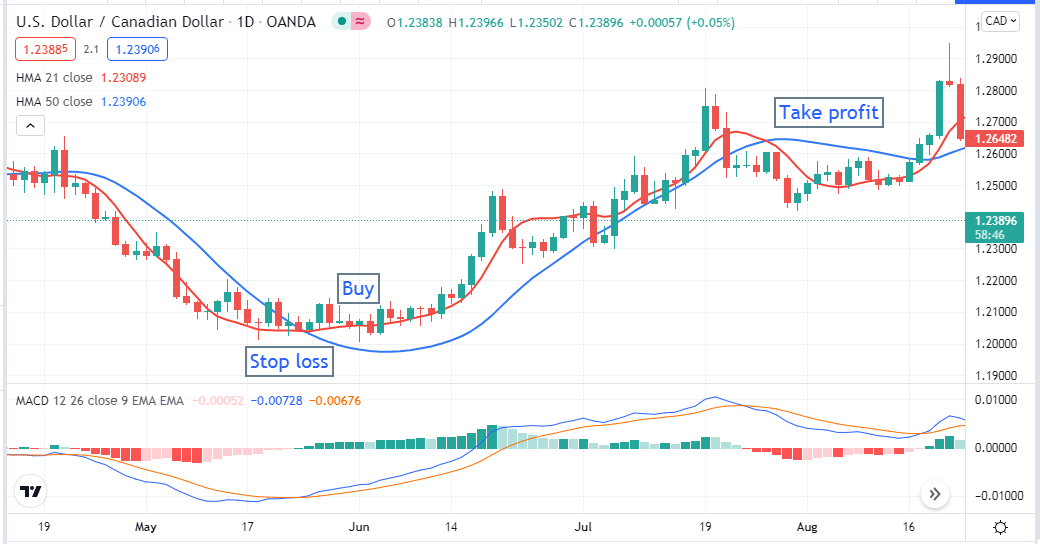
Bullish setup
Entry
When the chart matches all these conditions above, place a buy order after closing the current bullish candle.
Stop loss
The initial stop loss level will be with a buffer of 10-15pips below the current swing low.
Take profit
Close the buy position when:
- The red HMA crosses below the blue HMA.
- Red histogram bars show up below the middle (0.0) line of the MACD window.
- The blue line crosses the red line on the downside at the MACD window.
Bearish scenario
This strategy suggests selling orders when:
- The red (21) HMA crosses the blue (50) HMA on the downside.
- Red histogram bars show up below the middle (0.0) line of the MACD window.
- The dynamic blue line crosses the dynamic red line on the downside of the MACD window.
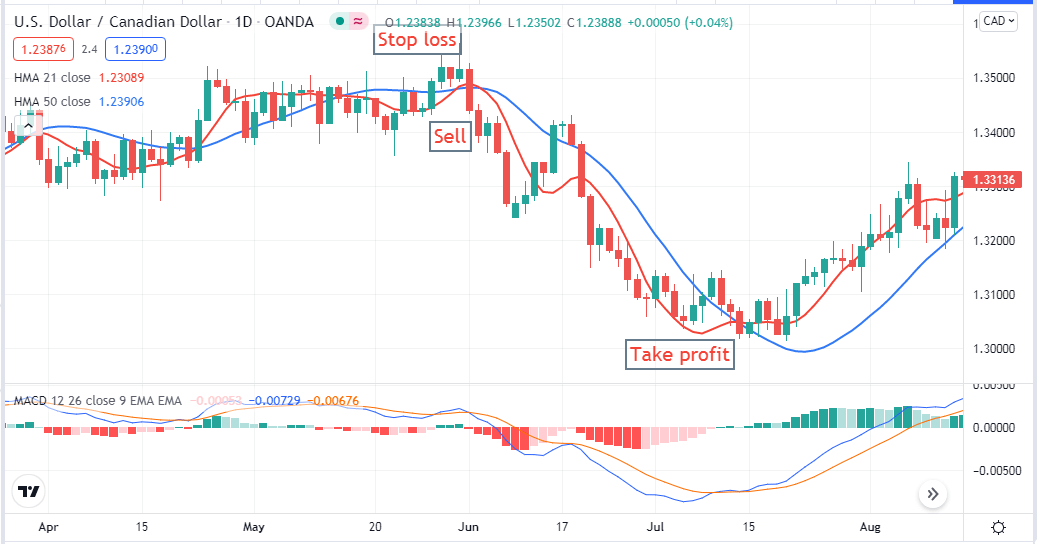
Bearish setup
Entry
When the chart matches all these conditions above, place a sell order after closing the current bearish candle.
Stop loss
The initial stop loss level will be with a buffer of 10-15pips above the current swing high.
Take profit
Close the sell position when:
- The red HMA crosses above the blue HMA.
- Green histogram bars show up above the middle (0.0) line of the MACD window.
- The blue line crosses the red line on the upside at the MACD window.
Pros and cons
| Pros | Cons |
|
|
|
|
|
|
Final thought
Finally, these are the essential pieces of info about the concept of the moving average. We try to make this article sufficiently informative and understandable for any traders, including newcomers.


Comments