
ABC correction pattern is terminology for three waves counter-trend price movement. The first price wave opposite to the whole market’s trend is depicted as wave A and, B is the corrective wave. The final price move for completing the counter-trend price movement has been shown by wave C.
The Elliott wave is a theory for technical analysis which is utilized to explain the price movements of the financial markets. The ABC correction pattern is part of Elliott’s wave theory. The following section includes the complete guide on the ABC correction method, including an exact way to buy and sell a trading instrument.
What is ABC correction?
It is hard to define the corrective wave pattern before completing the patterns. ABC correction waves move the trend contrariwise more competently. Compared to the impulse waves, corrective waves have more diversity, which is indecisive about identifying.
Corrective waves consist of five types — zig zag, flat, triangle, doubletree, and, triple tree. While any two waves form zig zag, flat and triangle combine, it makes a double three-wave, and when all the three waves combine, it becomes the pattern of the triple tree.
How to use the ABC correction in trading strategy?
Let’ see the use of ABC correction with these patterns.
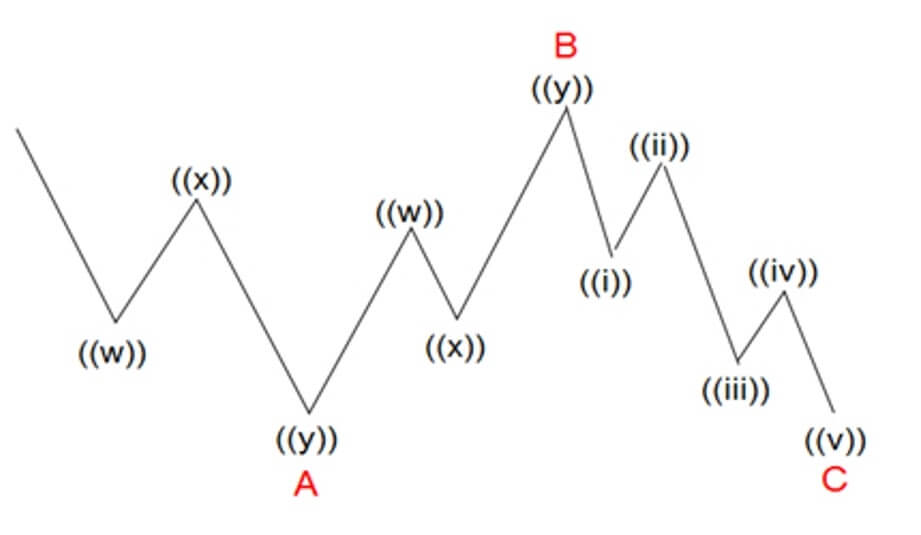
Zig zag
It is a three-wave formation of corrective waves, marked as ABC. This 5-3-5 formation belongs to waves A and C, which can be an impulse or diagonal, whereas wave B can be any corrective formation. Once in a while, zig zags take place in doubles or sequentially a maximum of three times.
It happens especially if the first zig zag falls short of the general target; in that case, all zig zags are divided by a conciliate ‘three’ marked as X and generates a double zig zag marked as W and Y.
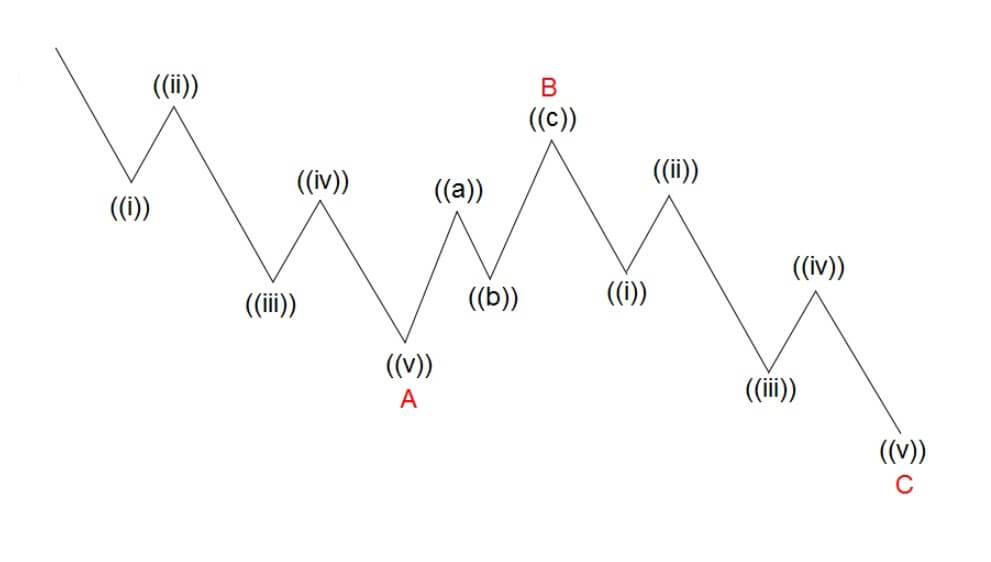
Zig zag pattern
Flat
The flat correction is a three-wave also marked as ABC, same as the zig zag. Though it is marked as ABC, yet in the subdivision or group of wave A, it is different from the Zig Zag. The flat is a 3-3-5 formation. On the contrary, the formation of the zig zag is a 5-3-5.
Flat pattern
Triangle
Triangles form by overlapping five waves of affairs, which are divided as 3-3-3-3-3. They seem to mirror an equilibrium of forces, causing a sideways development typically connected with losing volume and volatility.
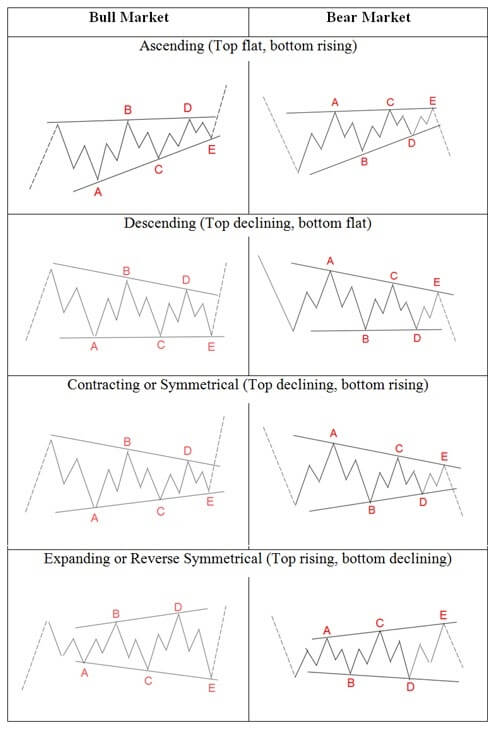
Triangle pattern
Double threes and Triple threes pattern
The Double threes pattern and the pattern of the Triple three are referred to as sideways combinations of corrective patterns. When any two patterns from the zig zag, flat, and triangle combine, it forms a Double threes pattern while the pattern of the Triple three includes all three.
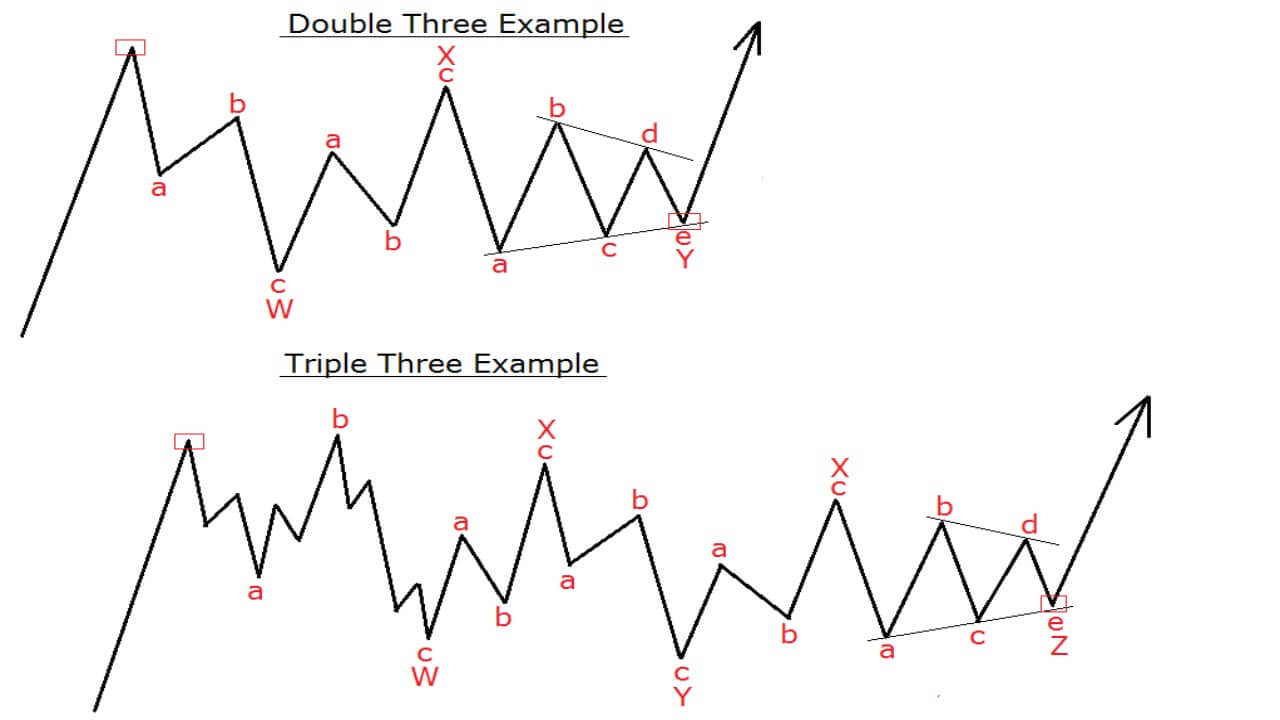
Pattern examples
A short-term trading strategy
ABC pattern trading is a highly accurate trading method that many professional traders have used. It is so easy to utilize that you can identify this pattern on a naked chart without indicators.
Bullish trade scenario
However, you can add indicators like MA or MACD to identify the entry and exit points. In this short trading strategy, we are going to use 50 EMA to identify the market momentum, entries, and exit points.
Best time frames to use
This short-term trading strategy works on all time frames. You can use M5, M15, and H1 time frames for this short-term trading strategy.
Entry
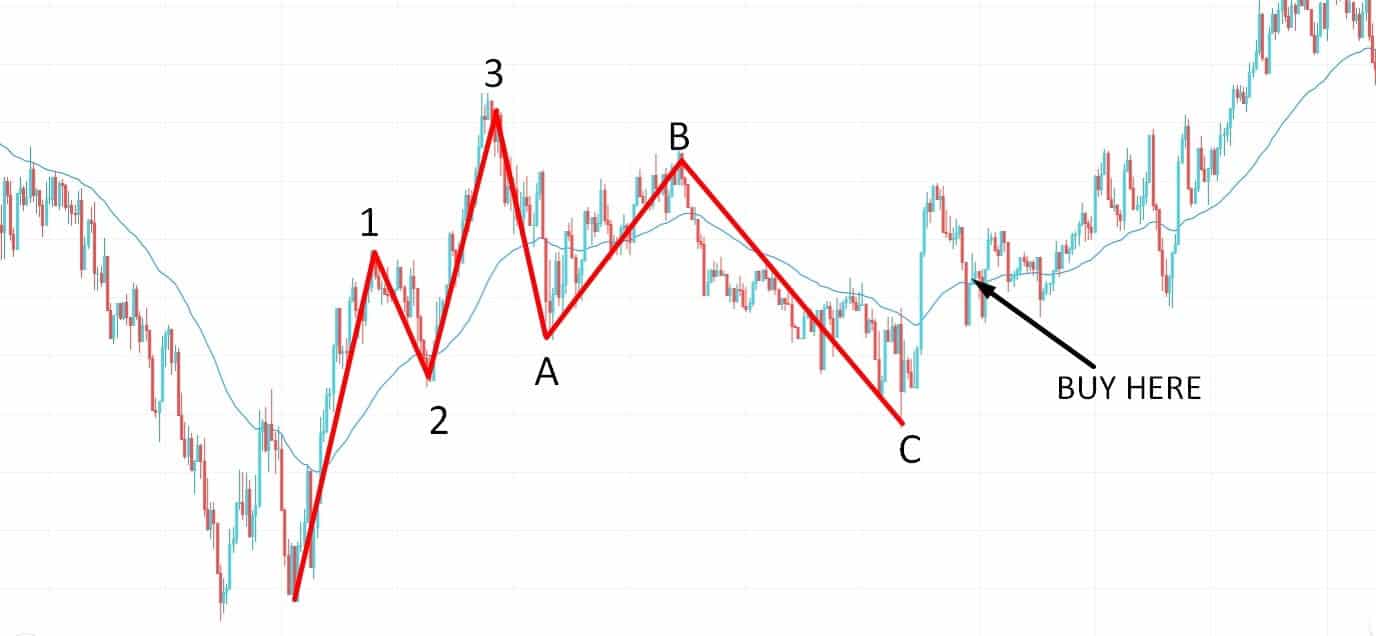
Bullish setup
After forming the C wave pattern, look for the price to break over the 50 EMA. Enter a buy trade when the price retest the 50 EMA after a bullish breakout.
Stop loss
Place the stop loss order below the C wave with a 5-10 pips buffer.
Take profit
Take the profit by calculating a 1:3 risk/reward ratio. Otherwise, you can take the profit when the price breaks below the 50 EMA.
Bearish trade scenario
Entry
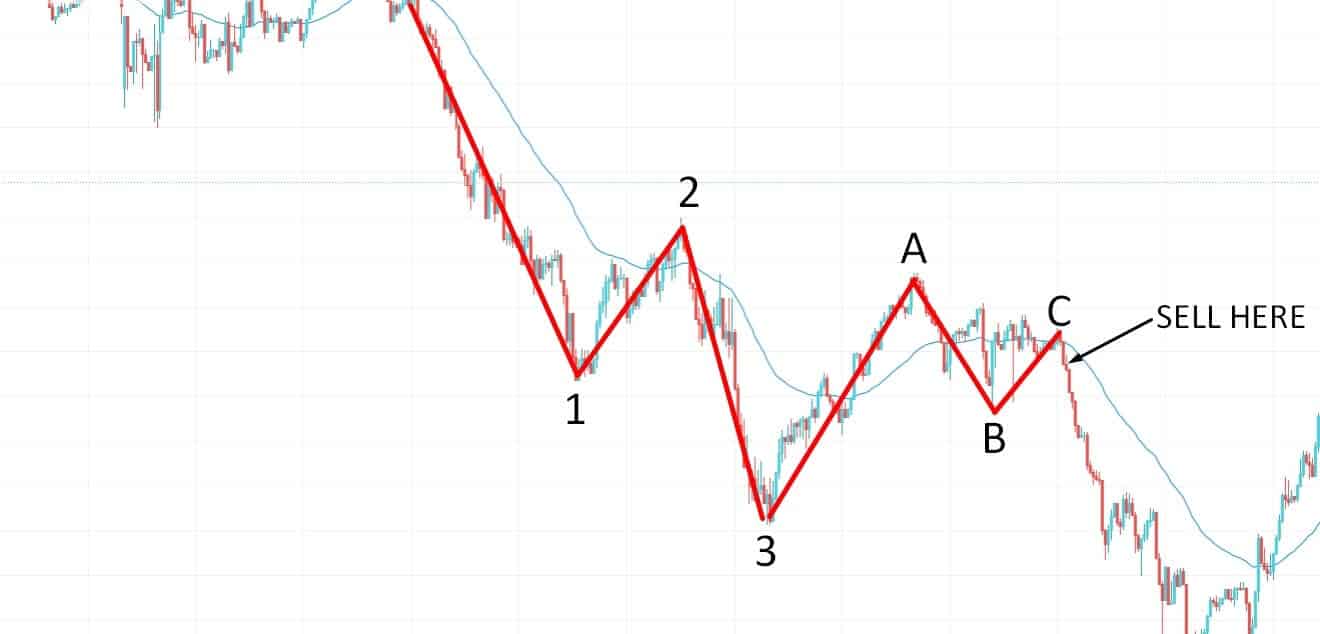
Bearish setup
Look for the price to break below the 50 EMA after forming the C wave pattern. Enter a sell trade, when the price retest the 50 EMA after a bearish breakout.
Stop loss
Place the stop-loss order above the C wave with a 5-10 pips buffer.
Take profit
Take the profit by calculating a 1:3 risk/reward ratio. Otherwise, you can take the profit when the price breaks above the 50 EMA.
A long-term trading strategy
Long-term trading strategy using the ABC correction pattern is the most profitable trading method, which can provide a good amount of pips in the long run.
Bullish trade scenario
In this trading strategy, we are going to use the MACD indicator along with the 50 EMA.
Best time frame to use
This long-term trading system works best on higher time frames. You can use H4, D1, and W1 time frames for this long-term trading strategy.
Entry
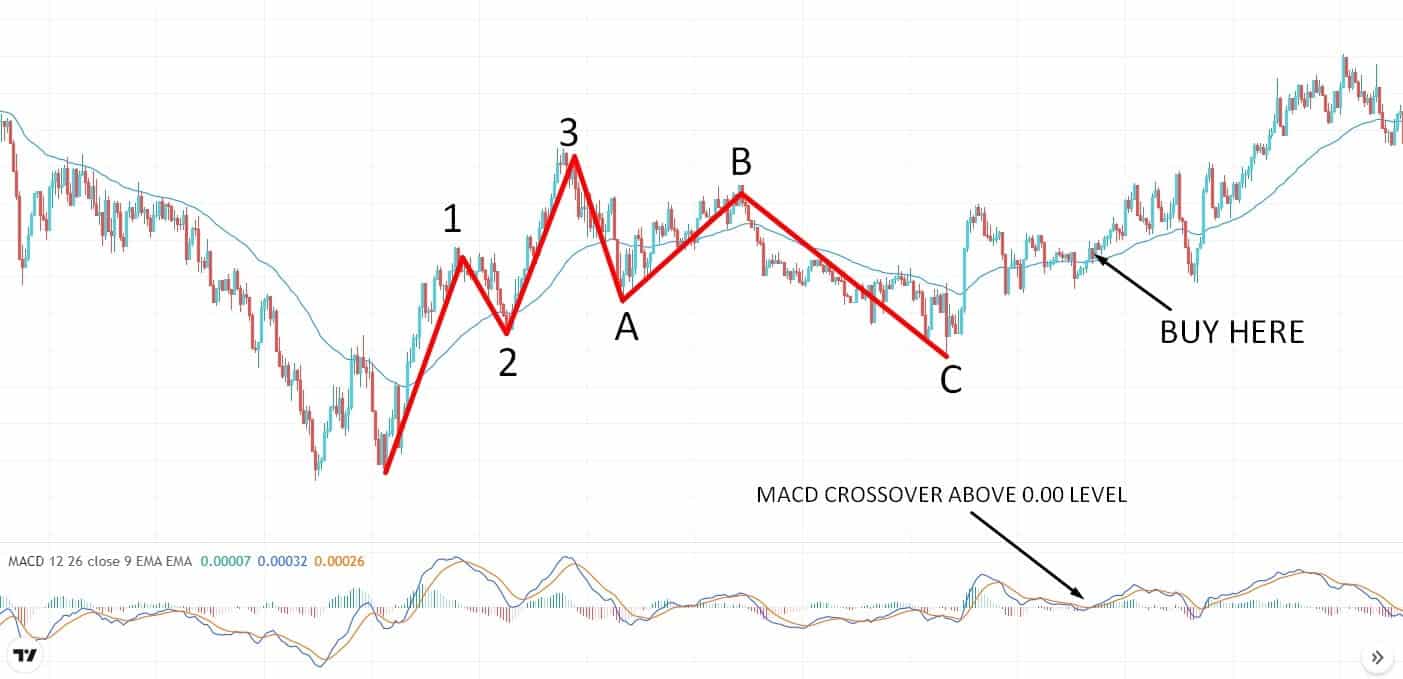
Bullish setup
Look for the price to break over the 50 EMA after forming the C wave pattern and the MACD blue line crosses the red line above 0.00 level. Enter a buy trade, when the price had a bullish close after retesting the 50 EMA.
Stop loss
Place the stop loss order below the C wave with a 10-15 pips buffer.
Take profit
Take the profit by calculating a 1:3 risk/reward ratio. Otherwise, you can take the profit when the price breaks below the 50 EMA.
Bearish trade scenario
Entry
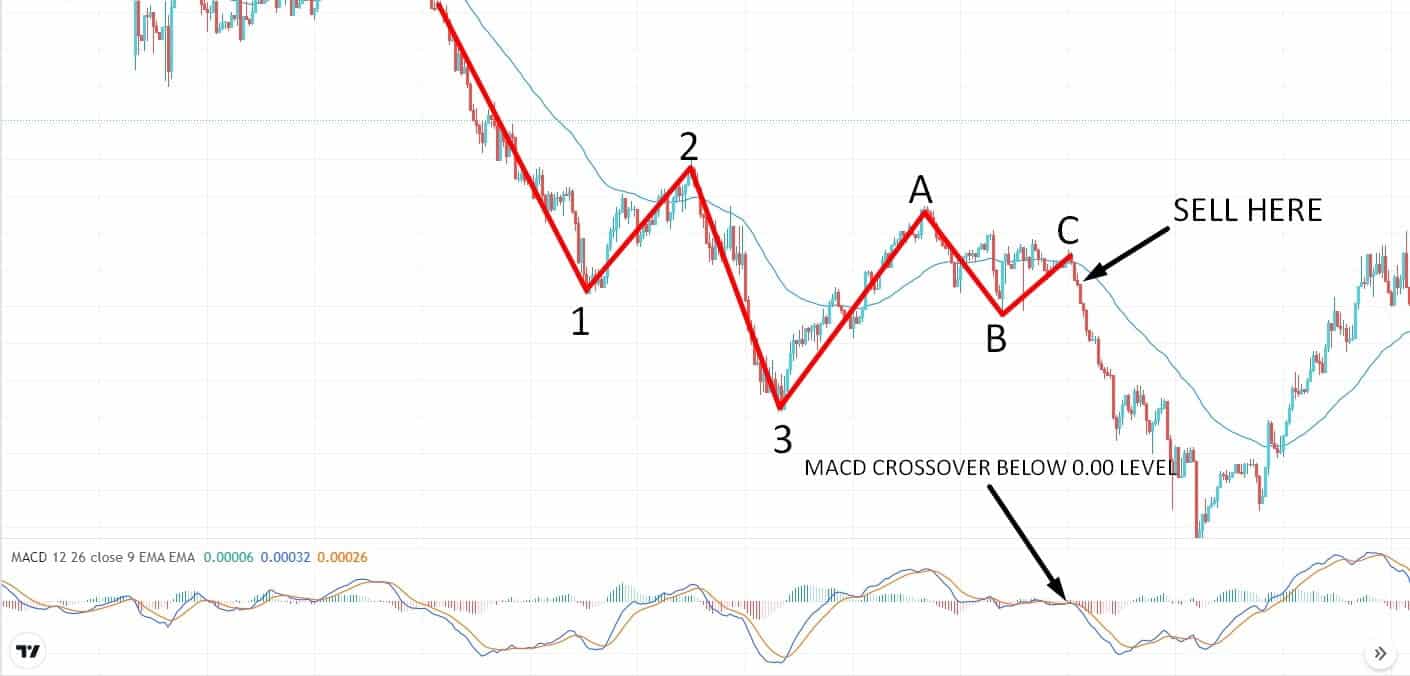
Bearish setup
Look for the price to break below the 50 EMA after forming the C wave pattern and the MACD blue line crosses the red line below 0.00 level. Enter a sell trade, when the price had a bearish close after retesting the 50 EMA.
Stop loss
Place the stop-loss order above the C wave with a 10-15 pips buffer.
Take profit
Take the profit by calculating a 1:3 risk/reward ratio. Otherwise, you can take the profit when the price breaks above the 50 EMA.
Pros and cons
| 👍 Pros | 👎 Cons |
|
|
|
|
|
|
Final thoughts
Corrective wave pattern goes in the opposite of the trend direction. In a nutshell, the ABC correction pattern is a vital element of the Elliott wave theory. As per the theory, corrective waves take place throughout every timeframe, and they can be utilized to understand the asset’s price trends.
Therefore, gathering the knowledge of corrective waves at a few degrees of the trend will help the technical analyst to distinguish the price movements that are taking place in the opposite direction of the trend.


Comments