
The Zig Zag indicator is a basic but multipurpose tool that traders use to determine high and low points of the market in a smooth but competent way. It defines the trend reversal of an asset price. As designated, it depicts the swing high and low in price.
Since the market prices fluctuate continuously, the indicator disregards these fluctuations and emphasizes connecting high and low points on the chart. Even the Zig Zag indicator is favorable for defining significant price changes by identifying the support and resistance areas. This is the method of removing the daily market condition’s noise.
What is The Zig Zag indicator?
The indicator is renowned among traders. It still only depicts previously occurred significant price shifts. It does not anticipate the upcoming price or price behavior because it enables traders to trace significant market changes avoiding the distraction of trivial fluctuation.
However, a price movement percentage needs to be set for using the Zig Zag indicator. Though the default Zig Zag value is 5%, setting the value at 9% is better. The 9% value setting will make sure to remove the small price swing by showing a price fluctuation of only 9% or more on the chart.
Generally, the area where price reverses by the fixed percentage closing prices of an asset typically used and the pretending points are also placed on the chart. And, those lines are linked through the straight lines then the data needed emerges.
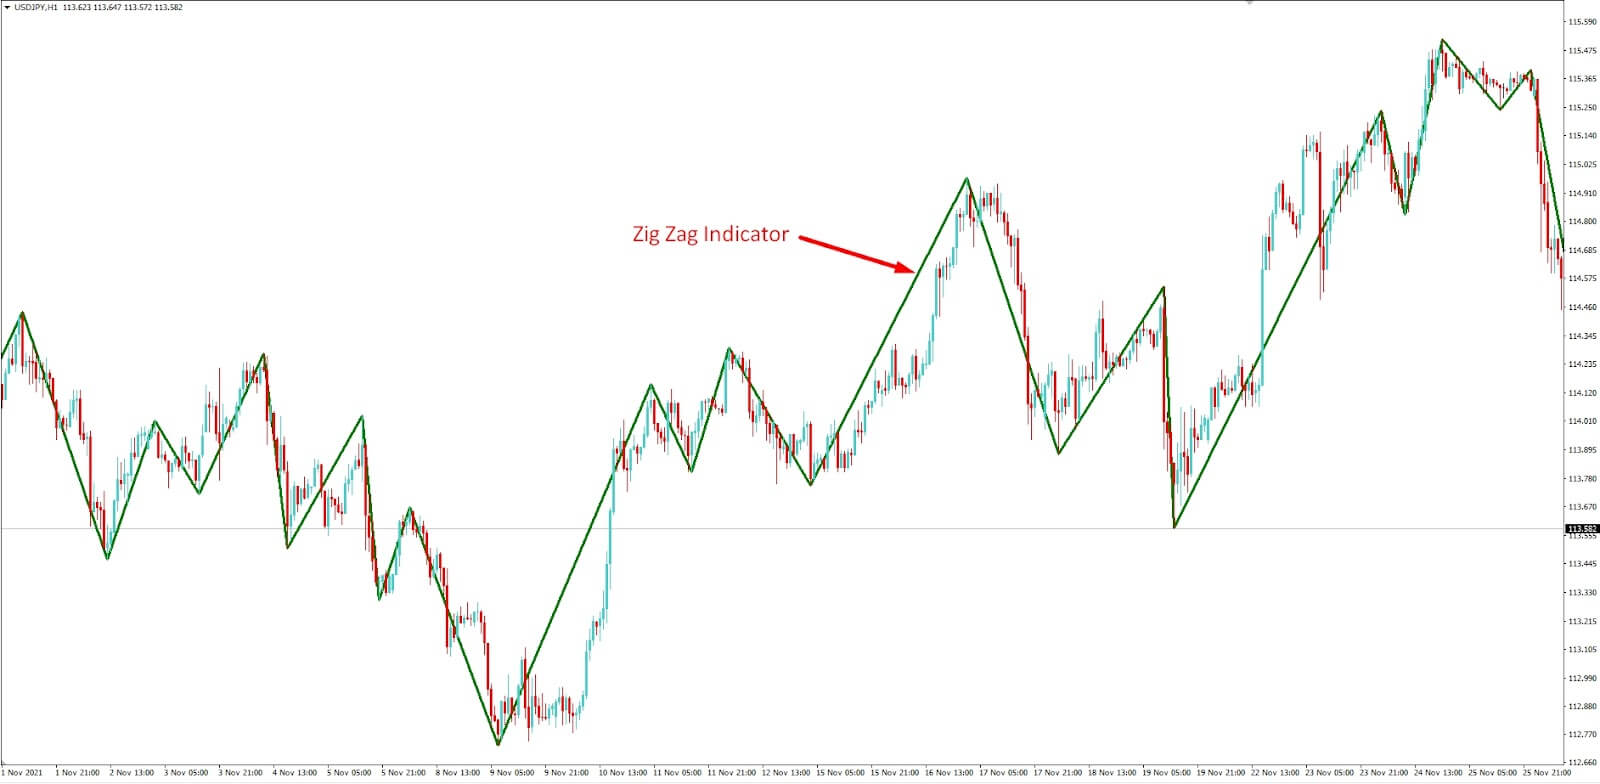
Zig Zag indicator on chart
How to use the Zig Zag indicator?
Compared to other indicators, the uses of the Zig Zag indicator are efficient and straightforward, as mentioned previously. It makes sure that the trader can use it in different manners. The indicator aids in quickly defining the chart patterns so that traders can see the bigger picture of the significant market trends.
Combining the Zig Zag indicator with the Elliot waves counter as a confirmation tool is possible. However, it can only depict the previous data, not the upcoming swing highs and lows. Since it is not an automatic indicator, you‘re required to draw the line for visualizing the current trends manually.
Short-term trading strategy
As the Zig Zag indicator identifies the market trend and the shorter swings, it’s easy to understand the next probable move. This short-term trading technique best works on the 15-minute rather than the 5-minute chart. Furthermore, to increase our accuracy on trading, we will add the MACD indicator to the chart. MACD will help us find the entry points and the trend’s momentum.
Bullish trade scenario
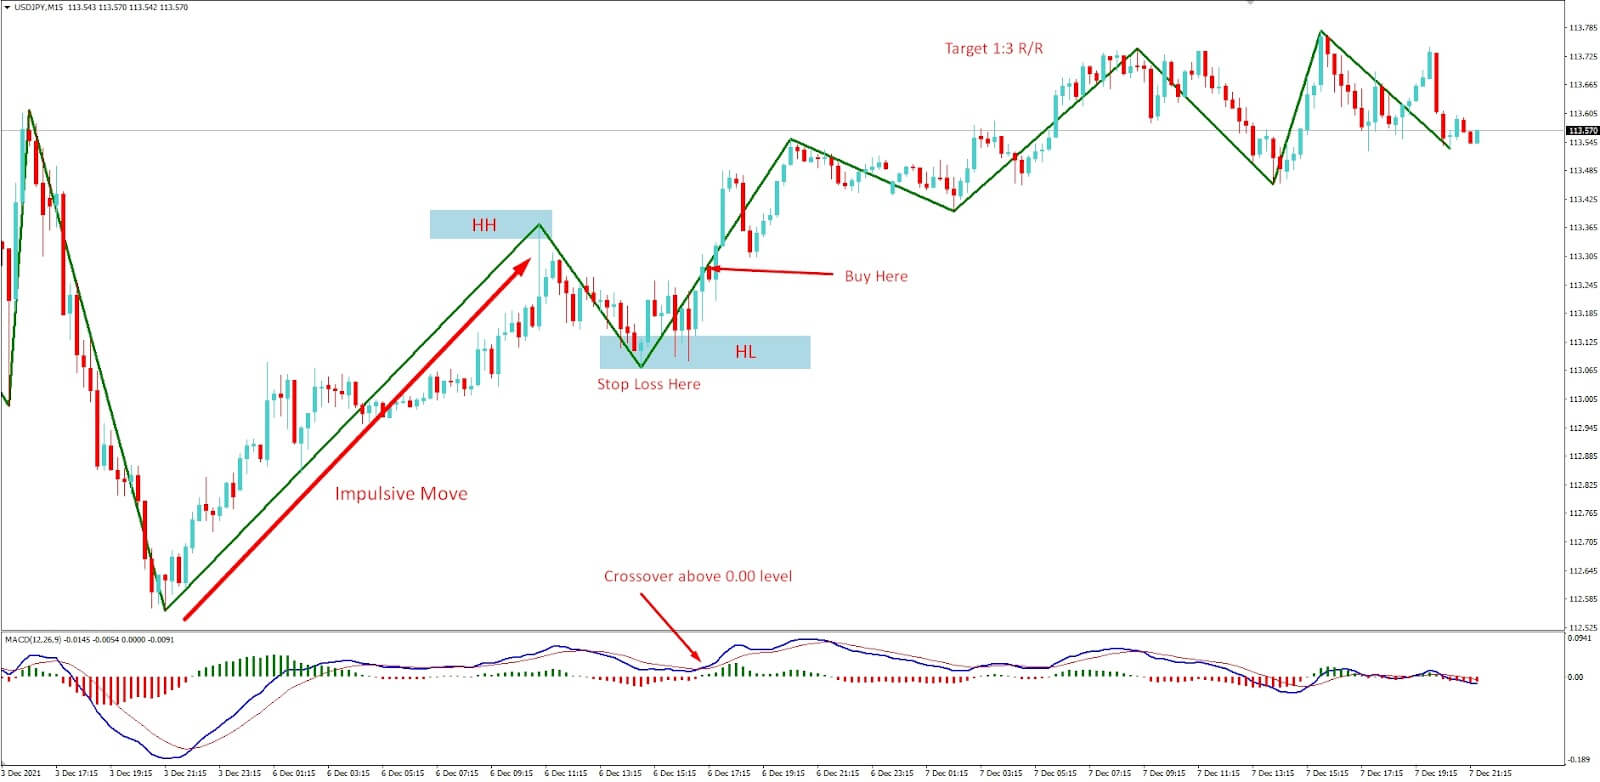
Bullish setup
Entry
Look for a buy entry when the price makes a high low after an impulsive bullish move. Besides, the MACD blue line crosses the red line from downside to the upside above 0.00 level.
Stop-loss
SL order should be placed below the swing level/higher low with 4-5 pips buffers.
Take profit
Place your take profit order on the next resistance level. Otherwise, you can target at least a 1:3 risk/reward ratio.
Bearish trade scenario
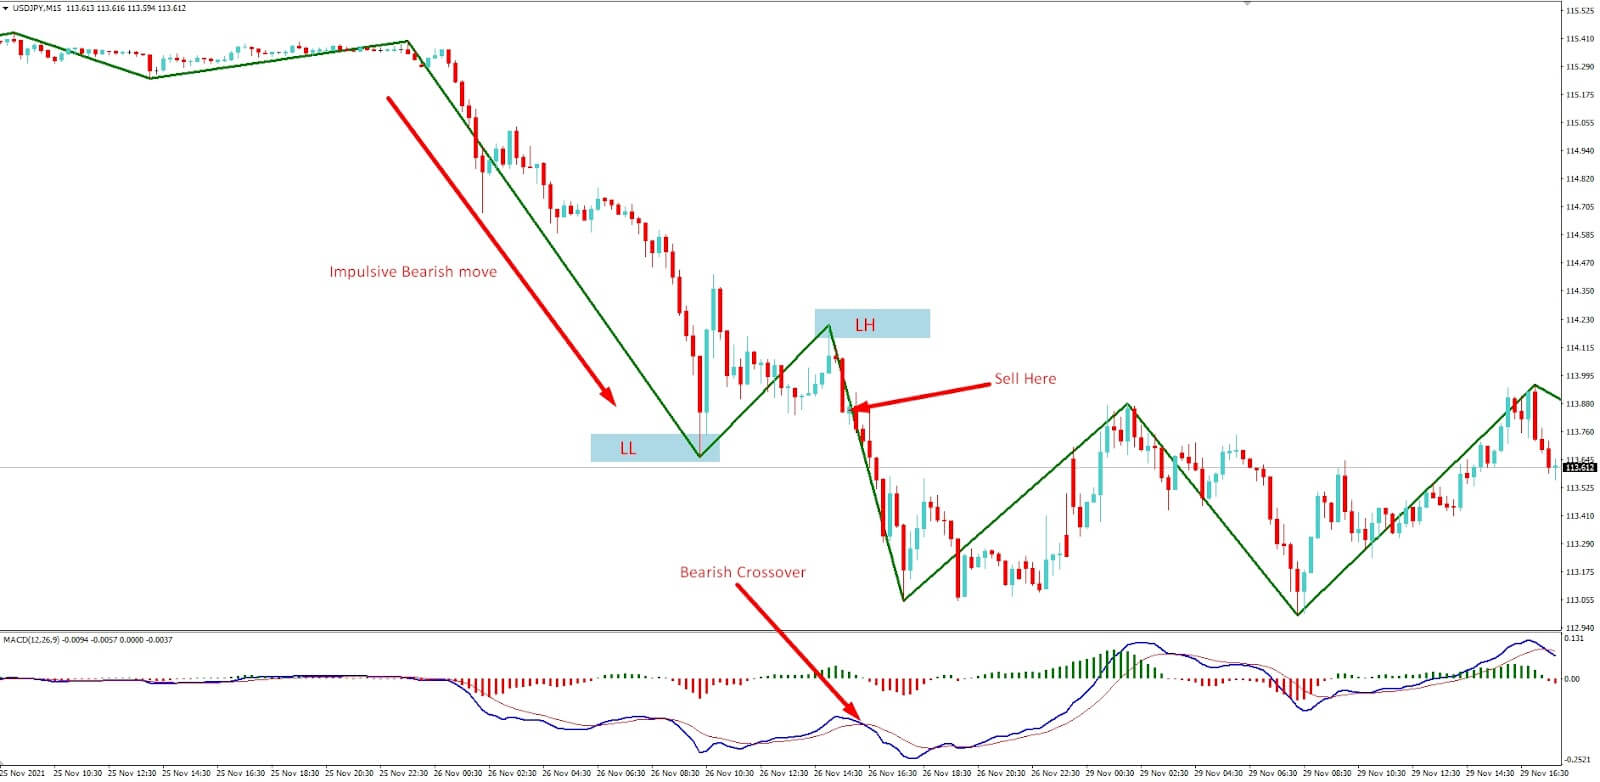
Bearish setup
Entry
Look for a sell entry when the price makes a lower high after an impulsive bearish move. Besides, the MACD blue line crosses the red line from upside to the downside below 0.00 level.
Stop-loss
SL order should be placed above the swing level/lower high with 4-5 pips buffers.
Take profit
Place your take profit order on the next support level. Otherwise, you can target at least a 1:3 risk/reward ratio.
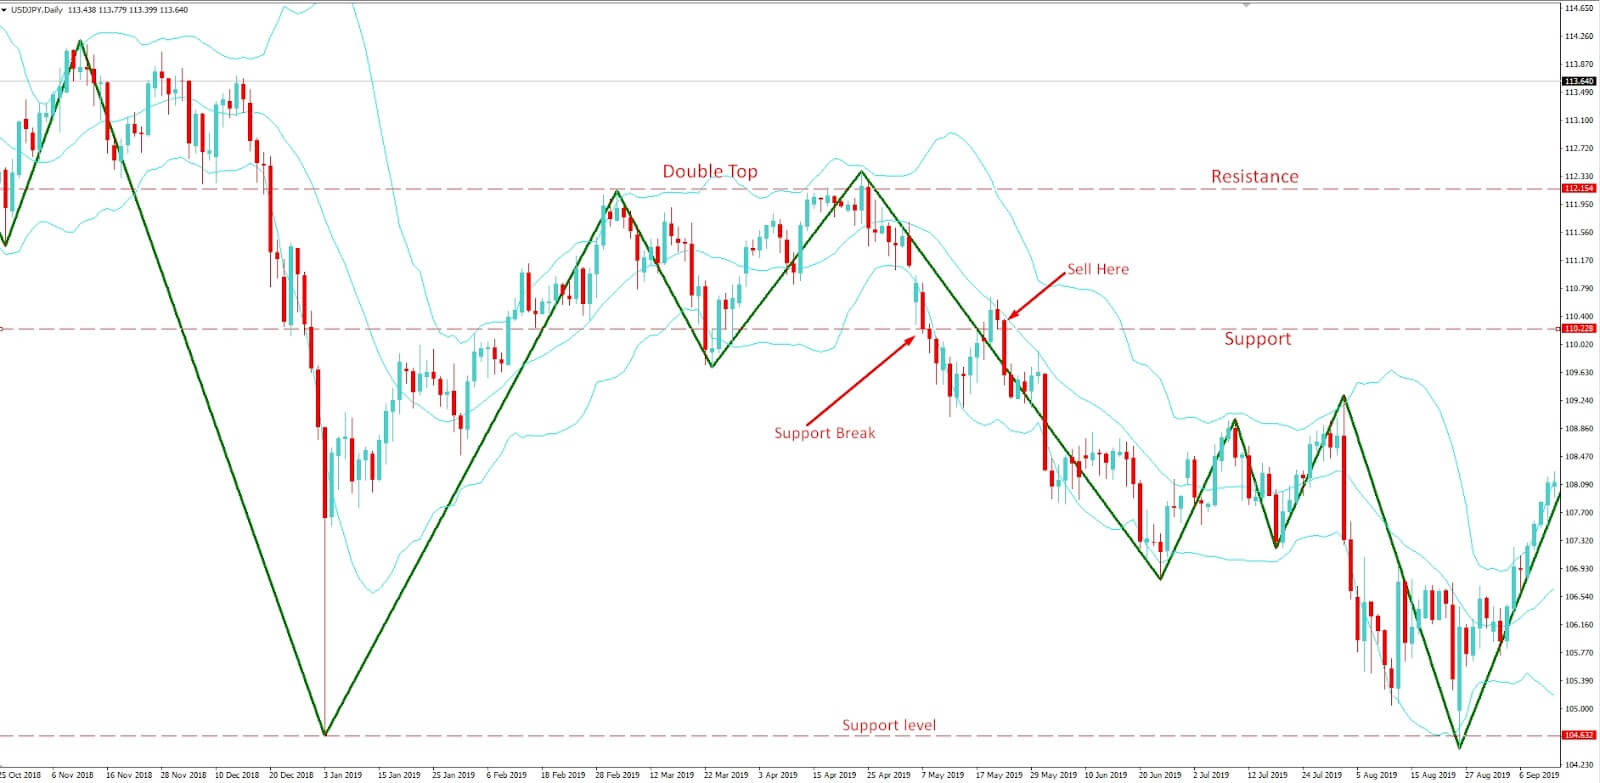
A long-term trading strategy
The Zig Zag indicator illustrates the price directions, support, and resistance levels. Besides, it also illustrates chart patterns like head and shoulders, double top, and double bottoms. This long-term trading strategy is developed based on support or resistance breakouts of chart patterns. To find entry points, we will also add the Bollinger Bands indicator on our trading chart.
Bullish trade scenario
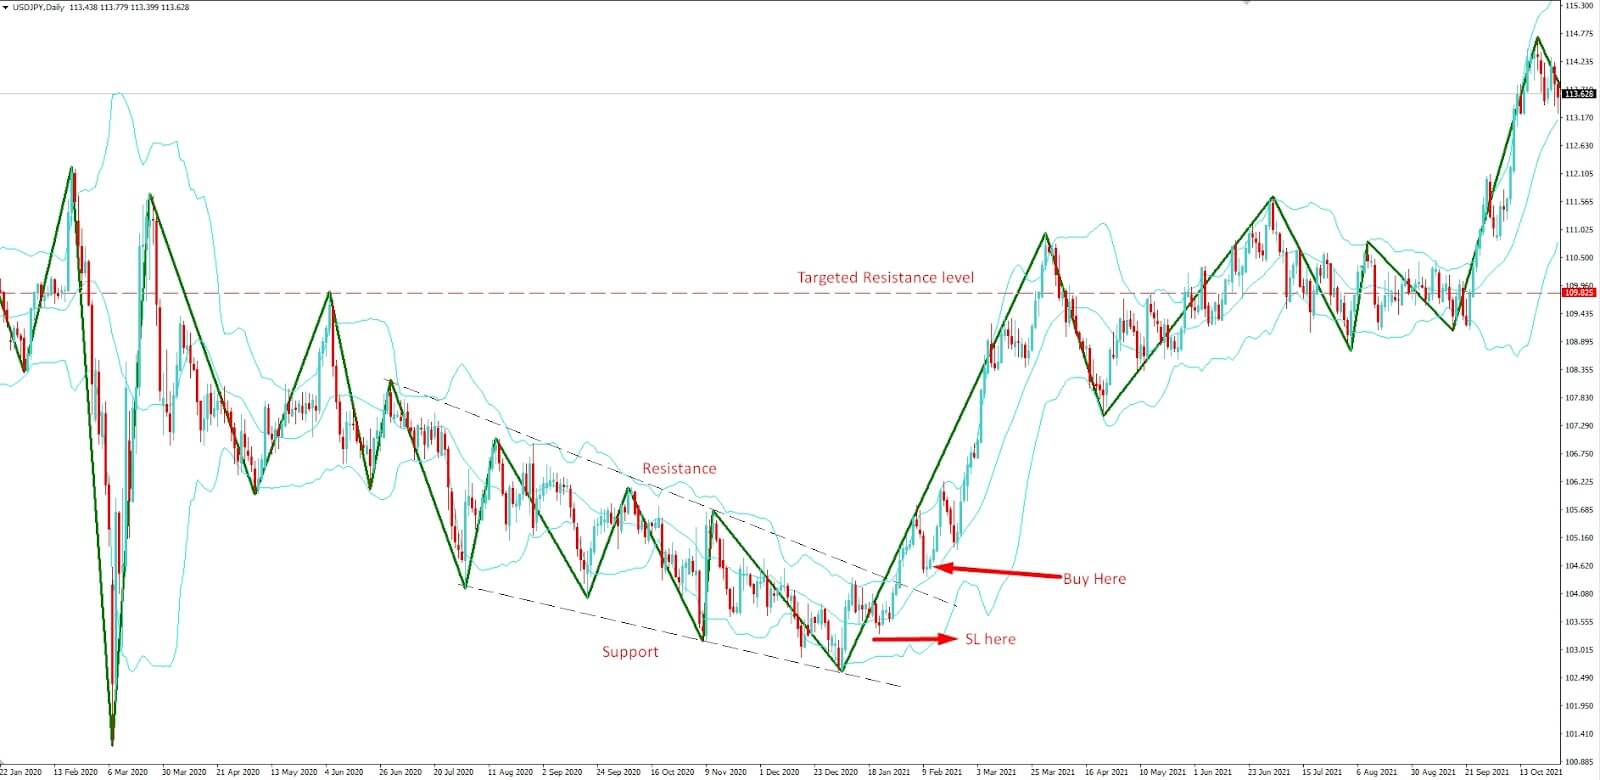
Bullish setup
Entry
Buy when the price retraces towards the Bollinger Bands middle after an impulsive bullish breakout.
Stop-loss
Put your SL order below the last swing level with a 10-15 pips buffer.
Take profit
Take the profit when the price hits the upcoming resistance level. Or else, you can target at least a 1:3 risk/reward ratio.
Bearish trade scenario
Bearish setup
Entry
Sell when the price retraces towards the Bollinger Bands middle after an impulsive bearish breakout.
Stop-loss
Put your SL order above the last swing level/above the resistance level with a 10 – 15 pips buffer.
Take profit
Take the profit when the price hits the upcoming support level. Or else, you can target at least a 1:3 risk/reward ratio.
Pros and cons
| 👍 Pros | 👎 Cons |
|
|
|
|
|
|
Final thoughts
The indicator only responds to price movements in a certain percentage and cannot anticipate future price behavior. Traders can use the indicator to define the inevident price trends. The Zig Zag indicator decreases the effect of minor price fluctuation to only show major changes.
Moreover, the trader must keep in mind to measure the last line to define whether it is temporary or permanent. If the price changes are lower than the Zig Zag area, it’ll be a quick line yet. If the price shifts are equal or higher, it can change to a permanent line.


Comments