Moving averages proved helpful for the active traders to understand the market momentum. The elementary distinction between SMA (simple moving average), WMA (weighted moving average), and the EMA (exponential moving average) is the method utilized to create the average.
What is the weighted moving average?
It is an indicator used for technical analysis. Mostly, traders use it to produce trade direction and decide to buy or sell. Rather than an SMA, using the WMA provides the more precise calculation of trend direction that gives similar weights to all the numbers in the data set.
The WMA provides current data points with less weighting on the previous one. It is enumerated by accumulating every observation in the dataset with a preset weighting factor. While traders need to produce trade signals, they use the weighted average tool. For instance, if the price action moves to the weighted average or above it, the signal is a hint for closing the trade.
Although, in any case, the price action falls close to the weighted moving average or under, then it indicates the favorable time for entering the trade.
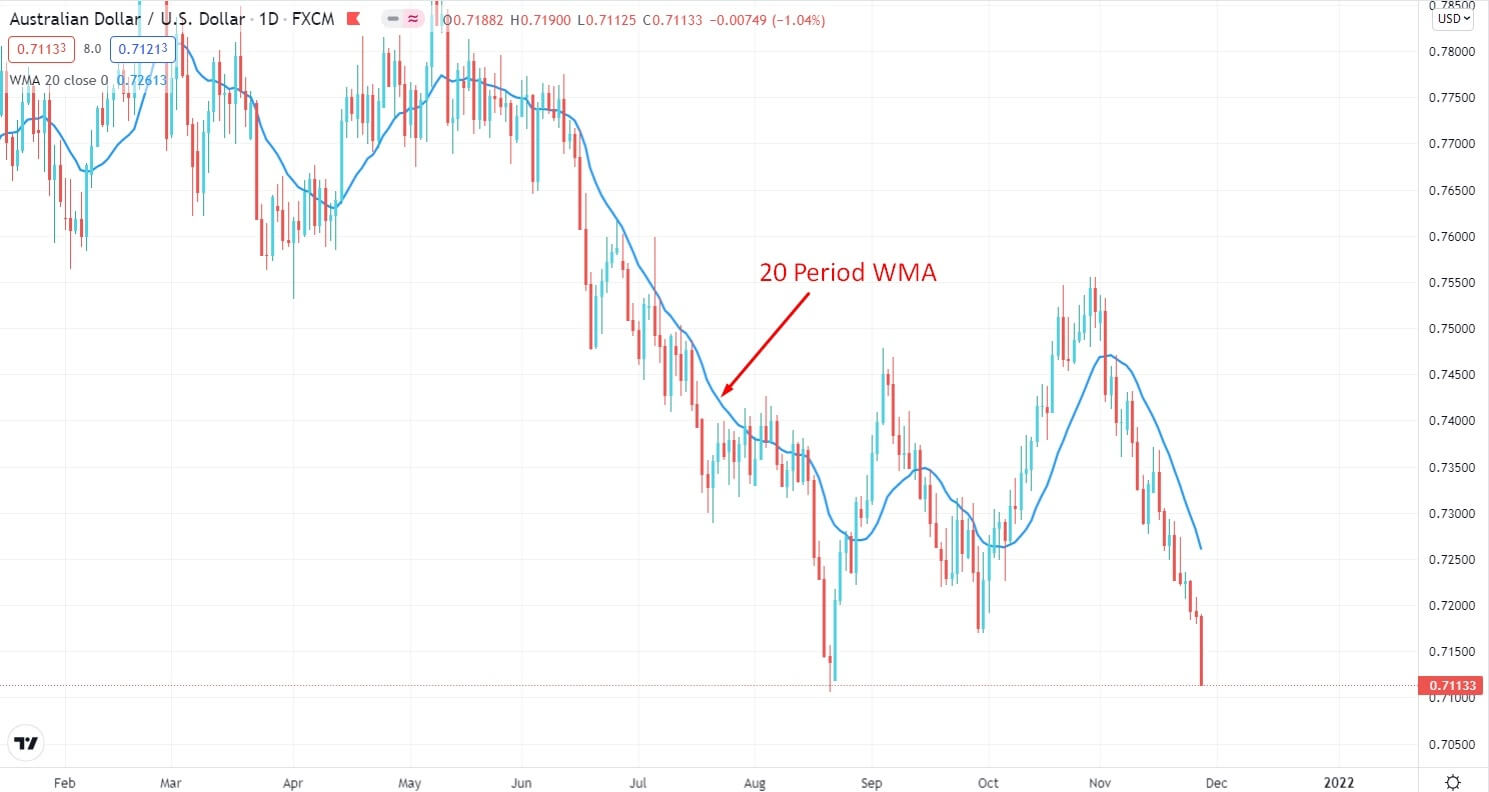
WMA on chart
How to use WMA in trading strategy?
The WMA is useful for identifying the trend directions.
- If the price goes above the WMA line, that is generally an indication of an uptrend.
- If the price falls below the WMA line means a downtrend.
The WMA also provides signals for trade. It can identify the most favorable trade signal by combining other technical indicators. A WMA going upwards over a given period hints at the support for price action; besides, if it goes downwards, it indicates resistance to price action. It is one of the methods that traders use for placing buy orders while the price is close to the revolting WMA and while the price is near the descending WMA traders place sell orders.
Furthermore, the WMA can be used to confirm the market momentum and price strength. Price action above the MA shows that the market is more robust than before because the current price is higher than the average. Also, price action is lower than its MA means the market is weakening compared to its previous situation.
How to calculate WMA?
The current data is intensely weighted, which impacts the final value of WMA better. The weighting factor is preset by the period chosen for the indicator to calculate the weighted moving average.
WMA = (P1 * 5) + (P2 * 4) + (P3 * 3) + (P4 * 2) + (P5 * 1) / (5 + 4+ 3 + 2 + 1)
Here, P1 is the current price, and P2 is the price one bar before.
A short-term trading strategy
The most famous system to use WMA in short-term trading is finding trend reversals. For instance, if the AUD/USD is in strong bullish momentum, an inversion is the point at which the pair begins to switch in a bearish way. So, as like the others MA, you can utilize WMA to identify the short-term trend reversals. Therefore, the best time frame to use this method is the M15 chart.
Various traders utilize this methodology for multiple periods, relying upon their trading style. When the two MAs cross each other, a reversal will happen at that stage. If the crossover occurs at the lower side of a bearish bias, there is a high chance that the trend will reverse and make a bullish move.
On the contrary, if the crossover happens at the higher side of a bullish bias, there is a high chance that the trend will reverse and make a bearish move. Below we have provided a short-term trading technique using WMA 7 and WMA 14.
Bullish trade scenario
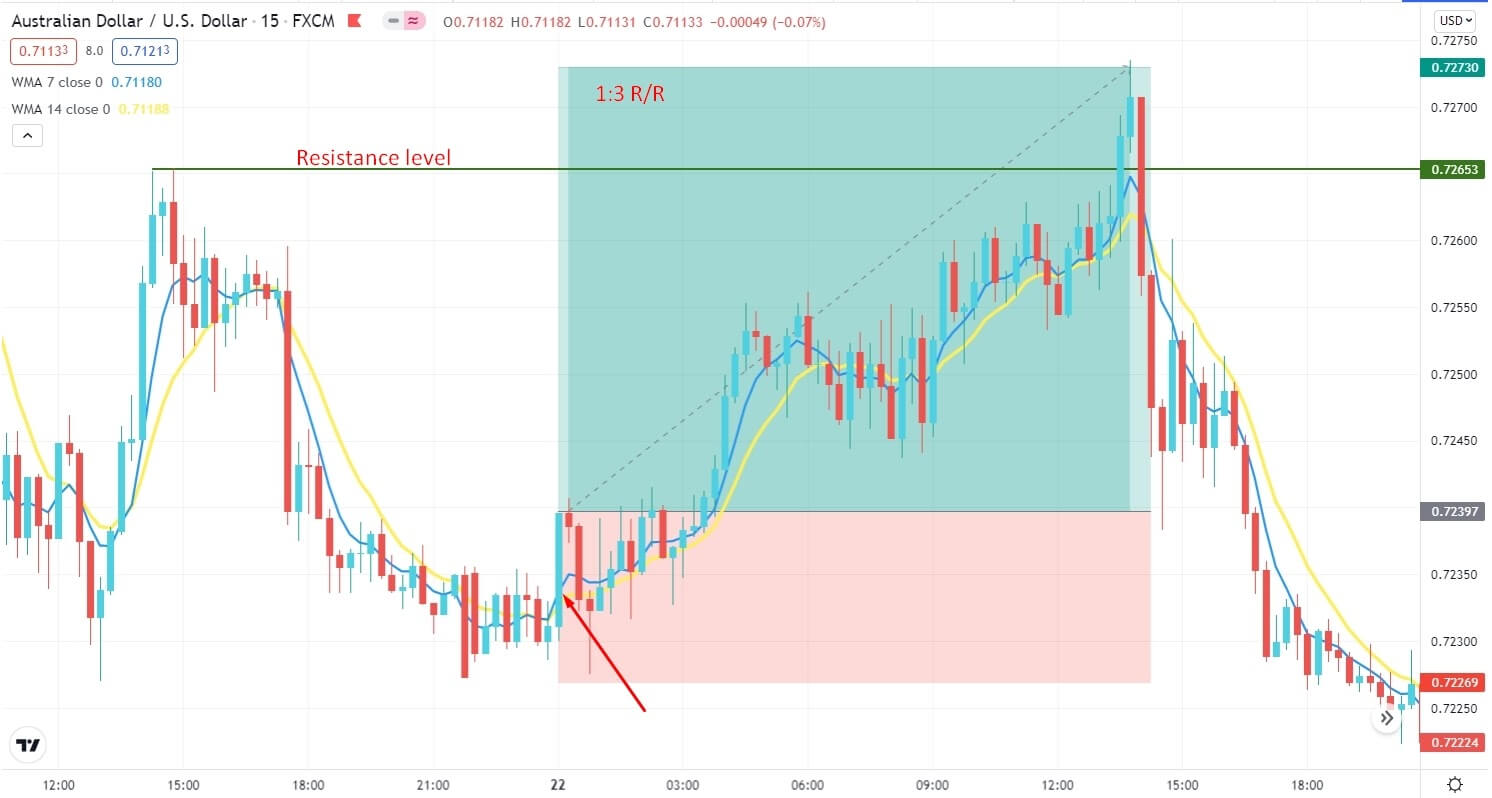
Short-term buy entry
Entry
Buy when the 7-period WMA crosses from downside to upside the 14-period WMA, and the candle closes above both WMA with a bullish body.
Stop-loss
Put it below the last swing level with a 4-5 pips buffer.
Take profit
Take the profit by targeting the next resistance level, or you can target to achieve a 1:3 risk/reward ratio.
Bearish trade scenario
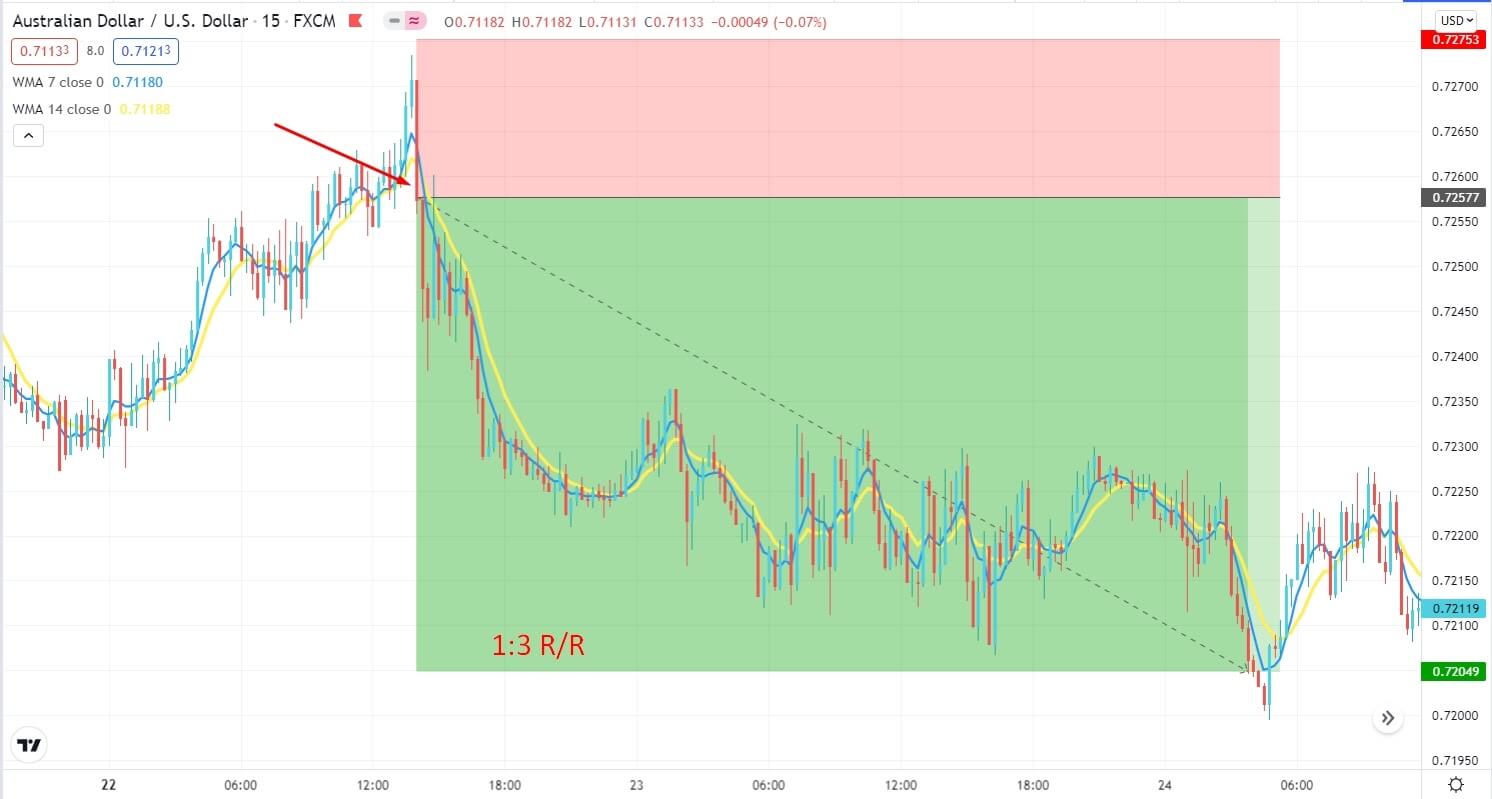
Short-term sell entry
Entry
Sell when the seven-period WMA crosses from upside to downside the fourteenth-period WMA, and the candle closes above both WMA with a bearish body.
Stop-loss
Put it above the last swing level with a 4-5 pips buffer.
Take profit
Take the profit by targeting the next support level, or you can target to achieve a 1:3 risk/reward ratio.
A long-term trading strategy
Long-term trading is very reliable using WMA. It gives an idea about the primary trend. This long-term trading strategy is based on the trend following technique. First, we have to identify the primary trend to ride it.
Moreover, we are also adding a fifty-period EMA (yellow) with twenty-period WMA (blue) to increase our accuracy.
Bullish trade scenario
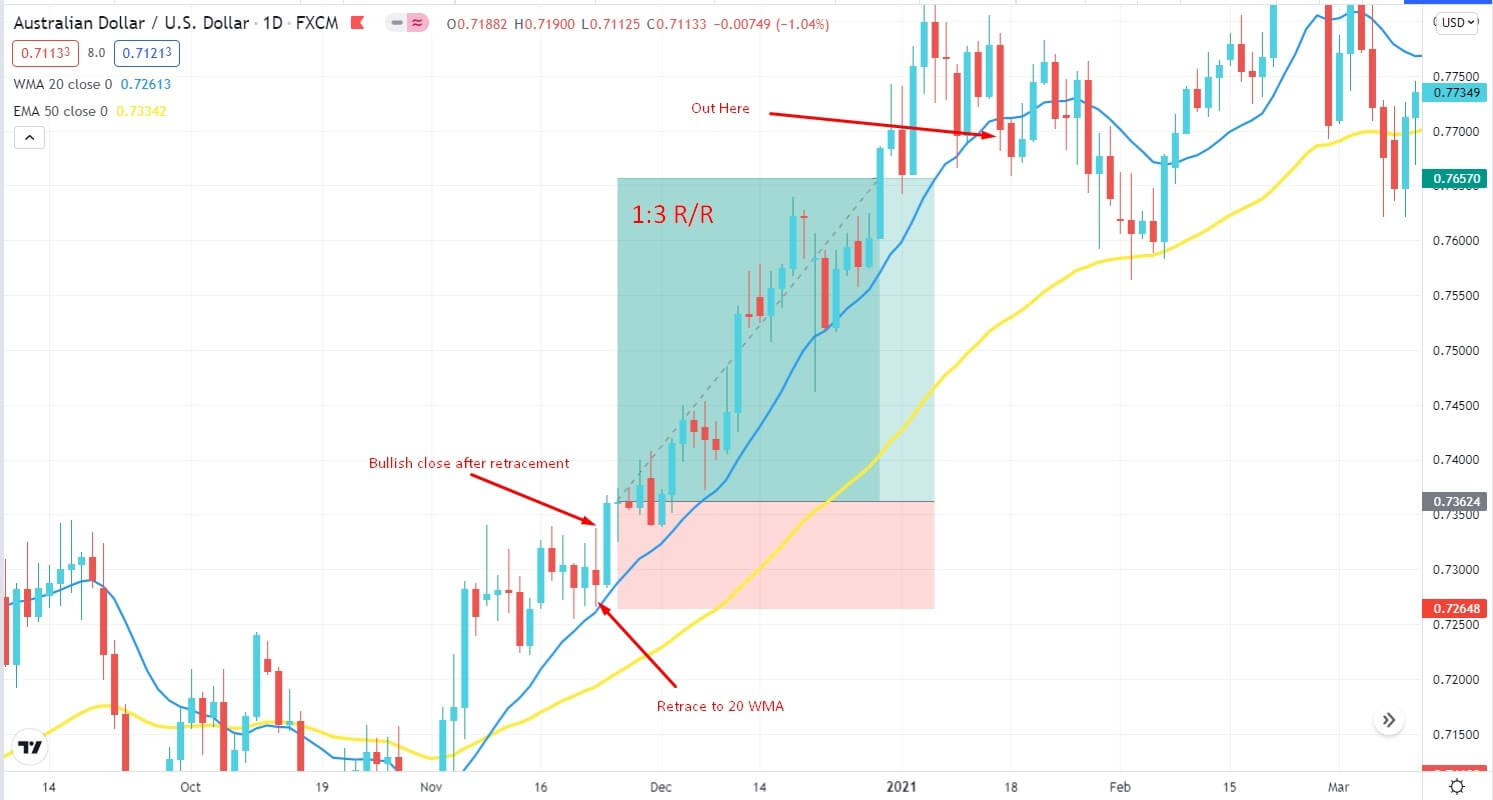
Long-term buy entry
Entry
Also, the 50 EMA is residing below the 20 WMA. For buy, look for the price to retrace towards 20 WMA and have a daily bullish candle close above the 20 WMA. Entry a buy trade when the bullish candle closes after a retracement.
Stop-loss
Place it below the retracement candle with a 10-15 pips buffer.
Take profit
Take the profit when the price had a daily bearish candle close below the 20 WMA. Otherwise, you can target at least a 1:3 risk/reward ratio.
Bearish trade scenario
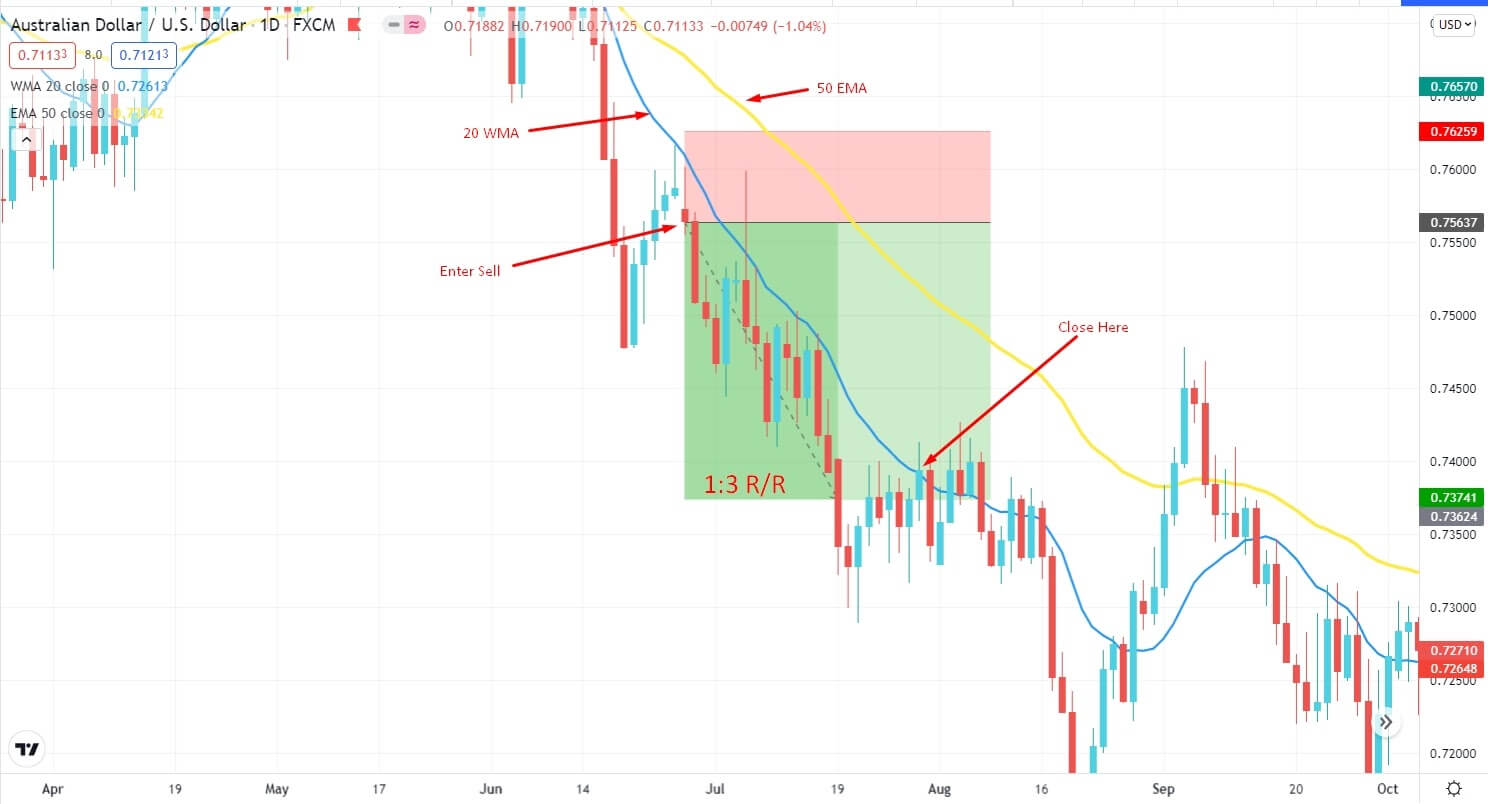
Long-term sell entry
Entry
Look for the price to retrace towards 20 WMA and have a daily bearish candle close below the 20 WMA. Also, the 50 EMA resides above the 20 WMA. Entry a sell trade when the bearish candle closes after a retracement.
Stop-loss
Place a SL order above the retracement candle with a 10-15 pips buffer.
Take profit
Take the profit when the price had a daily bullish candle close above the 20 WMA. Otherwise, you can target at least a 1:3 risk/reward ratio.
Pros and cons
| 👍 Pros | 👎 Cons |
| Traders can pick trends more quickly. | WMA is less advisable for longer time periods. |
| Shorter time periods are preferable for capturing the shifts rapidly. | Compared to SMA, WMA produces more false signals. |
| Traders do not get confused with the minor correction as a trend change. | WMA is not preferable for identifying the changes in a long-term trend. |
Final thoughts
In short, the WMA is a well-known technical indicator to trade in the financial market. Hence, knowing the uses of WMA and how to combine it with the other technical indicators to get ideal outcomes over the trades is a vital skill to develop as a trader.


Comments