Successful traders rely on several resources to participate in profitable trades. The price movement remains on several phases, such as ranging or trending. Many trading methods are available to trade on different phases of price movements. Range trading is common practice among successful crypto traders.
However, when participating in range trading, it is mandatory to learn all the basics, including risks and limitations of range trading, alongside following specific trading methods to execute successful trades. This article will define the crypto range trading pattern and successful trading strategies using this pattern.
What is range trading?
Active crypto investors consider many specifics when making trade decisions, such as the objective, market outlook, risk tolerance, etc. Market price often moves horizontally, so there are limited opportunities to enter the market.
Range trading enables opportunities to execute successful trades during that situation with the help of support resistance and a popular candle formation rectangle pattern. You can consider a rectangle if the price remains in a range for a few weeks or months. If the duration is shorter than three weeks, that may be a flag pattern.
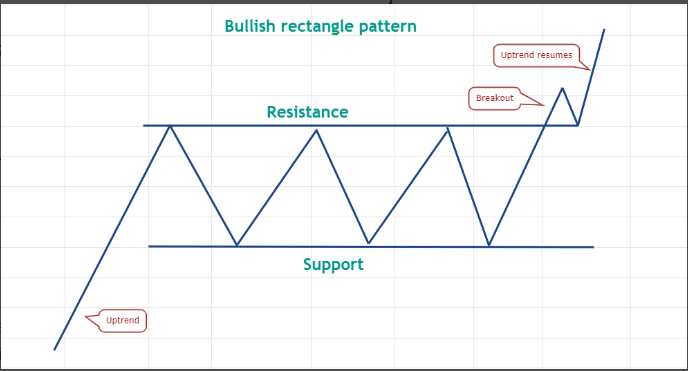
Bullish rectangle
However, both patterns contain support resistance bands. Ranging usually occurs in consolidating phase, and two types of rectangle pattern investors use bullish rectangle and bearish rectangle. A bullish one occurs after an uptrend, and a bearish one occurs after a sharp downward price movement.
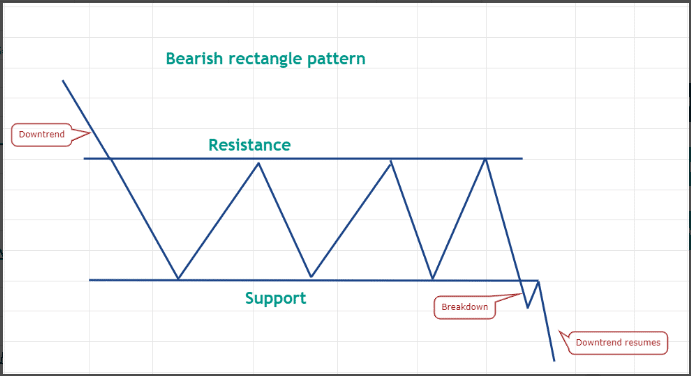
Bearish rectangle
How to trade using range trading?
Range trading is a unique method that investors determine the range and open frequent buy/sell depending on market context. For example, imagine any crypto trading near $25; you may expect to go near $30 and remains/fluctuating in that range for a particular period.
So when you identify this range, place buy orders whenever the price reaches near $25 (support) level and open sell orders when the price reaches $30 resistance level. As long as the price remains within that range, you can execute several trades according to market context.
When the price crosses over the bullish rectangle, it usually continues to move upward, and if the price breaks below a bearish rectangle, it continues to decline more. Note that a valid ranging occurs when the price touches the at least twice, and you can ignore minor facts or ideal patterns when applying on live charts.
A short-term trading strategy
We use the volume indicator alongside spotting a ranging phase of any crypto asset in this trading method. We use multi-time frame analysis in this trading method. The concept is simple to determine the overall direction of price movement from upper time frame charts and seek entry/exit positions in lower time frame charts.
We use D1, H4, H1 and 15-min charts in this trading method. As a short-term trading strategy, trade execution occurs on a 15-min or hourly chart.
Bullish trade scenario
Spot a bullish rectangle from upper time frame charts and seek to open buy positions at lower time frame charts.
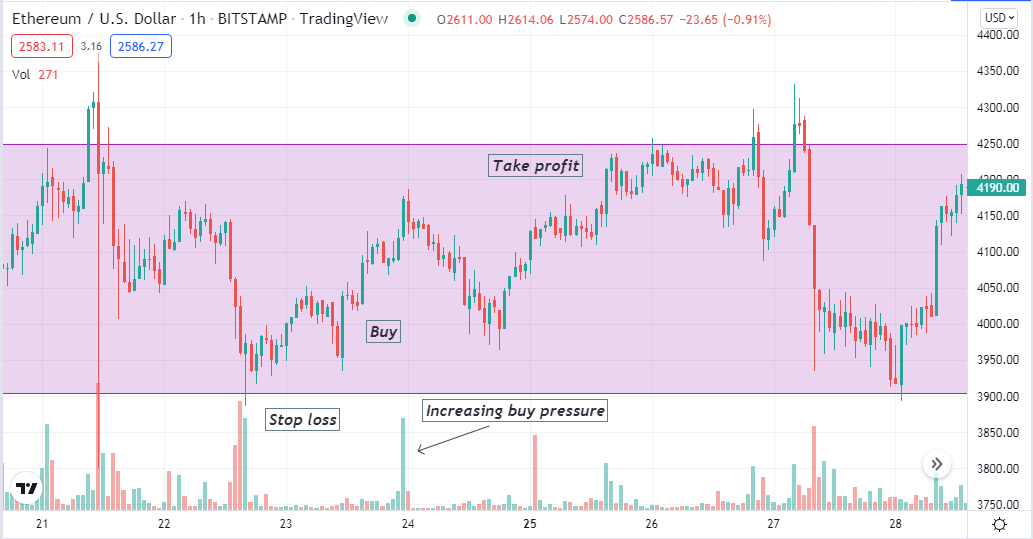
Bullish setup
Entry
Observe the volume indicator reading when the price reaches near the support level. The volume indicator declares increasing buying pressure open a buy trade.
Stop loss
Place an initial stop loss below the range with a buffer of 5-10 pips.
Take profit
The initial profit target will be a few pips below the resistance.
Bearish trade scenario
Spot a bearish rectangle from upper time frame charts and seek to open sell positions at lower time frame charts.
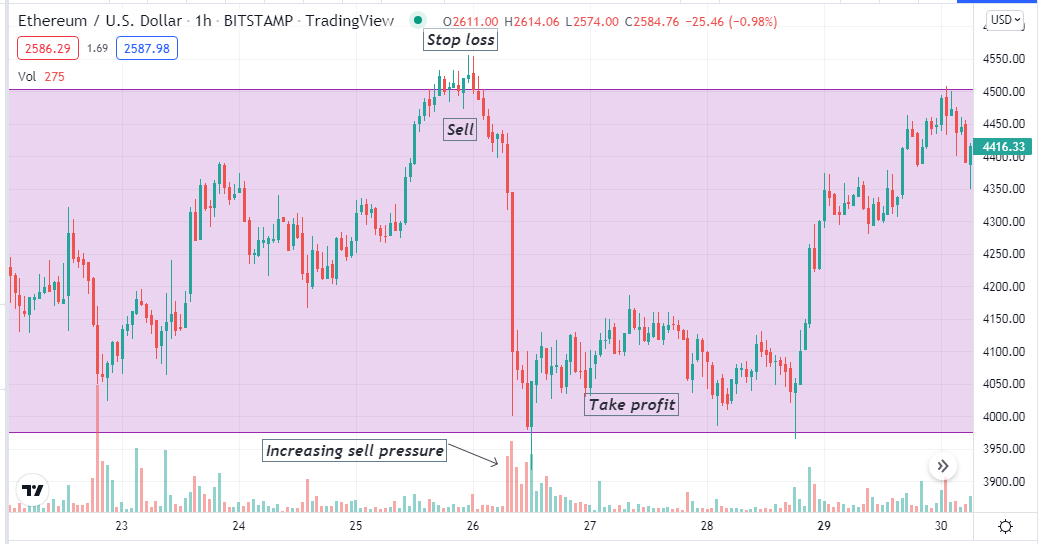
Bearish setup
Entry
Observe the volume indicator reading when the price reaches near the resistance level. The volume indicator declares increasing selling pressure open a sell trade.
Stop loss
Place an initial stop loss above the range with a buffer of 5-10pips.
Take profit
The initial profit target will be a few pips above the support.
A long-term trading strategy
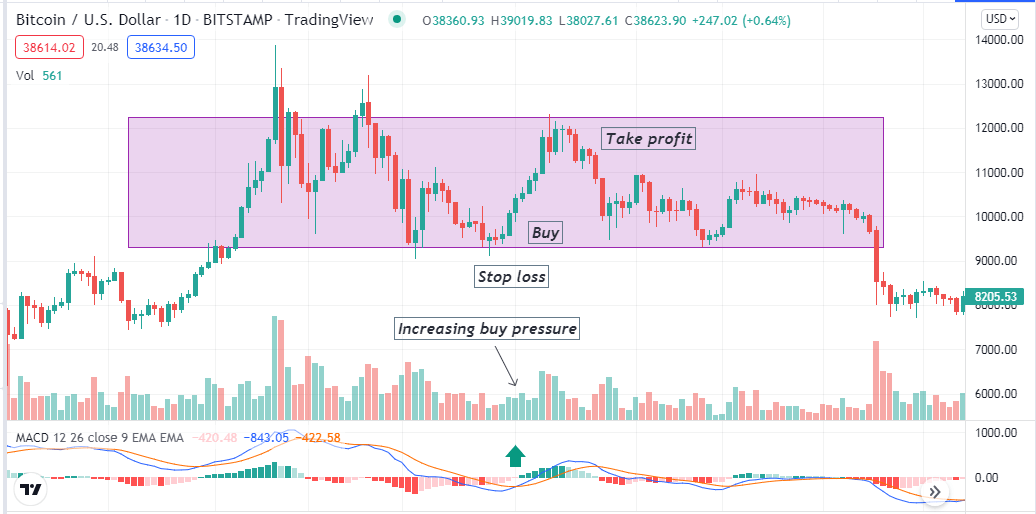
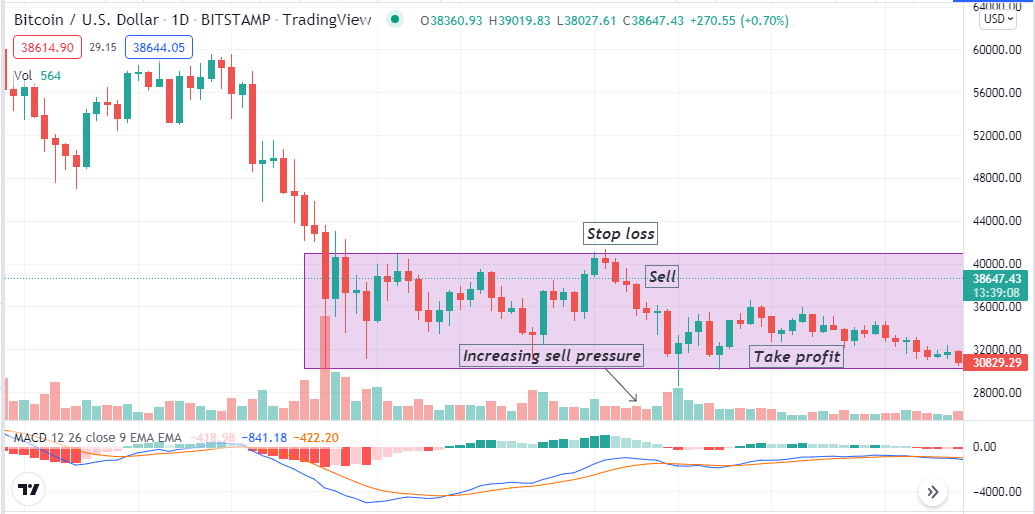
We use rectangle patterns to identify the consolidating phase of price movements in this trading method. This method involves the MACD and the volume indicator; it is suitable for any crypto asset that ranges on many time frame charts. We use the weekly, daily and H4 charts in this trading strategy. We execute trades on an H4 or daily chart while seeking to confirm the range and current trend from the weekly chart.
Bullish trade scenario
When seeking to open buy orders, stop bullish rectangle and observe:
- The price reaches the support level.
- The dynamic blue line cross above the dynamic red line on the MACD window.
- MACD green histogram bars take place above the central (0.0) line.
- The volume indicator declares an increasing buy pressure.
Bullish setup
Entry
Match these conditions above and open a buy position.
Stop loss
The initial stop loss will be below the bullish momentum and below the range.
Take profit
The initial profit target will be below the resistance of the range. Otherwise, close the buy order when:
- MACD red histogram bars take place below the central (0.0) line.
- The dynamic blue line crosses below the dynamic red line on the MACD window.
- The volume indicator declares selling pressure.
Bearish trade scenario
When seeking to open sell orders, stop bearish rectangle and observe:
- The price reaches the resistance level.
- The dynamic blue line cross below the dynamic red line on the MACD window.
- MACD red histogram bars take place below the central (0.0) line.
- The volume indicator declares an increasing sell pressure.
Bearish setup
Entry
Match these conditions above and open a sell position.
Stop loss
The initial stop loss will be above the bearish momentum and above the range.
Take profit
The initial profit target will be above the support of the range. Otherwise, close the sell order when:
- MACD green histogram bars take place above the central (0.0) line.
- The dynamic blue line crosses above the dynamic red line on the MACD window.
- The volume indicator declares buying pressure.
Pros and cons
| 👍 Pros | 👎 Cons |
|
|
|
|
|
|
Final thought
A rectangle pattern is a successful and popular trading tool for professional traders as it allows executing successful trades in both situations, a ranging market, and a continuation pattern. A crypto trader only needs to spot the pattern correctly, use other technical indicators or tools, or not execute successful trades.


Comments