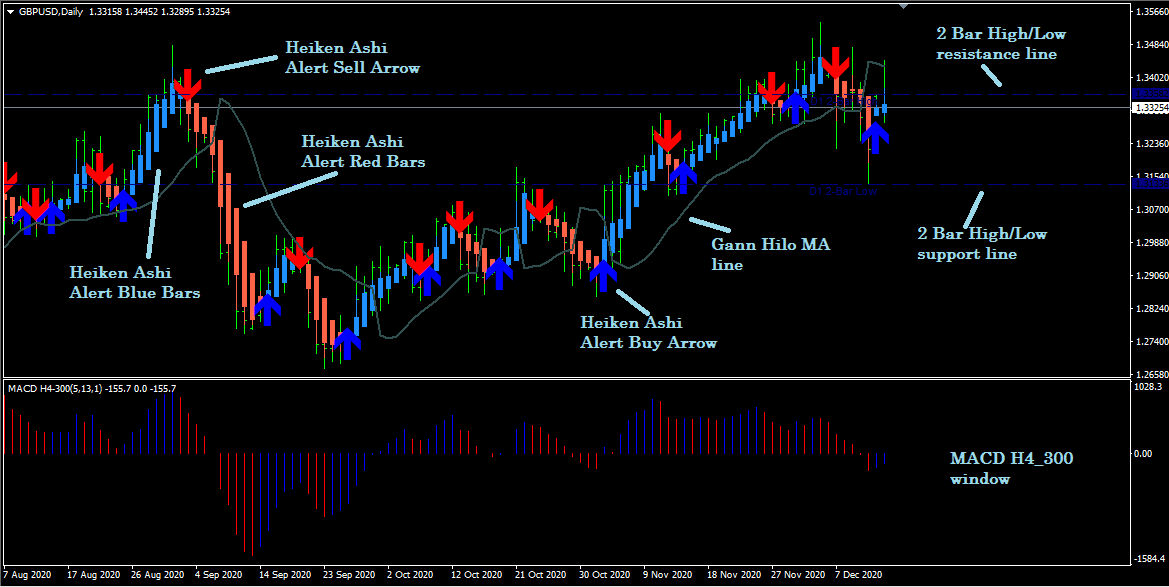
The MTF trend pullback trading system for MT4 is a trend-following strategy that uses some well-known technical tools and multi time frame analysis to generate trading positions. It is a straightforward and easily adaptable trading method, so anyone with some basic trading knowledge can make a constant profit by this strategy.
What is multi time frame analysis?
It merely gets a trade idea by observing more than two or more time frame windows of a specific asset. This analysis is used to get the bigger picture of the asset price movement or a “birds-eye view” about the asset.
The fake price shifting points, highs/lows, and lower time frames can quickly be sorted and eliminated using multi time frame analysis. The basic idea is to generate the most accurate trading positions by verifying the trade direction before placing any entry.
The MTF trend pullback trading system for MT4
This trading method uses reading from lagging indicators representing previous market data about trends, momentum, volatility, etc. Using one specific type of indicator as a trading strategy is not a good idea compared to using a few of them and combining all information to predict the future price movement.
List of features used tools:
- Gann Hilo
- Heiken Ashi Alert
- 2 Bar High/Low
- MACD H4_300
Bullish trading strategy
This trading system works fine with any significant or minor currency pair, and two sets of time frames would do analysis:
- For short term: 5 min, 15 min, 1-hour
- For long term: 1-hour, 4-hour, 1-day
As this trading system uses multi time frame analysis, the idea is to find the trading position at lower or short time frames and verify the direction from higher time frames.
Check the conditions below before placing a buy order:
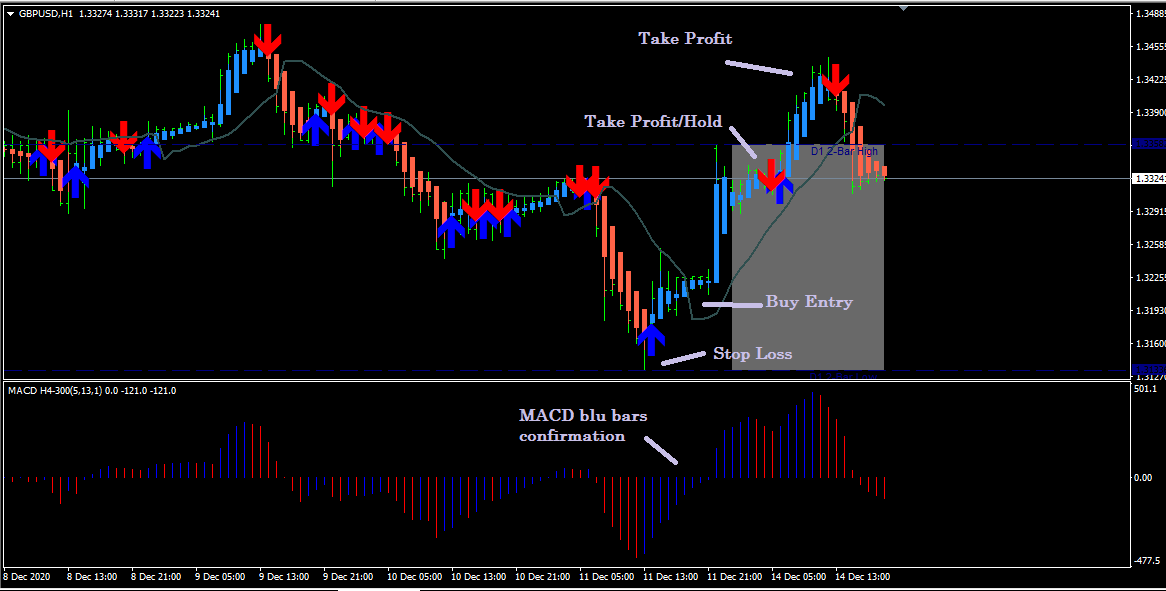
- Check that the current candle color is blue by the Heiken Ashi Alert indicator (a bull candle).
- The Heiken Ashi buy or blue arrow appears below the bull candle after a recent swing low. As well as look at the other two time frames of short — 5 min, 15 min, 1-hour, or long — 1-hour, 4-hour, 1-day, chart.
- Verify a minimum of two of them — contains at least one buy arrow below the candles. So it could be two or more. Thus more buy arrow indicates more buy pressure.
- Price candle is crossing above the Gann Hilo — the custom-made MA line on the main chart. Thus the line above the upper time frame is better than the lower.
- The signal bars are blue at the MACD indicator window. No matter if it is below or above the central or 0 line. Still, the blue bars above the mainline indicate the price has already started to shift upward, or an uptrend has begun.
Entry
Check all the buy conditions above are valid for the target asset on a specific time frame window. Later on, verify the entry direction with the other two charts related to your entry type, short/long term, wait until the current candle closes, then place a buy order at a suitable price.
Note
The trader must use common sense like matching the reading of indicators with all time frames before taking any entry. It means three short-term or long-term sets. Trading currencies with this strategy during a related pair’s major fundamental economic events is risky.
Stop loss
Set a tight stop loss below the 2 bar high/low support or low level and move it to further upside when the price breaks above the 2 bar resistance or high line and stays above it.
Take profit
Close the buy positions if:
- Candles become red, and the Heiken Ashi sell arrow appears above the candles.
- The MACD indicator window starts to make red bars.
- Price candle crosses at or remains below the Gann Hilo line.
Note
Using trailing stops is the best idea for this strategy rather than waiting until a full reversal occurs.
Bearish trading strategy
This trading system works fine with any significant or minor currency pair, and analysis would be done by two sets of time frames:
- For short term: 5 min, 15 min, 1-hour
- For long term: 1-hour, 4-hour, 1-day
This trading system uses multi time frame analysis to find the trading position at lower or short time frames and verify the direction from higher time frames.
Check the conditions below before placing a sell order:
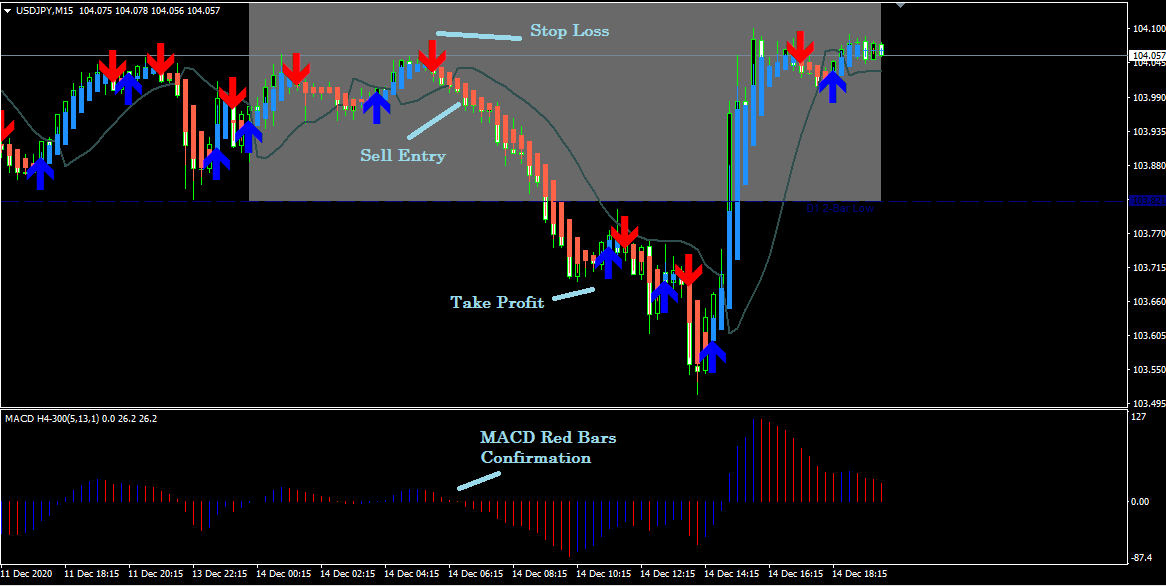
- Check that the current candle color is red by the Heiken Ashi Alert indicator (a bearish candle).
- The Heiken Ashi sell or red arrow appears above the bearish candle after a recent swing high.
- Look at the other two time frames short — 5 min, 15 min, 1-hour, or long — 1-hour, 4-hour, 1-day chart.
- Verify a minimum of two of them contains at least one sell arrow above the candles. It could be two or more. Thus more sell arrows indicates more sell pressure.
- Price candle is at or crossing below the Gann Hilo, the custom-made moving average line on the main chart, line — above the upper time frame is better than lower.
- The signal bars are red at the MACD indicator window. It doesn’t matter if it is below or above the central or 0 line.
- Still, the blue bars below the central line indicate the price has already started to shift downward, or a downtrend has already started.
Entry
Check all the sell conditions above are valid for the target asset on a specific time frame window. Later on, verify the entry direction with the other two charts related to your entry type, short term or long term, and wait until the current candle closes, then place a sell order at a suitable price.
Note
The trader must use common sense like matching the reading of indicators with all (three short-term or long-term set) time frames before taking any entry. Trading currencies with this strategy during a related pair’s major fundamental economic events is risky.
Stop loss
Set a tight stop loss above the 2 bar high/low resistance or high level and move it to further downside when price breaks below the 2 bar support or low line and stays below it.
Take profit
Close the buy positions if:
- Candles become blue, and the Heiken Ashi buy arrow appears below the candles.
- The MACD indicator window starts to make blue bars.
- Price candle crosses at or remains above the Gann Hilo line.
Note
Using trailing stops is the best idea for this strategy rather than wait until a complete reversal occurs.
Conclusion
This strategy could be an unbeatable trading method for smart and disciplined traders to follow necessary trading and money management rules.


Comments