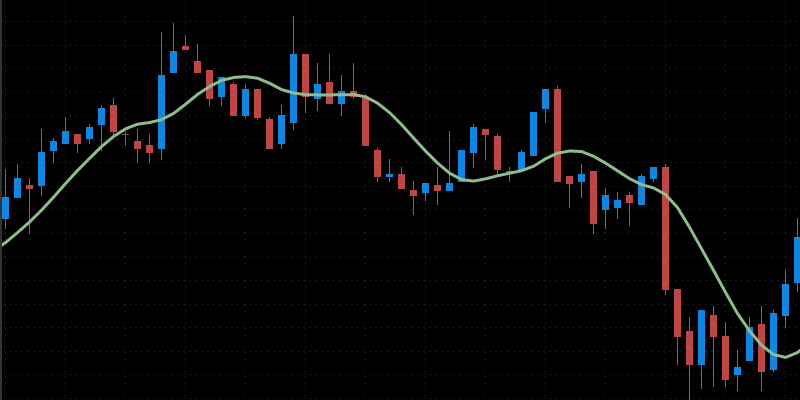
Introduced by Tim Tillson in 1998, the Tillson moving average (T3MA) is one of the best moving averages (MA) around smoothness. Compared to the simple moving average (SMA) and exponential moving average (EMA), T3MA displays a smoother curve.
When T3MA came into being, many futures market traders became fascinated with it due to its smoothness and minor delay. In the past, trend-following systems used indicators that lag way behind price.
The introduction of T3MA was a game-changer for those traders. Due to less lag, traders can enter early into the forming trend. T3MA reacts to price change 30% to 40% faster than the other types of moving averages, including SMA and EMA.
T3MA calculation
Derived from EMA, T3MA smoothed out EMA six times. So you can say T3MA is an EMA of another EMA up to six levels of smoothing. This is the reason why you get a very smoothed line. Another thing that makes T3MA different from other moving averages is the volume factor, dramatically affecting how the curve displays on the chart.
The only drawback for T3MA is that it tends to overshoot when the trend changes direction. This is not much of a big downside to worry about, though. Just keep in mind that when T3MA overshoots, this means that the trend is reversing. Therefore, it takes a little time for the indicator to catch up, especially if the trend change happens rapidly.
T3MA settings
If you use TradingView for your market analysis, you might feel overwhelmed by the number of choices provided. There are several versions of this indicator currently available. If you do trial and error, you might get a different type of T3MA each time.
To use the original T3MA version:
- Follow this step
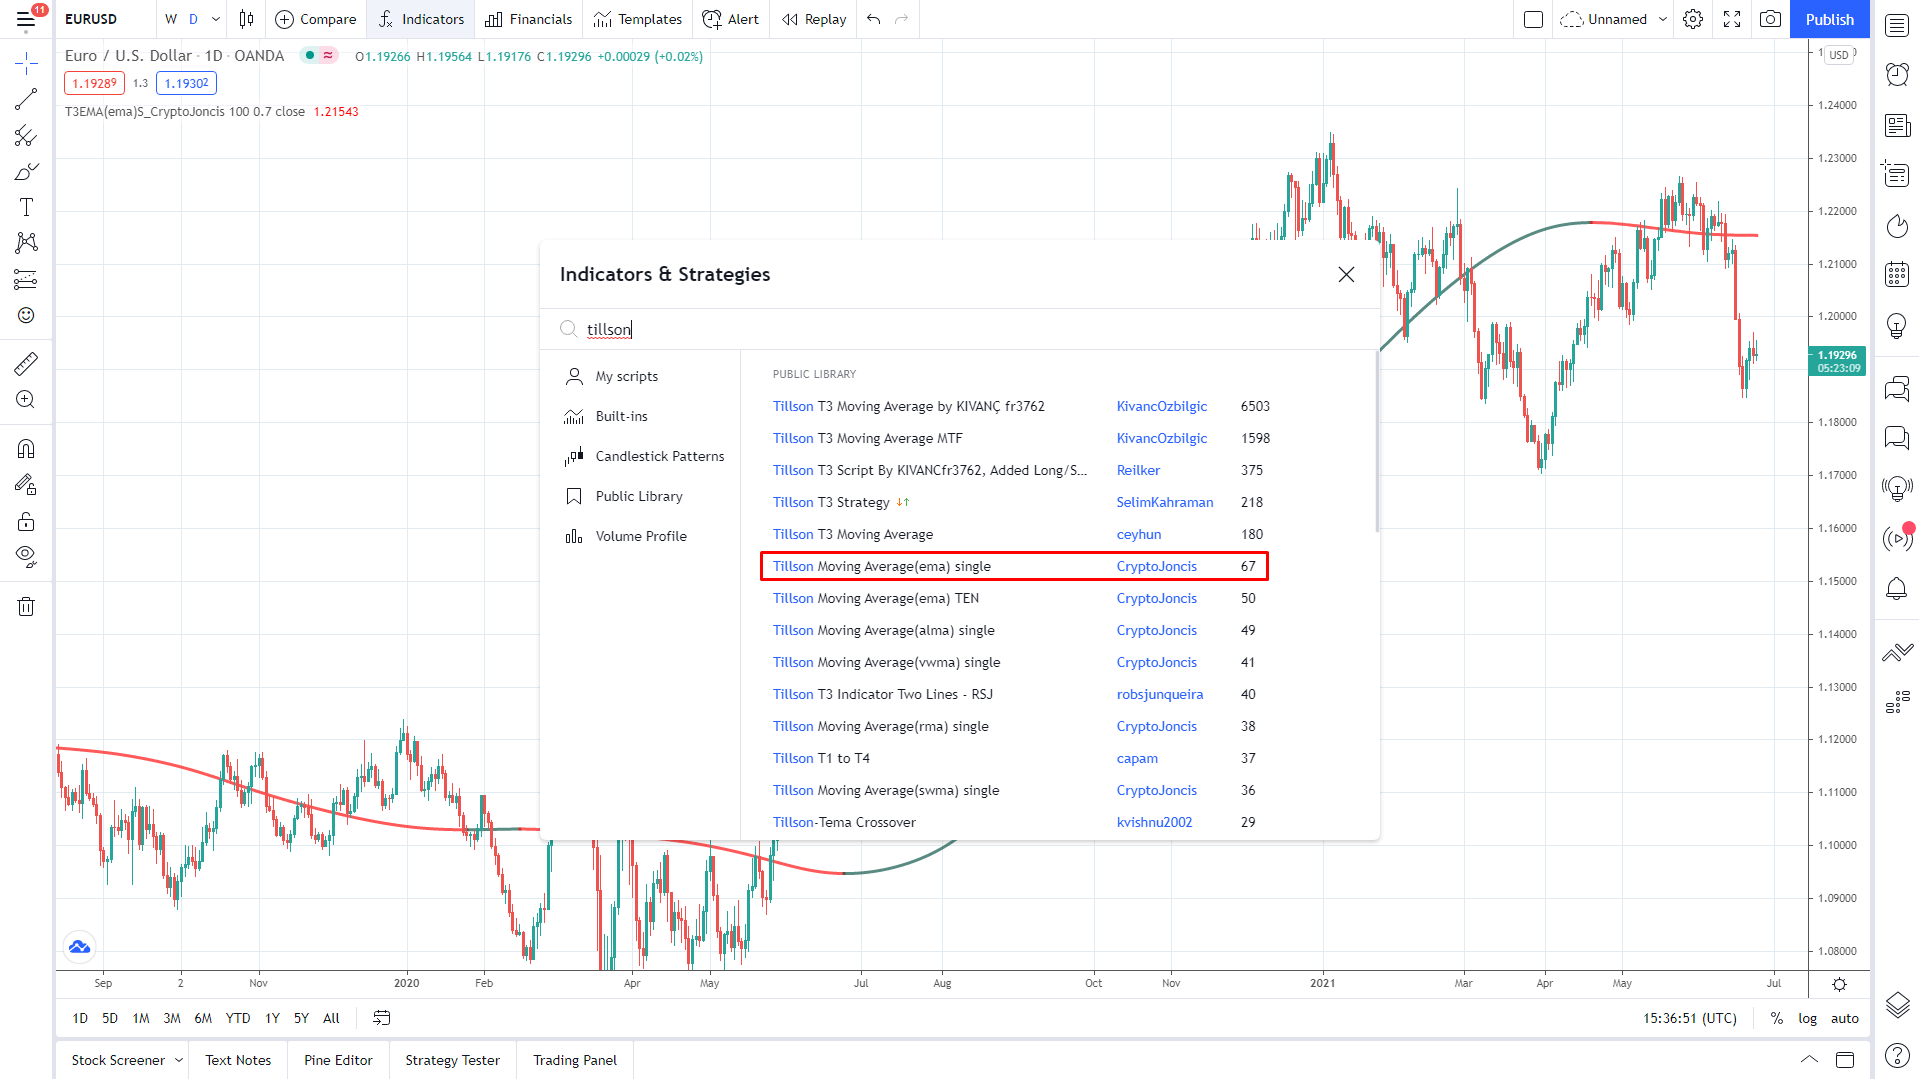
- Click the indicators menu, and then type “Tillson” in the search box that appears
- Select the version created by someone with the username “CryptoJoncis 67”
- Refer to the above image for guidance
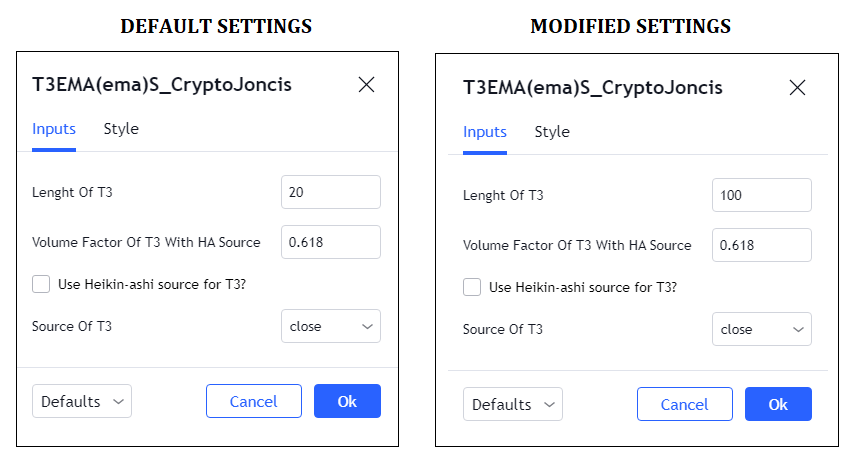
After selecting the correct T3MA version and adding the indicator to the chart, modify it by setting it. There are many ways to access the settings option. The easiest way is to find the indicator on the chart’s upper-left portion and click the settings icon.
Once the settings dialog box is open, you will see the default settings. Refer to the image above. The default settings are on the left side. A sample modified setting is on the right side.
The parameters that you can adjust are the following:
-
-
- Length of T3 — choose any value that you like
- Volume factor — keep the default value
- Use Heiken-Ashi — keep the box unchecked
- Source of T3 — keep the default value
-
This T3MA version uses 20 as the default length. If you want to see the actual trend, you should use a higher value, such as 100. Changing the value of the volume factor would drastically affect the T3MA plot on the chart.
Meanwhile, if you tick the Heikin-Ashi box, you will see a chart instead of a candlestick chart. Just maintain the source parameter to the default value of close price.
T3MA vs. SMA and EMA
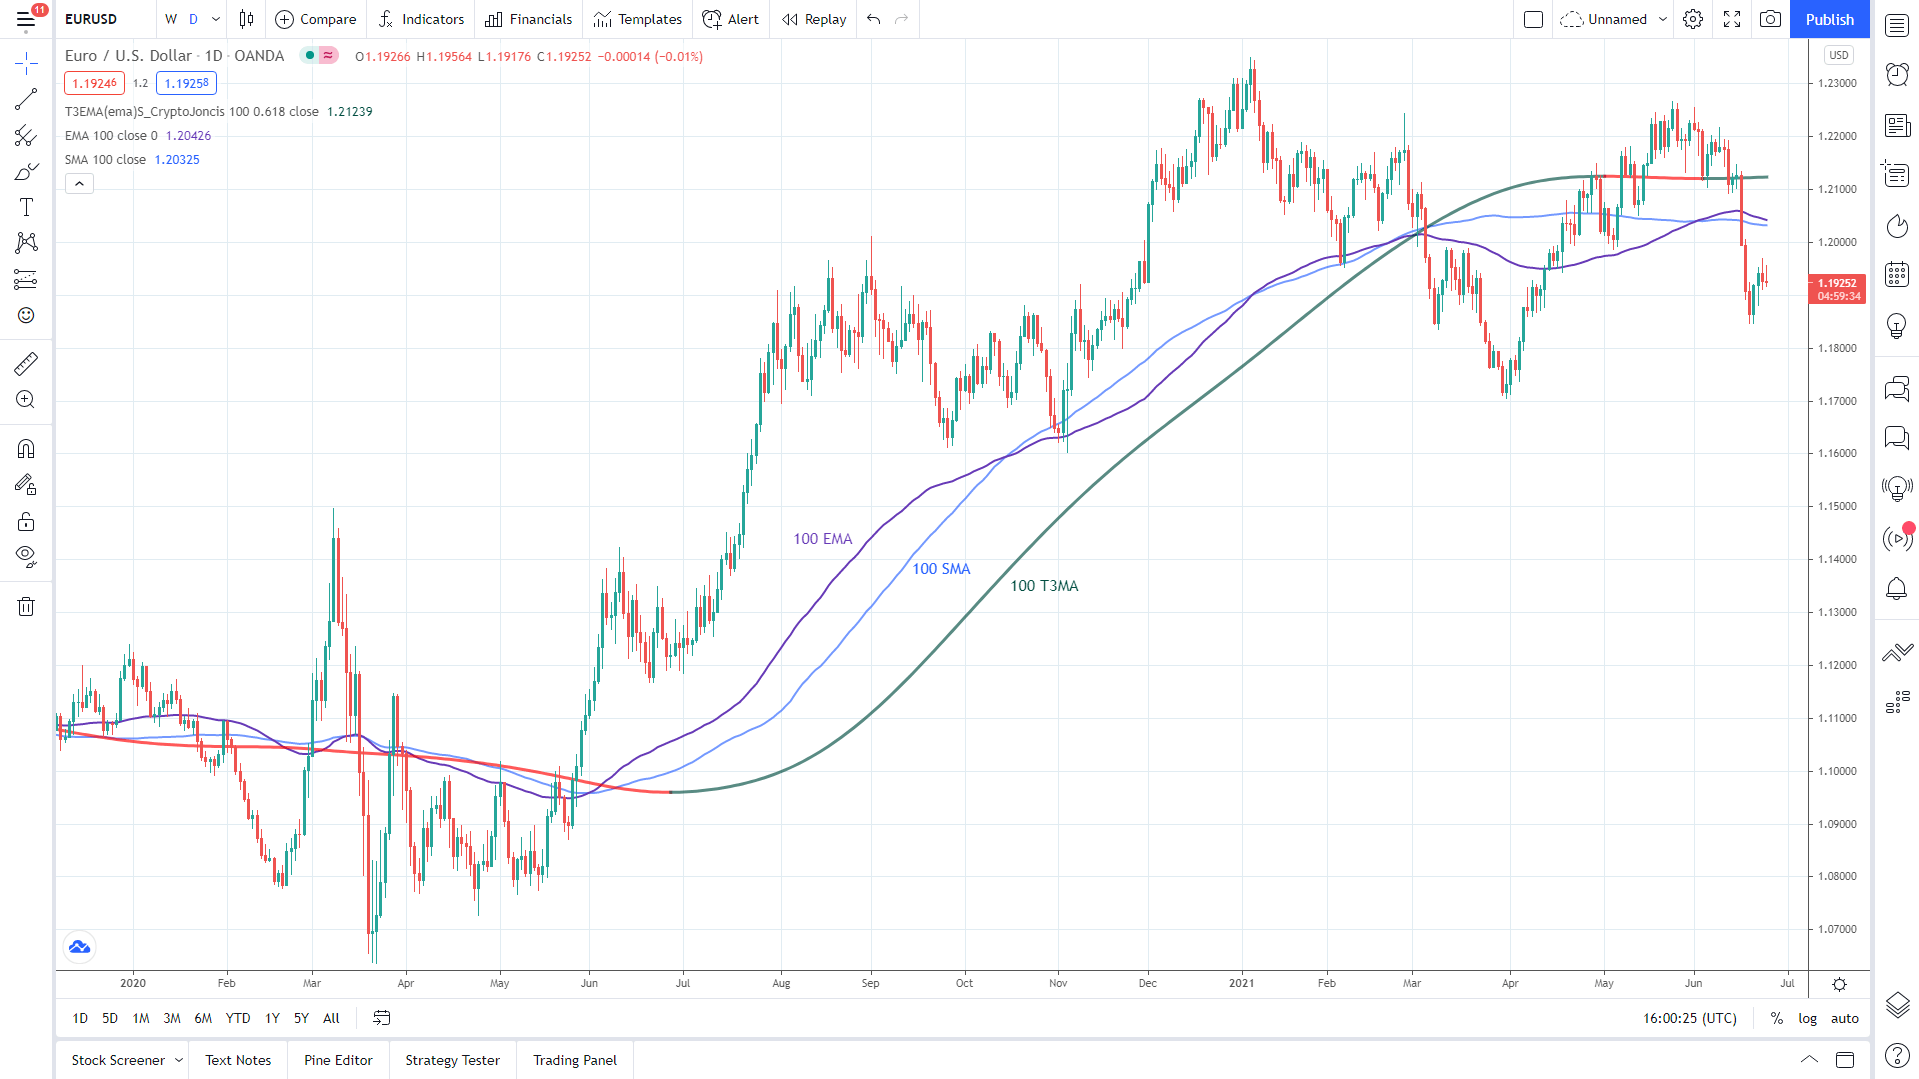
Consider the above EUR/USD daily chart, which shows three moving averages in the same period (i.e., 100). Compared to SMA and EMA, T3MA has a smoother curve and maintains a greater distance from the price when the market is trending, and has a steeper angle than the two MAs. So this makes the comparison easier to do.
When the market is ranging, all three MA’s are flat. However, T3MA appears more balanced. While this difference is minor, it is an essential dynamic for the discerning trader. With this T3MA aspect, you can accurately tell if the market is entering such a condition. This way, you can recalibrate your trading method much earlier.
The T3MA advantage
Because of the smoothness factor, T3MA provides fewer false signals than the traditional moving averages. While the slope of SMA and EMA oscillates up and down quickly with minor price movement, T3MA remains steadfast and disregards small price fluctuations. This will give you the confidence to stay in a trade until T3MA convincingly turns the other way. A color change in T3MA marks this event.
If you are looking for a trade entry, T3MA lets you enter trades on high-quality signals, which would mean fewer trades and fewer losses. This is more evident when you use a crossover strategy using two T3MA with different periodicities. Using the same periods for EMA would lead to many signals but many losses as well.
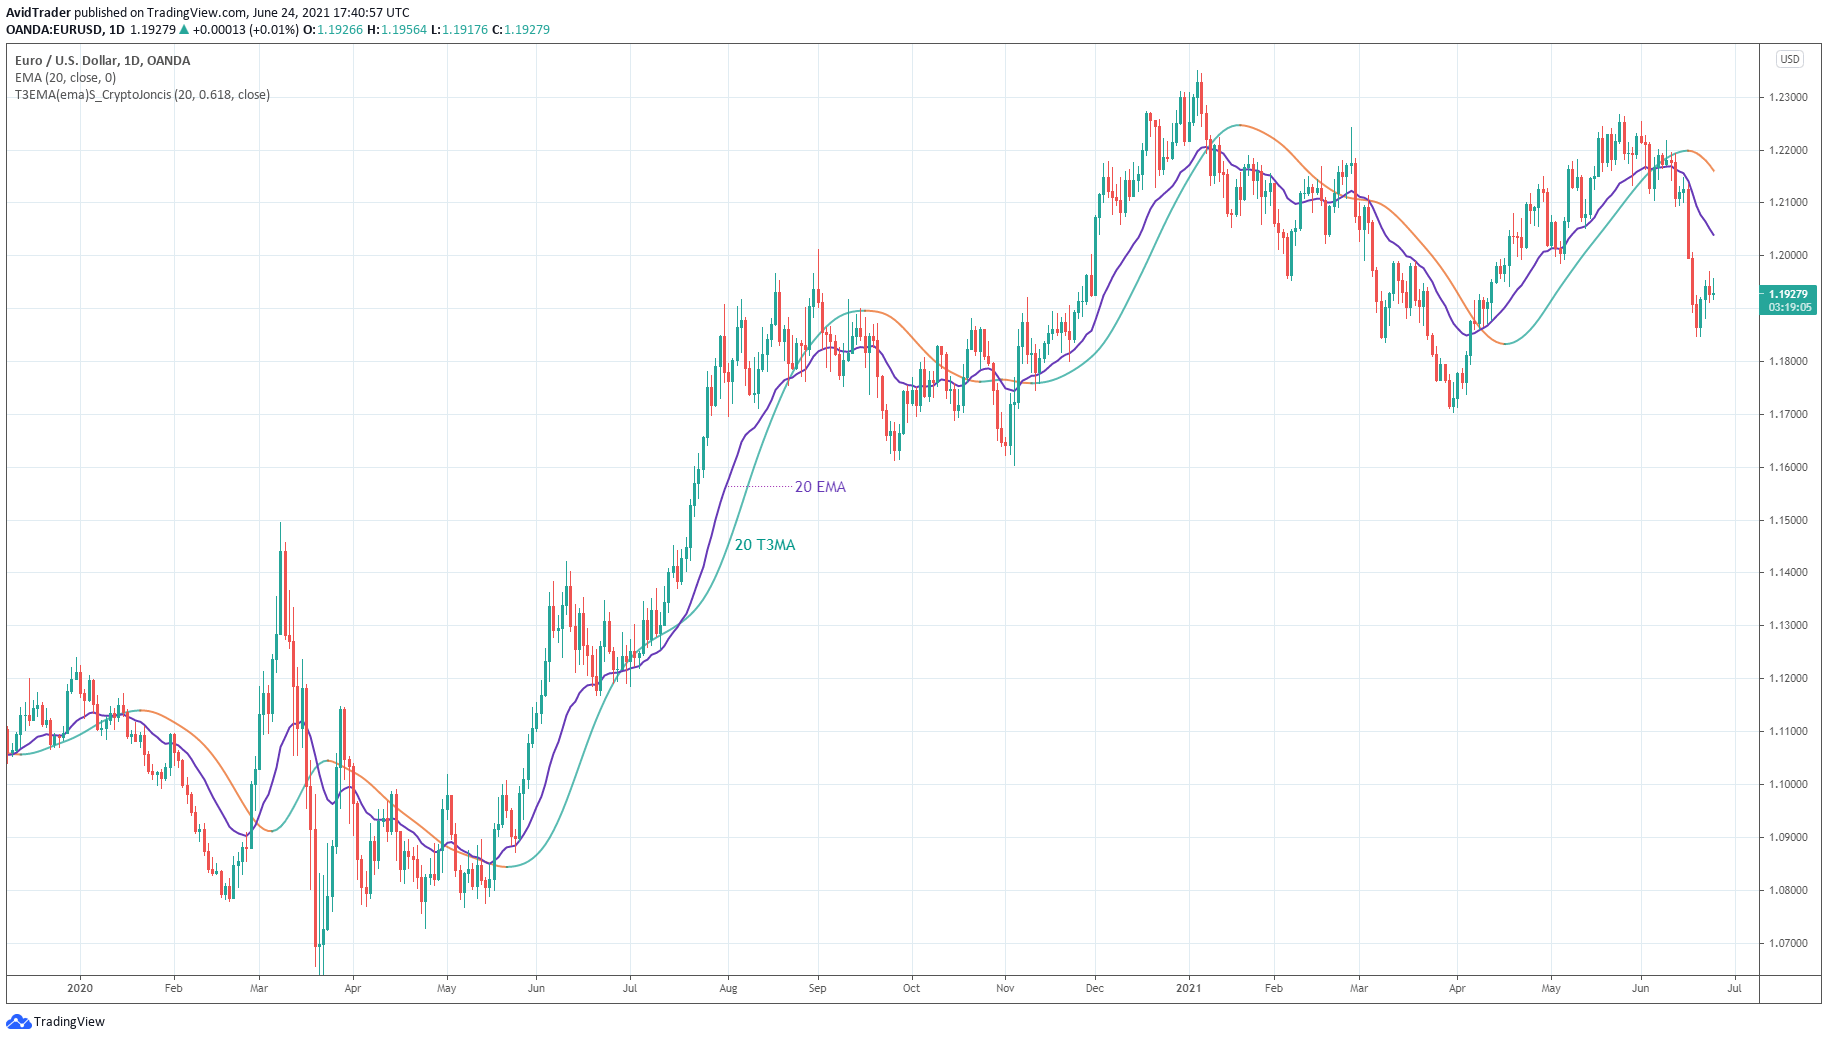
Consider the above EUR/USD daily chart.
- It shows 20 EMA and 20 T3MA.
- While it is not so obvious, 20 EMA changes slope far too many times than 20 T3MA does.
- Due to the color-coding, you can quickly tell and even count the number of times that T3MA changes direction.
- T3MA does not change the color that often.
How to trade with T3MA
You can employ T3MA as a trading tool in at least two ways.
- First, you can trade a pullback strategy using T3MA. Of course, it is better to confirm the trade with other tools. Here you would use T3MA as dynamic support and resistance. When the market is trending in any direction, T3MA will reflect this condition by sloping upward or downward. Every time the price touches T3MA, you can either buy or sell when it makes contact. This is the simplest way to trade T3MA.
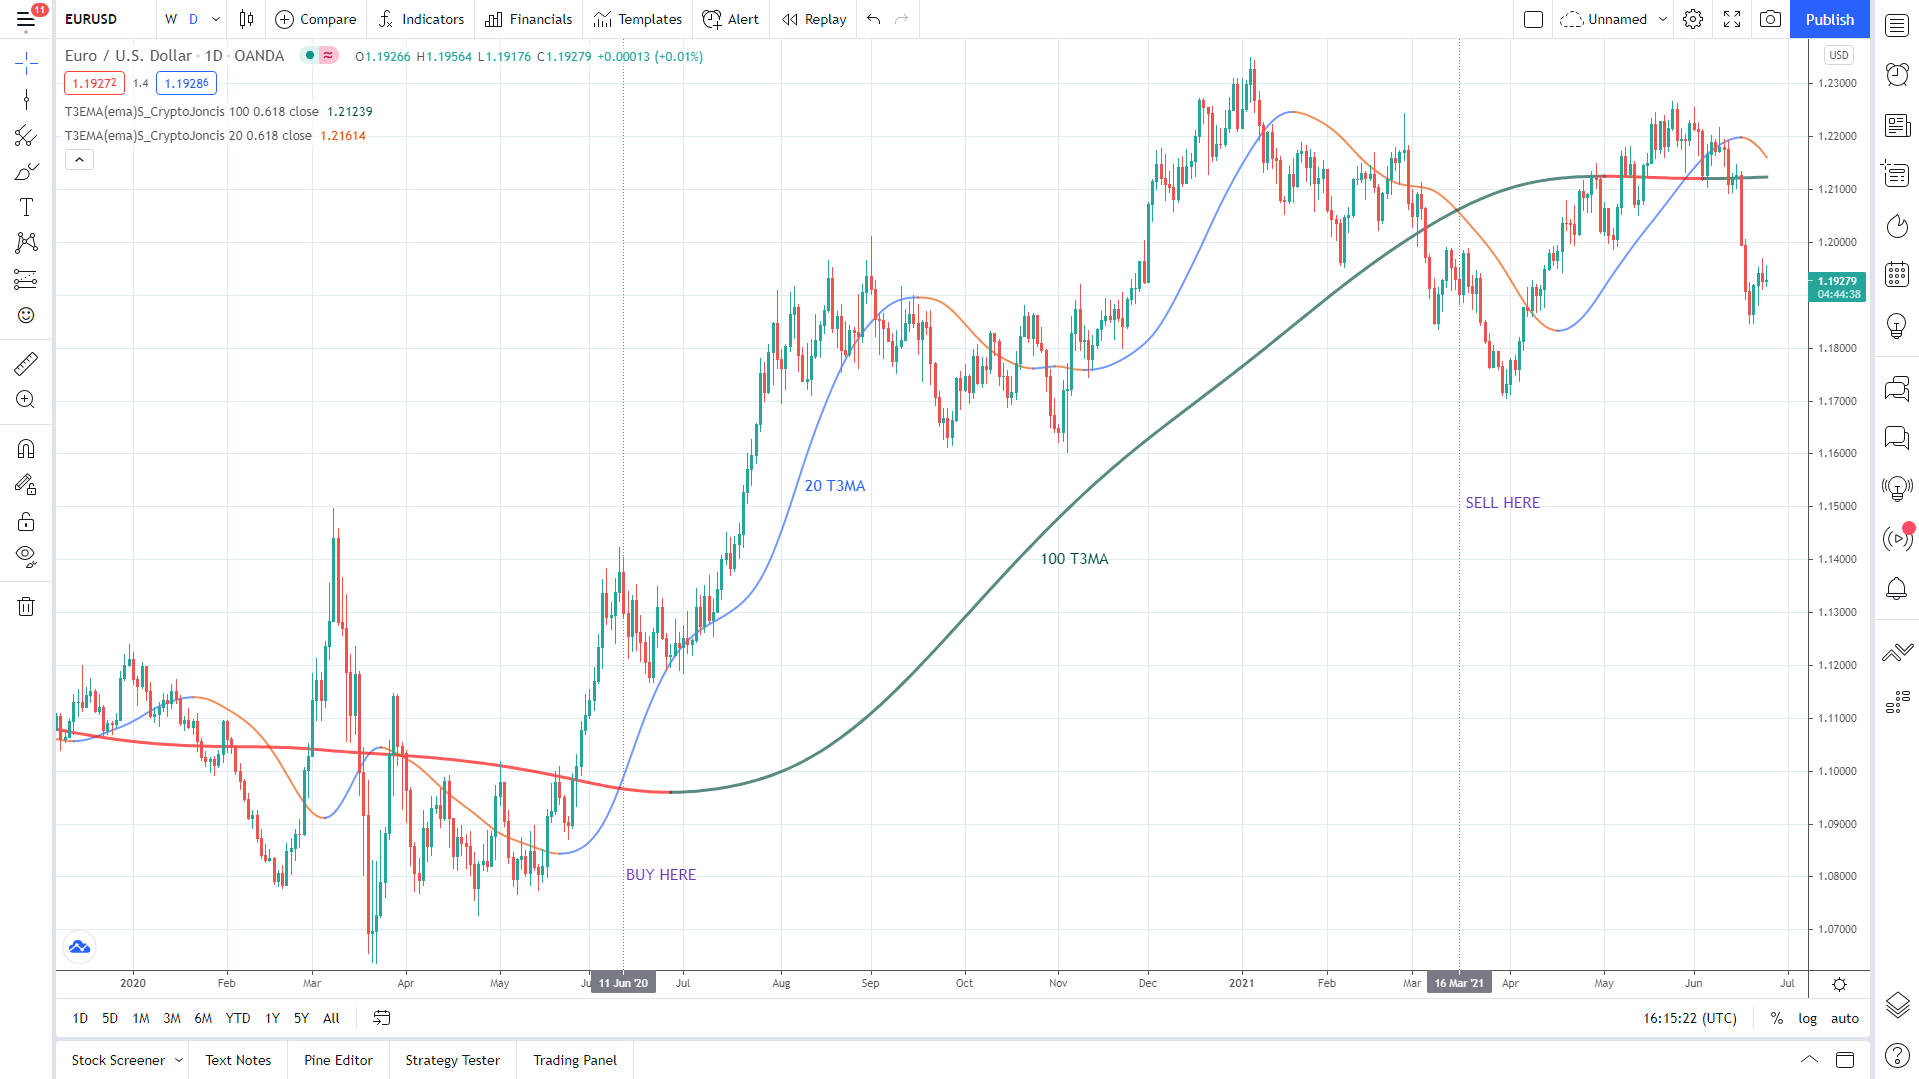
- The second way to trade T3MA is through a crossover. Here you will need two T3MA indicators with different periods. Consider the above EUR/USD daily chart. You can see 20 T3MA and 100 T3MA plotted on the chart. We have marked two points where we could have entered trades using the crossover strategy.
The first entry is a buy trade on 11 June 2020. The second entry is a sell trade on 16 March 2021. While the second trade was probably a loss, the profit in the first trade compensates for this loss, resulting in positive overall profit.
Final thoughts
T3MA is probably the MA with the smoothest curve. Try comparing this MA to other alternatives such as exponential, simple, linear weighted, smoothed, hull, Arnaud Legoux, and others. You will realize that this claim is indeed valid. Because of this, many traders are starting to incorporate T3MA into their systems. Try it yourself and see if it makes sense.


Comments