SMA or simple moving average is a technical trading indicator showing what average traders are doing in a specific time frame. It helps consider taking trades where most market participants have built their position.
On the other hand, the crypto market is very volatile, where a massive 50% price change in a day is pervasive. In that case, investors wonder whether the traditional SMA will work in the crypto market or not.
Although the crypto market is a decentralized marketplace, it follows the basic rules of supply-demand. Therefore, using and implementing technical indicators like SMA is effective and more profitable than the traditional market. The following section will see the complete SMA trading guide, including buy and sell examples.
What is SMA indicator?
The indicator shows the average price of the last number of candles.
- If you choose 30 SMA, it will show the average price of the last 30 candles.
- If you choose 200 SMA, it will show the average price of the last 200 candles using the following formula.
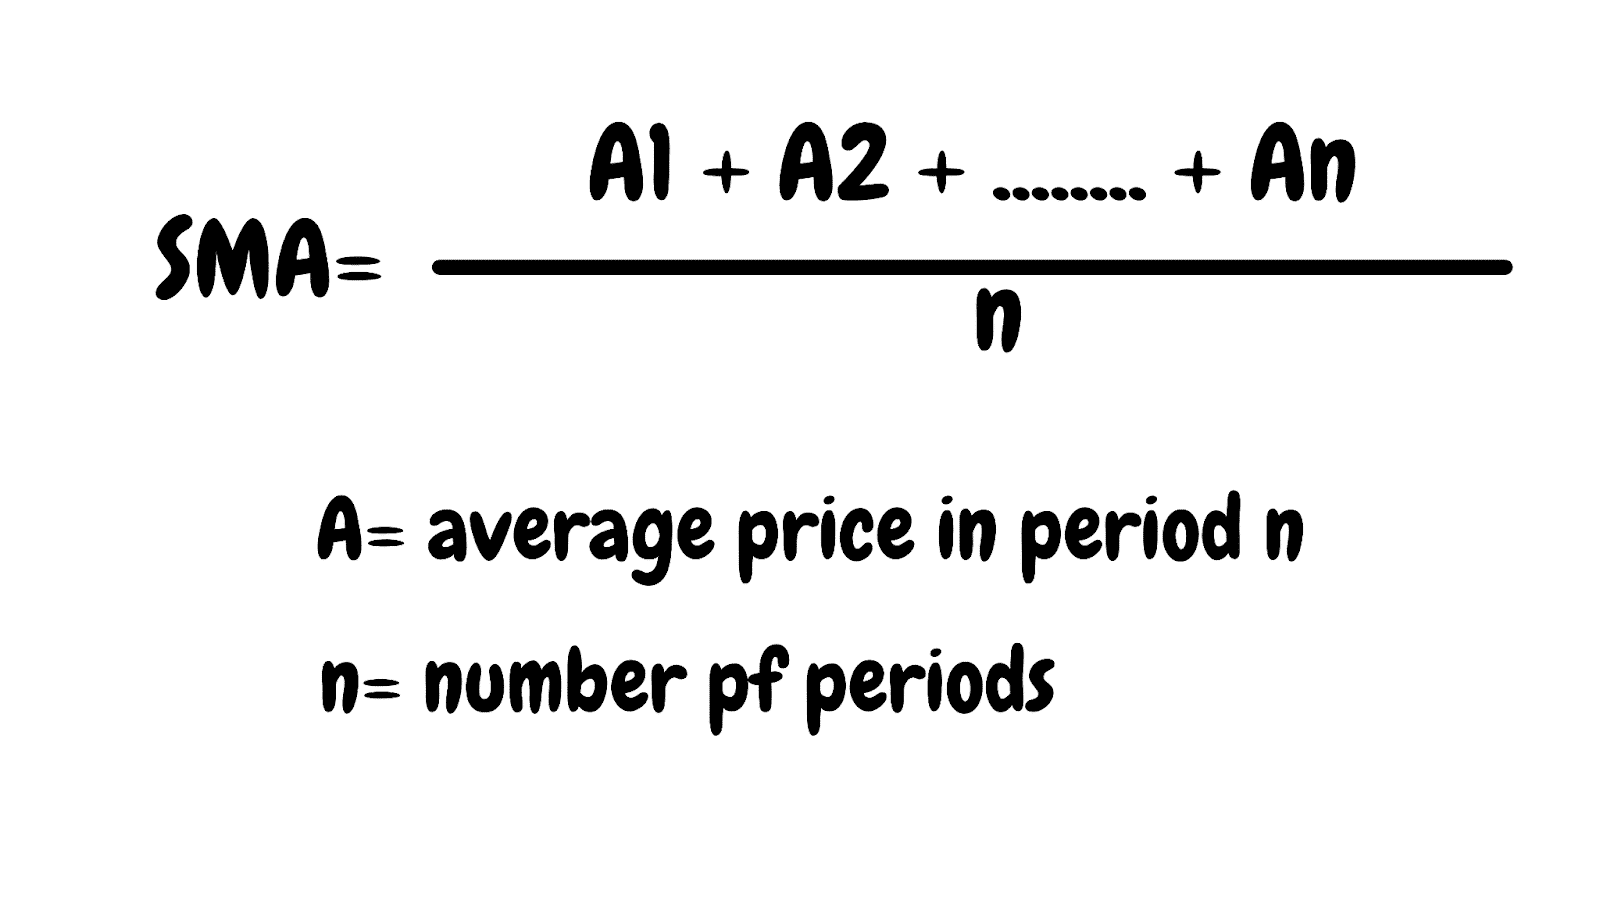
SMA formula
In SMA trading, the number of periods is controllable by traders. Therefore, traders should know the numbers like 20, 30, 50, or 200. Moreover, this indicator applies to any crypto token and time frame.
How to trade using SMA in trading strategy?
The main aim of using SMA is to find investors’ sentiment. We can distinguish the investors’ sentiment between short-term and long-term.
Short-term market sentiment
Using lower SMA value provides an idea about short-term traders’ activity in the price. Short-term traders usually don’t hold the trade in the long run. Day traders, scalpers, or swing traders are examples of short-term market sentiment.
For example, one of the widely used ideas is to use 20 EMA in the intraday chart to see the average price of the last 20 candles. It works as the dynamic support-resistance levels and helps traders find the confirmation.
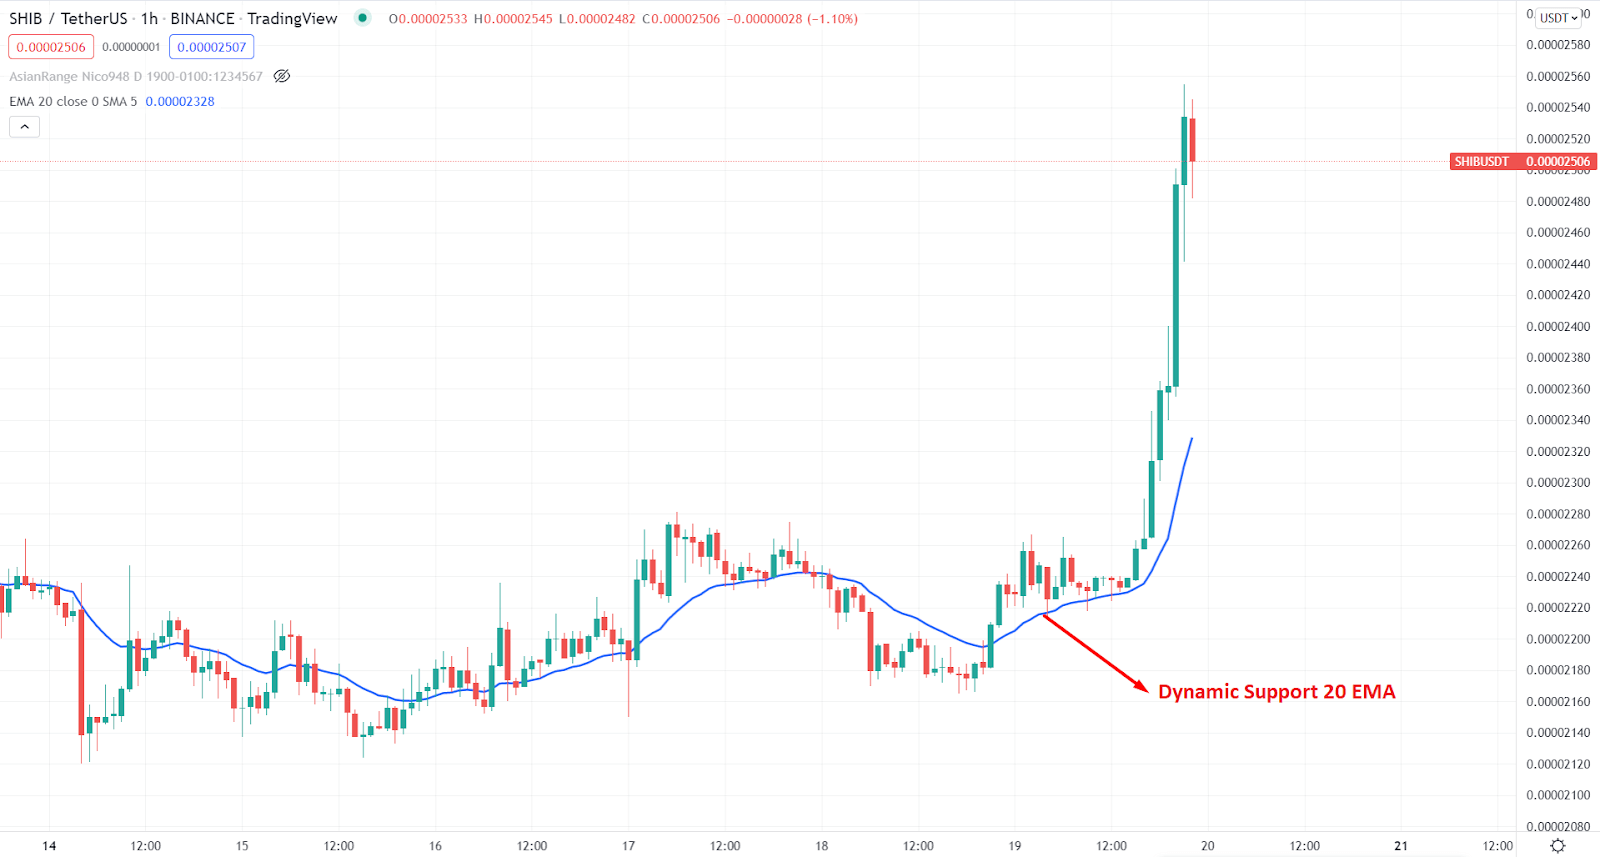
20 SMA in Shiba Inu chart
Long-term market sentiment
The long-term market sentiment comes from a higher MA number, usually SMA 100 or SMA 200. Moreover, SMA offers better results in long-term sentiment reading as it shows the market context with the pure average number of traders.
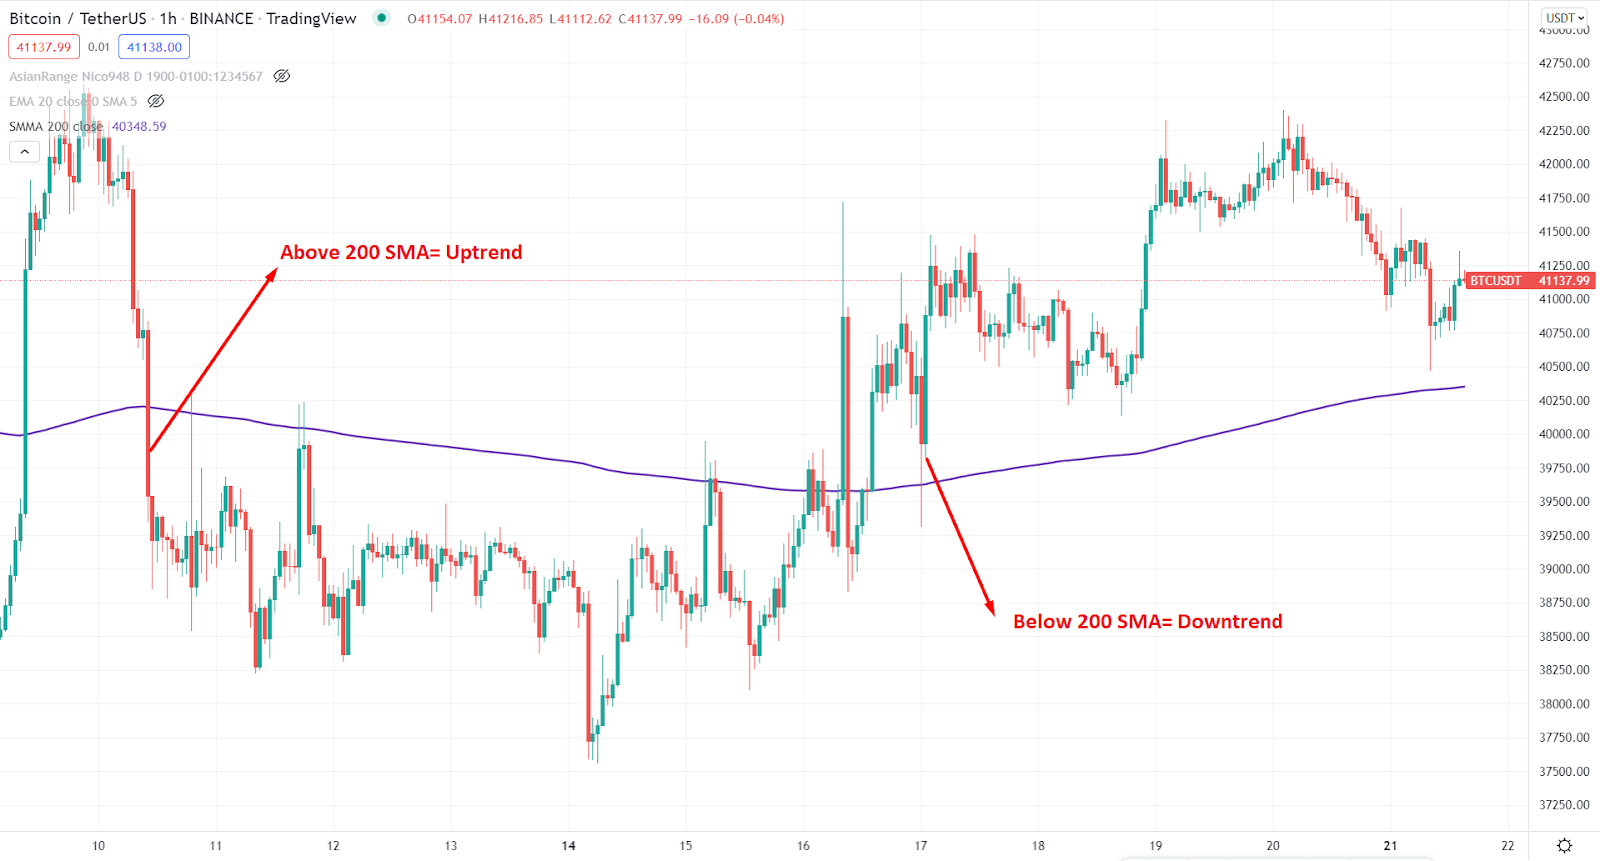
Long-term price sentiment
A short-term trading strategy
This method is an intraday approach to find the price direction of a crypto asset, which use multiple SMA values besides MACD to get a clear direction about the intraday price.
However, the crypto market is volatile, where trades should find stable crypto in the short-term method. In that case, using large-cap cryptos like Bitcoin, Ethereum, etc., is more stable.
Bullish trade scenario
Let’s see how to take buy trade using SMA’s beside the MACD. When all indicators show the buy signal, we will consider the trend stable.
Entry
Before opening a buy trade, make sure to find those conditions in the chart:
- 50 SMA is above the 200 SMA, indicating that short-term traders are more bullish than long-term bulls.
- The price shows a bullish candle above the dynamic 50 SMA, suggesting that short-term bulls are ready to take the price up.
- MACD histogram is above the neutral level.
Stop-loss
The aggressive stop loss is below the bullish rejection candle from where the entry becomes valid. However, the conservative approach holds the trade until it breaks below the near-term swing low.
Take profit
The primary aim is to close the 50% position after reaching the 1:1, but traders can hold it if the bullish pressure from the entry-level is impulsive.
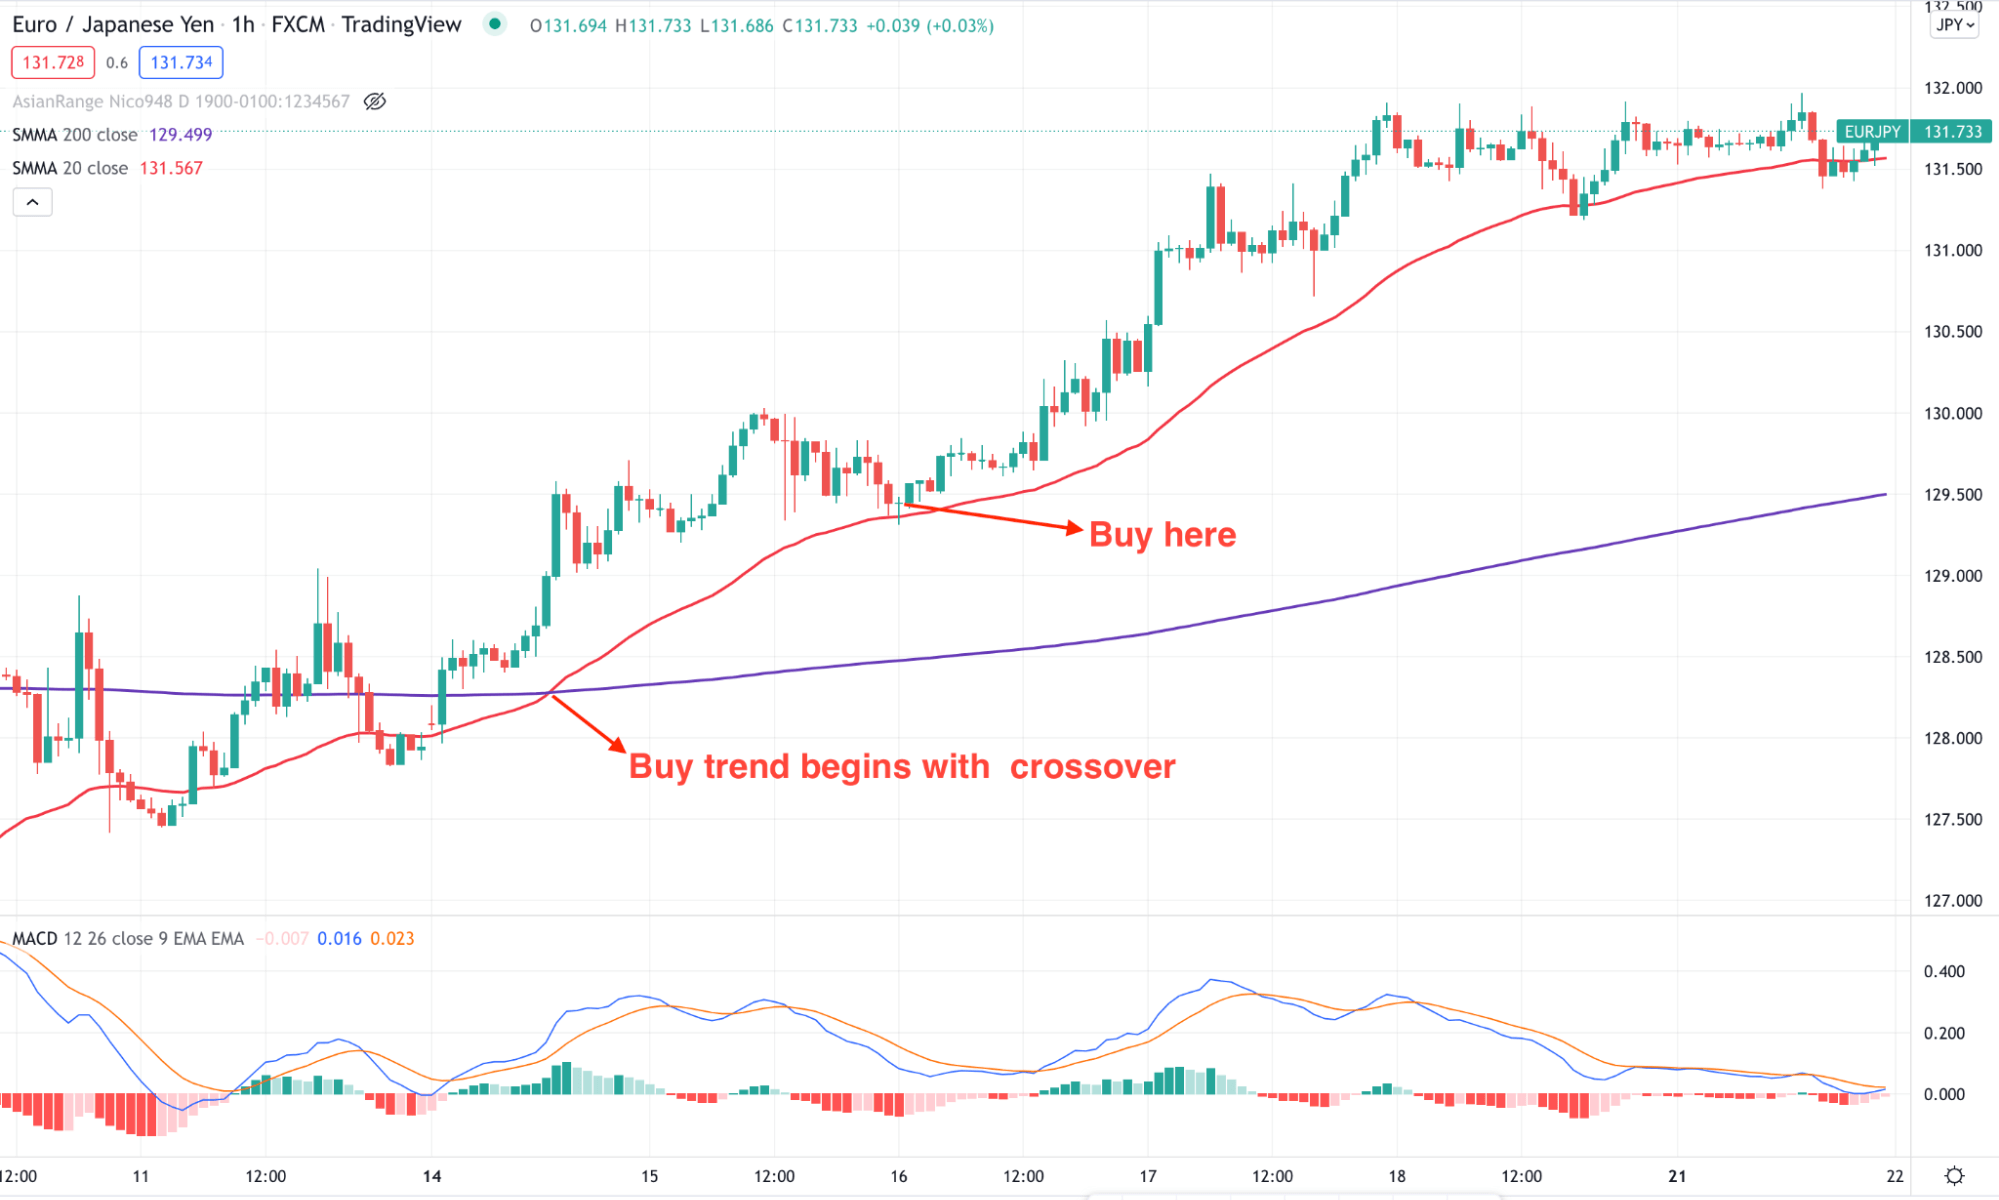
Bullish trade example
Bearish trade scenario
It is just the opposite version of the trade in the above example. However, selling crypto is not possible in the spot chart, but you can buy and sell any assets in CFDs.
Entry
Before opening a buy trade, make sure to find those conditions in the chart:
- 50 SMA is below the 200 SMA, indicating that short-term traders are more bearish than long-term bears.
- The price shows a bearish candle below the dynamic 50 SMA, suggesting that short-term bears are ready to decrease the price.
- MACD histogram is below the neutral level.
Stop-loss
The aggressive stop loss is above the bearish rejection candle from where the entry becomes valid. However, the conservative approach holds the trade until it breaks above the near-term swing high.
Take profit
The primary aim is to close the 50% position after reaching the 1:1, but traders can hold it if the selling pressure from the entry-level is impulsive.
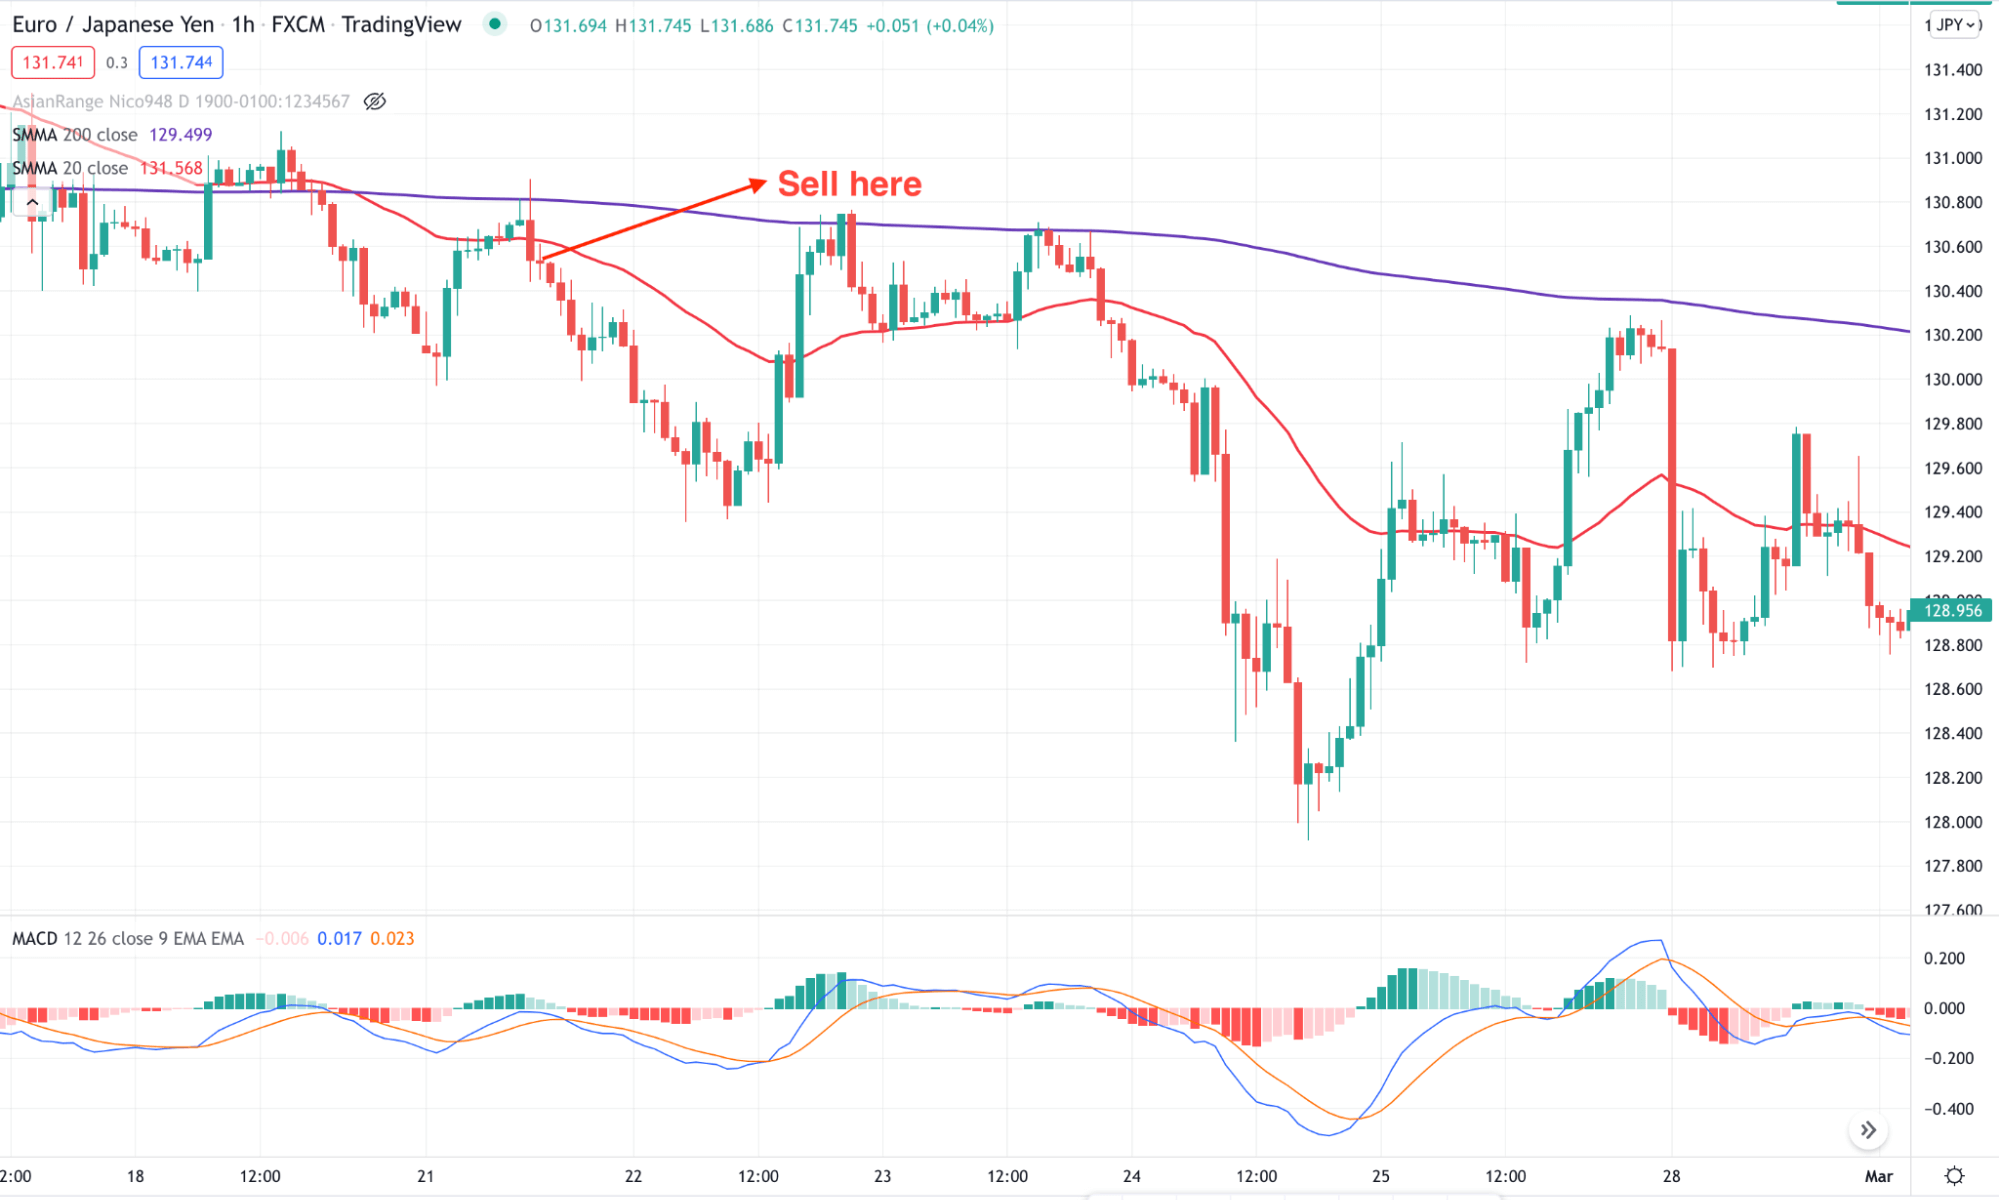
Bearish trade example
A long-term trading strategy
It applies to swing or position traders seeking a reliable price level from which HODLing will be profitable. In this method, we will use the golden cross and death cross method using the SMA 200 and EMA 50.
Bullish trade scenario
We will focus on the golden cross trading method in the buy trade. Moreover, using an additional indicator like MACD is better to eliminate the unwanted signals. In the buy trades, traders should closely monitor trading conditions. Once all requirements are present, the trade is valid.
Entry
Before considering any trade as a buy, find these steps in the chart:
- The price is above the 200 SMA.
- 50 EMA crosses over the 200 SMA, indicating that short-term traders have become more aggressive than long-term bulls.
- The price showed a bullish candle above the dynamic 50 EMA.
Stop-loss
The aggressive stop loss is below any relevant swing level from the 50 EMA. On the other hand, the conservative approach holds the trade until it breaks below the 200 SMA.
Take profit
You can close the total trade if it reaches any significant resistance level with a bearish rejection formation.
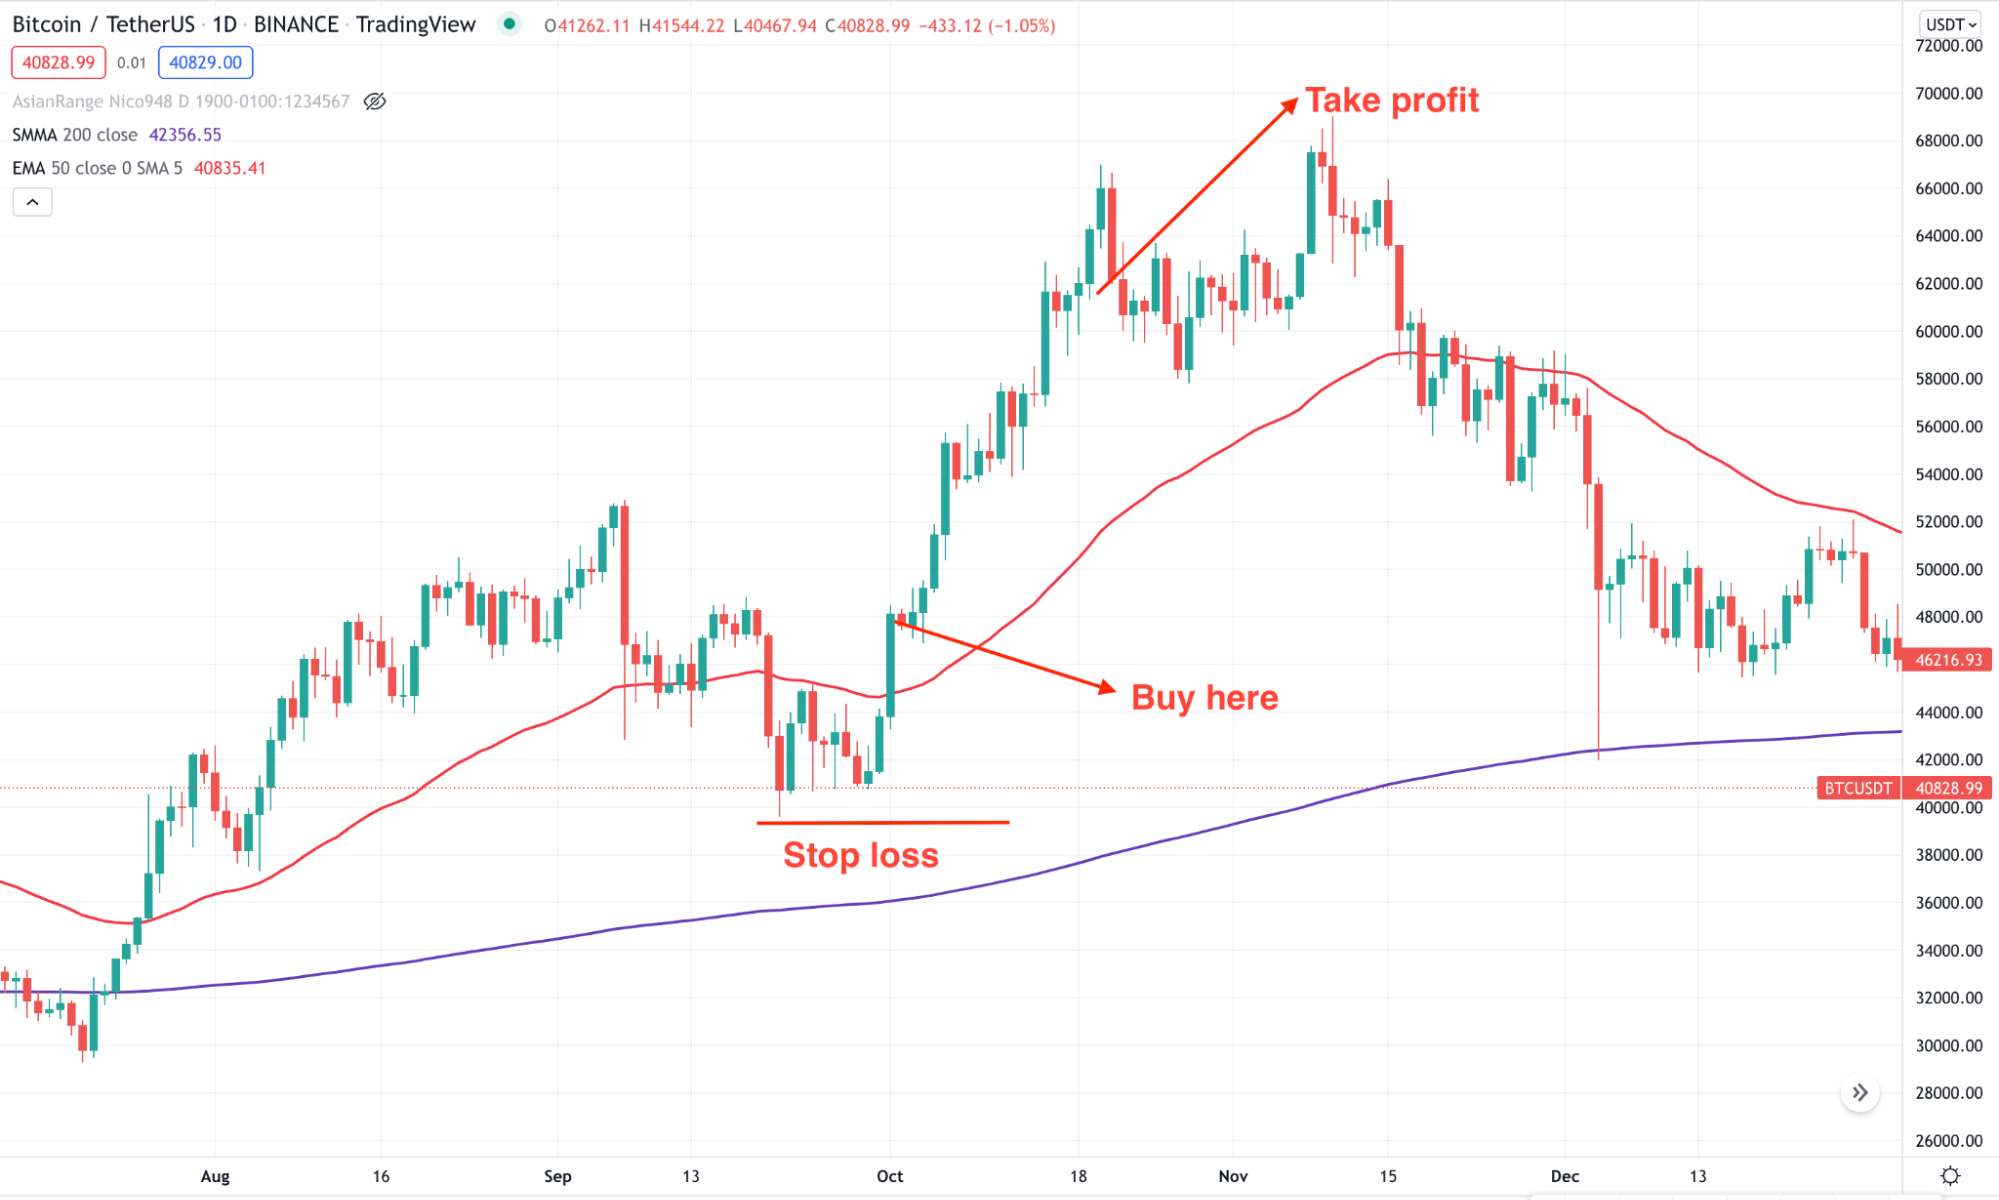
Long-term bullish example
Bearish trade scenario
The Death cross is the opposite version of the golden cross strategy where the 50 EMA moves below the 200 SMA.
Entry
Before considering any trade as a sell make sure to find these steps in the chart:
- The price is below the 200 SMA.
- 50 EMA crosses down the 200 SMA, indicating that short-term traders became more bearish.
- The price showed a bearish candle below the dynamic 50 EMA.
Stop loss
The aggressive stop loss is above any relevant swing level from the 50 EMA. On the other hand, the conservative approach holds the trade until it breaks above the 200 SMA.
Take profit
You can close the full trade if it reaches any significant support level with a bullish rejection formation.
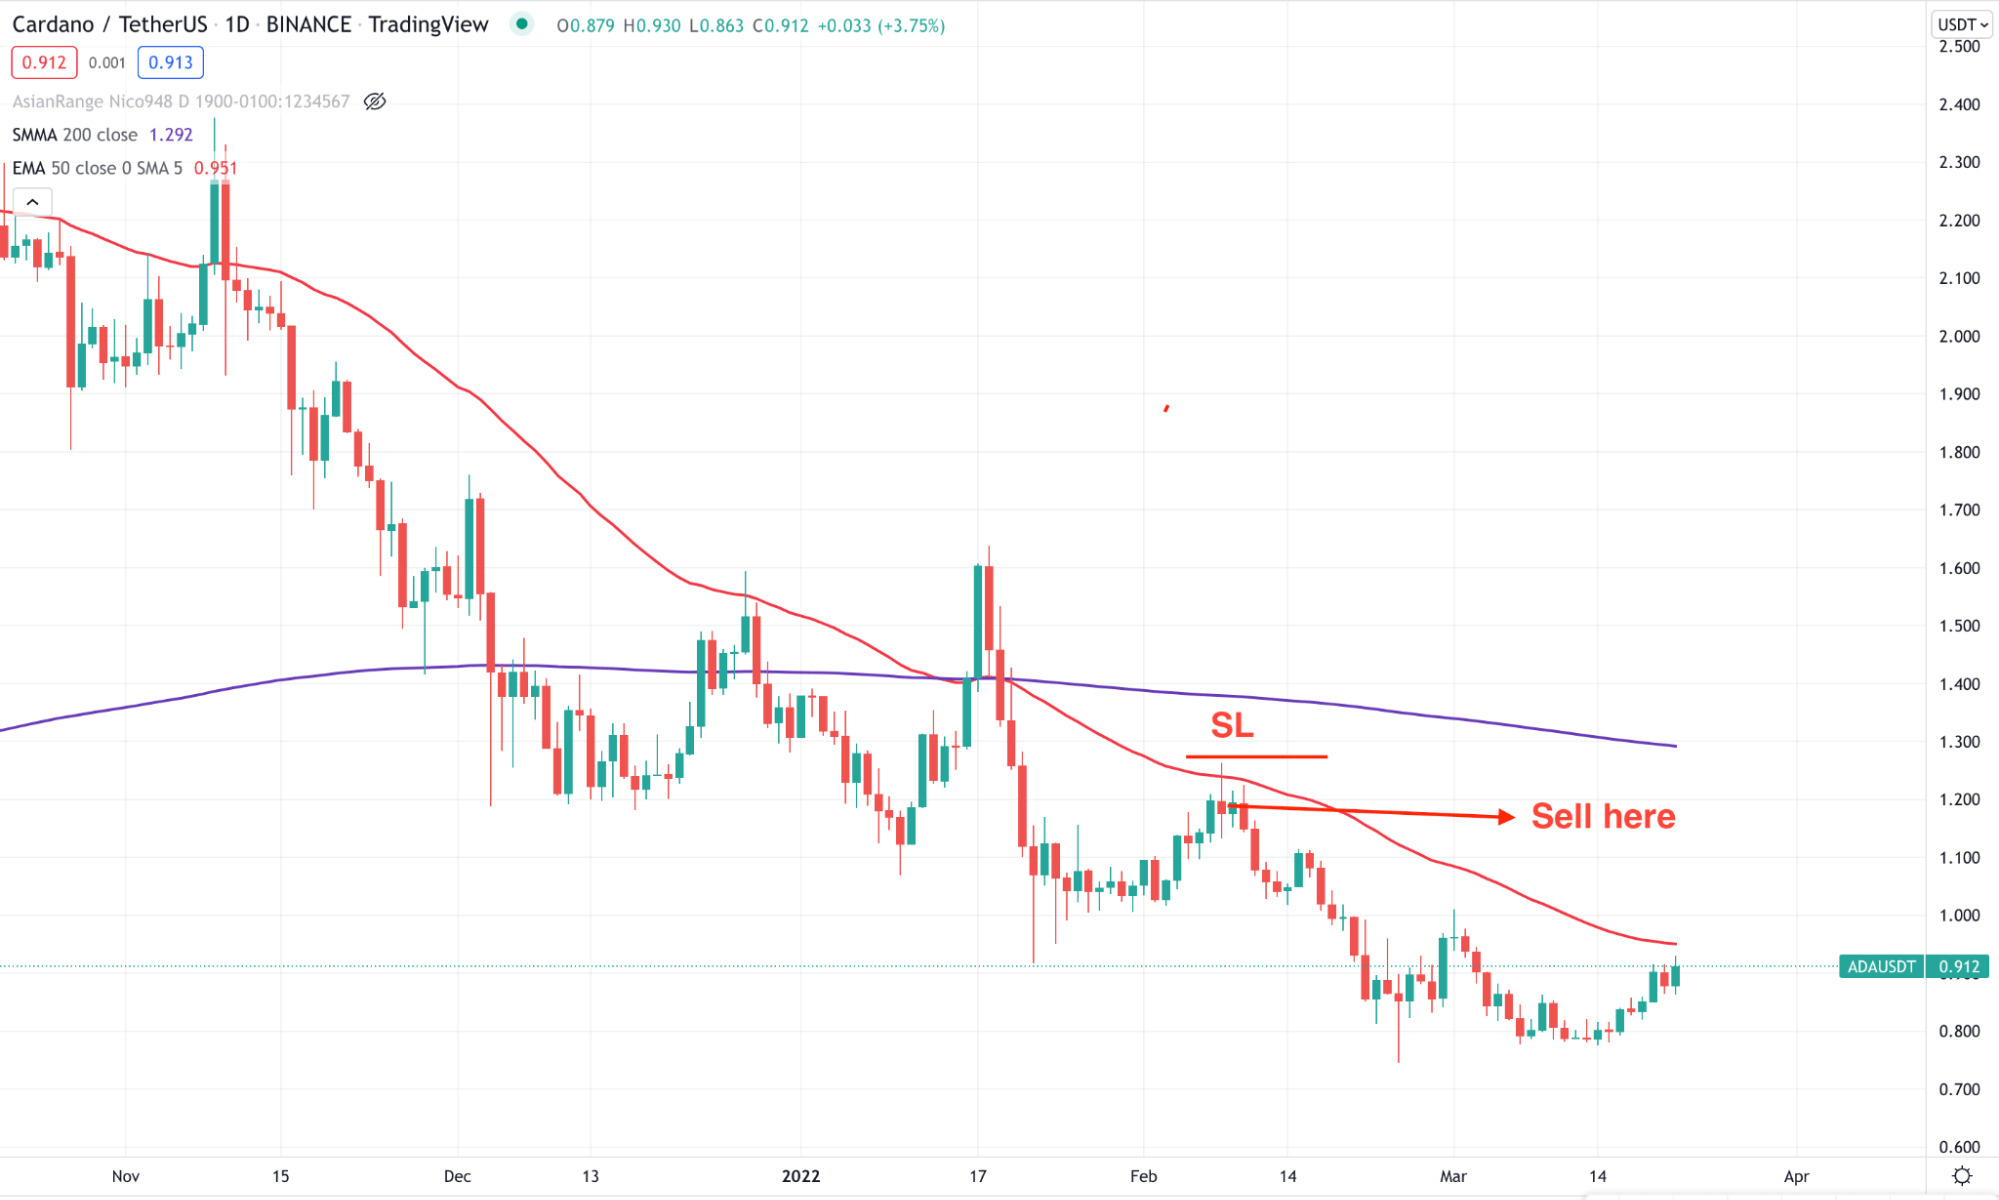
Long-term bearish example
Pros and cons
| 👍 Pros | 👎 Cons |
|
|
|
|
|
|
Final thoughts
SMA is the basic trading tool used by many professional traders and investors to get the overall price structure of a trading instrument. Moreover, this trading tool is easy to combine with other technical and fundamental indicators to understand the price behavior. This tool will allow traders to make better trading decisions and risk management.


Comments