
Candle formation is a vital factor in the financial market. Using candles to predict future movement and making trade decisions is typical among financial traders. The Rounding Top pattern is one of the most standard formations on any financial instrument chart. So professional traders always consider this pattern while seeking trading opportunities.
However, there are some identifying criteria to spot an ideal Rounding Top pattern. Moreover, it is worth learning the pattern formation and professional ways to use it for successful trade executions. This article will briefly discuss this figure besides sustainable trading methods using this candlestick formation.
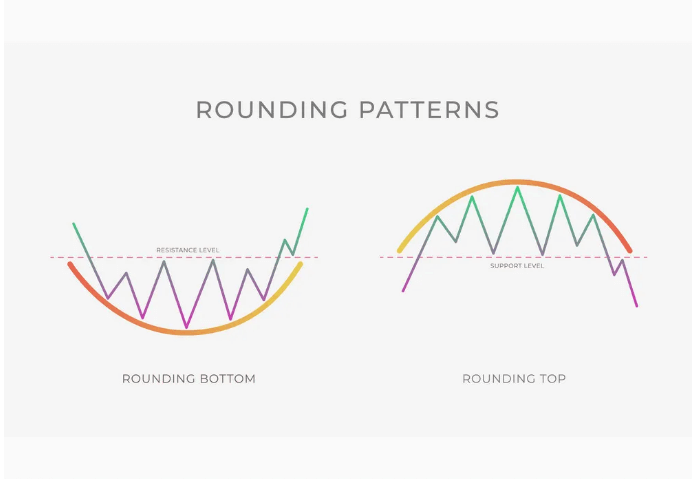
What is the Rounding Top pattern?
Multi-candle formation usually signals a possible upcoming reversal or a declining pressure on the asset price. This pattern looks similar to an inverted shape of the English letter “U,” which is most potent near any resistance level or after a considerable bullish price movement.
This pattern usually takes time to complete the entire shape, maybe several days, weeks, months, or even an entire year. An ideal form of this pattern has three components:
- A round shape or candle formation.
- A support level or neckline.
- An inverted volume will be high at both ends and lower in the middle.
Rounding pattern concepts
The Rounding Top has an exact opposite version; the Rounding Bottom pattern has a neckline that acts as resistance. When the series of price candles may fail to decline below the neckline of the Rounding Top pattern and start bouncing on the upside near the peak or the pattern or resistance level, it may create a Double Top or a Head & Shoulder.
How to use the Rounding Top pattern on trading strategy?
You already know this pattern is most potent when it takes place near any resistance level. The sharp rally declares buyers’ domination on the asset price. Meanwhile, during the pattern formation, the price remains sideways as the buys may lose interest in purchasing more and reducing the load of buy pressure.
So technical traders expect a declining pressure when the price falls below the neckline. The volume is a relative factor in recognizing this shape of price candles and determining the valid breakout. When the price breaks below the support, it declares an initiation of bearish momentum.
A short-term trading strategy
It is a straightforward trading method involving support resistance and the volume indicator to identify trading positions. We use different charts to mark many critical price movement levels such as historical, support resistance, weekly & months open/high/low/close, etc., using daily or weekly charts.
Then seek trading positions at a 15-min or hourly chart. We recommend entering trades during the London or Newyork sessions as volatility increases during these periods.
Bullish trade scenario
Draw those essential levels on upper timeframe charts and seek when:
- The price reaches near support levels and starts making a ‘U’ shape, and the neckline appears.
- The price comes to the neckline and respects it at least once.
- A breakout occurs, and the price reaches above the neckline.
- The volume indicator confirms an increasing buy pressure.
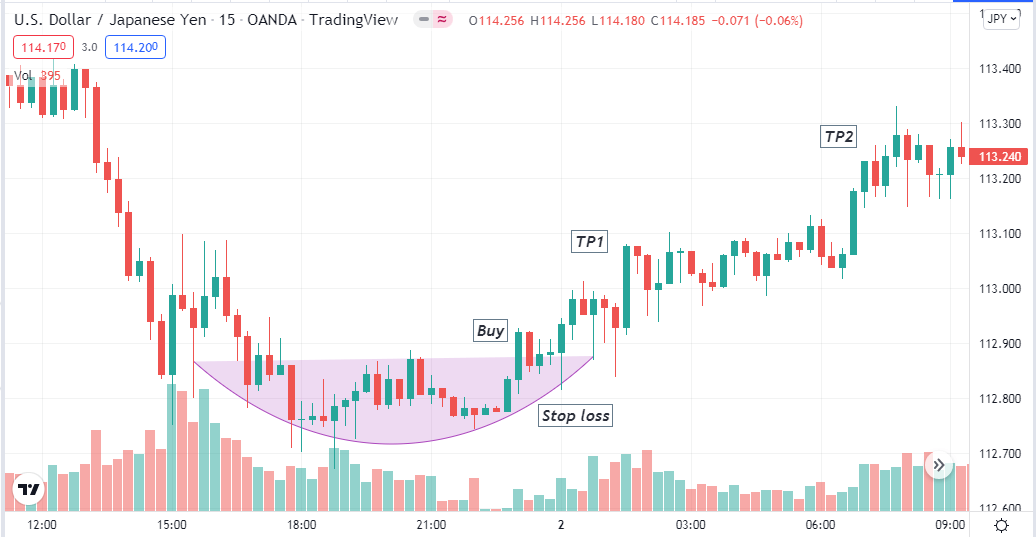
Bullish setup
Entry
These conditions above indicate that the price may be entering a bullish trend. Open a buy position here.
Stop loss
The initial stop loss level will be below the last swing low with a buffer of 5-10pips.
Take profit
The initial profit target will be above the exact distance between the pattern’s low and neckline level distance. You can continue the buy order if the price keeps falling. In that case, close the buy order when the price reaches the next resistance level or the volume indicator declares an increasing sell pressure on the asset price.
Bearish trade scenario
Draw those essential levels on upper timeframe charts and seek when:
- The price reaches near resistance and starts making an inverted ‘U’ shape and drawing the neckline.
- The price comes to the neckline and respects it at least once.
- A breakout occurs, and the price reaches below the neckline.
- The volume indicator confirms an increasing declining pressure.
Bearish setup
Entry
These conditions above indicate that the price may be entering a bearish trend. Open a sell position here.
Stop loss
The initial stop loss level will be above the last swing high with a buffer of 5-10pips.
Take profit
The initial profit target will be below the exact distance between the peak and the support level distance of the pattern. You can continue the sell order if the price keeps falling. In that case, close the sell order when the price reaches the next support level or the volume indicator declares an increasing buy pressure on the asset price.
A long-term trading strategy
This method involves two trading indicators alongside the specific candlestick pattern. It includes using the ADX and the Parabolic SAR; these indicators’ breakout and trend continuation confirmation. That helps traders to consume maximum profits. In most cases, the rounding top pattern generates trades with a risk-reward ratio of 1:1.
Following this method, you can achieve profits with a risk-reward of 1:2 or above as the pattern occurs in price reversal areas, so the price often continues more than the pattern formation range. Applying this method on an H4 or above chart will increase your probability of participating in more potent long-term trades.
Bullish trade scenario
When seeking buying opportunities, spot a Rounding Bottom pattern and wait for the breakout above. Observe the indicators when:
- Parabolic dots are making series below price candles.
- The ADX value increases above 20.
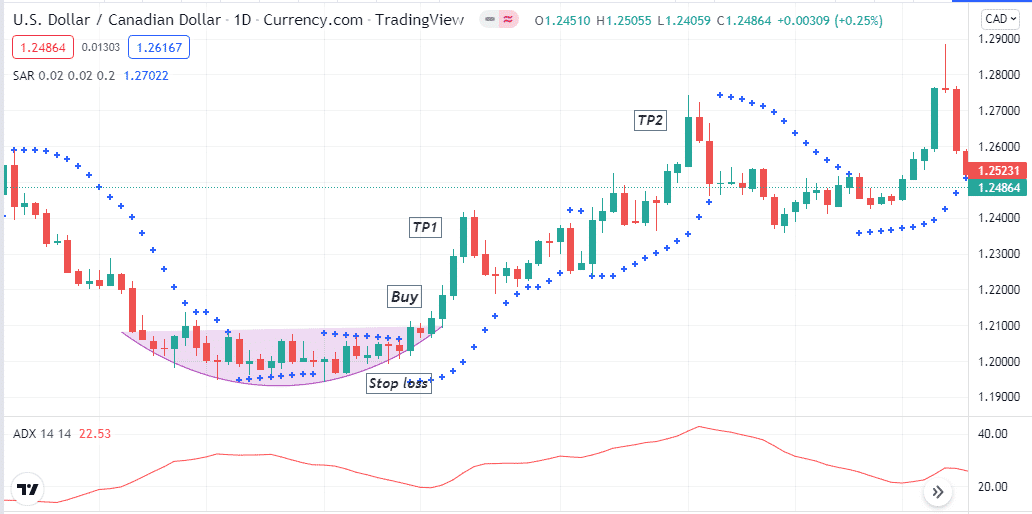
Bullish setup
Entry
When the breakout above happens, match these conditions above and open a buy order.
Stop loss
Place a reasonable stop loss below the recent swing low level.
Take profit
The initial profit target should be above the pattern range. You can continue the buy order until employing indicators detects an opposite momentum.
- The parabolic dots switch above price candles.
- The ADX reading drops below 20.
Bearish trade scenario
When opening sell trades, spot a Rounding Top pattern and wait for the breakout below. Observe the indicators when:
- Parabolic dots are making series above price candles.
- The ADX value increases above 20.
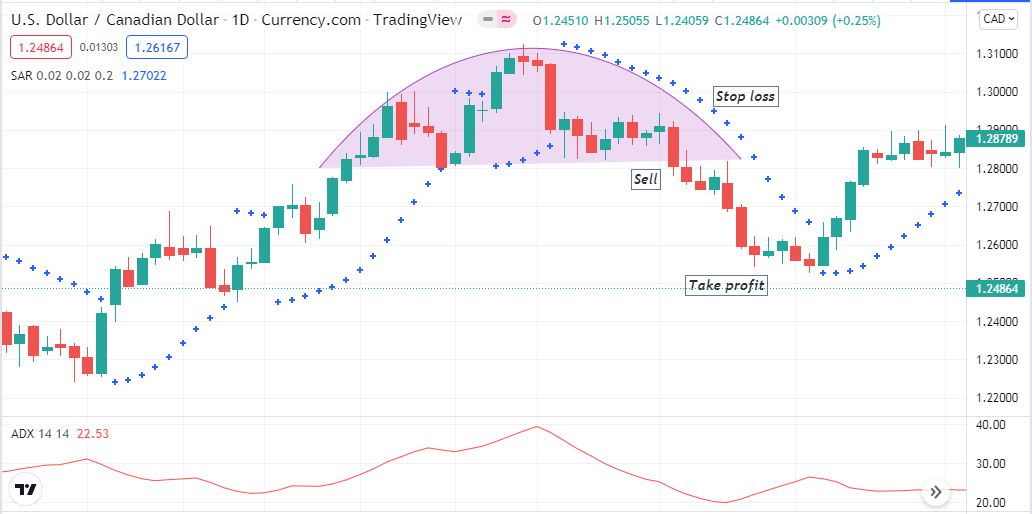
Bearish setup
Entry
When the breakout below happens, match these conditions above and open a sell order.
Stop loss
Place a reasonable stop loss above the recent swing high level.
Take profit
The initial profit target should be above the pattern range. You can continue the sell order until employing indicators detects an opposite momentum.
- The parabolic dots switch below price candles.
- The ADX reading drops below 20.
Pros and cons
| 👍 Pros | 👎 Cons |
|
|
|
|
|
|
Final thought
The Rounding Top or Bottom patterns are among the list of most influential figures. When you can mark the pattern correctly, it will increase your profitability. Additionally, don’t force the pattern; wait till a good appearance.


Comments