
Keltner channel trading strategy, also known as Keltner bands strategy, is a full segment for technical traders. Hence, having the skill to use this strategy correctly is beneficial. And, the key to projecting a successful Kelter method is based on market adherence and the asset’s price action.
It is an indicator used in technical analysis. It creates a dynamic channel throughout the price range of an instrument. Besides, the dynamic channel is created by using one lower and one upper band. The envelope indicators can identify the upper resistance and lower support level no matter how the asset is trading.
What is the Keltner channel?
It shows the price volatility and characteristics of a trend. It also works as the help for identifying the trend direction. This indicator consists of three individual lines or bands. The middle band is an EMA of the price. The two extra lines took place on top and the bottom of the EMA or the third line.
Generally, the upper line is set 2 times the ATR on top of the EMA. Similarly, the lower line is set 2 times the ATR under the EMA. If the volatility increases and contracts, the lines or bands increase and contract.
A trend shift or stimulation signal is indicated if the upper and lower line goes outside the channel because the upper and lower lines surround the maximum price action. The movement of the channel also acts as a backup in terms of defining the asset’s trend direction.
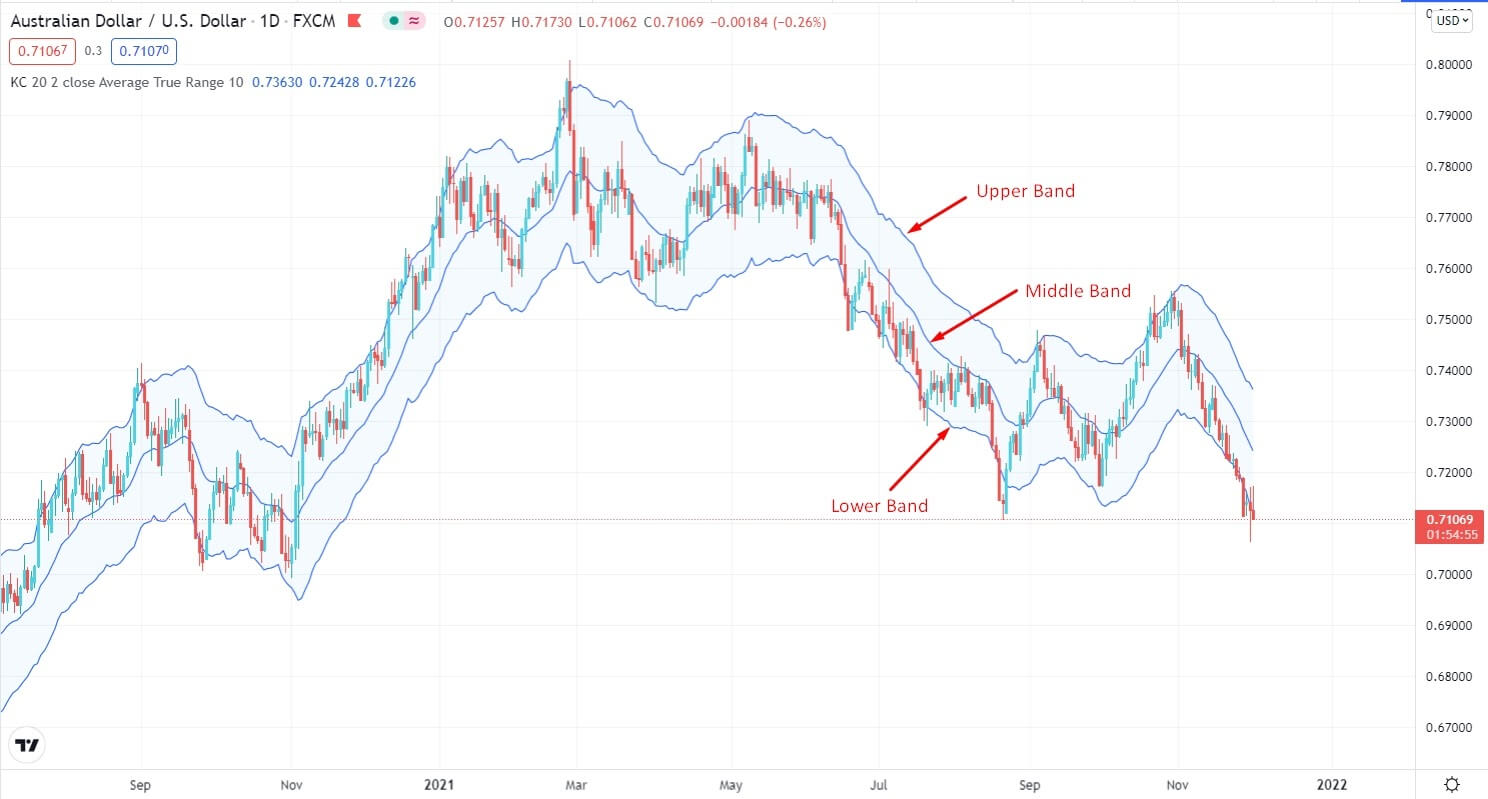
Keltner channel on chart
How to use in trading strategy?
The indicator is a conjunction of EMA and ATR. The Keltner channel bands the trends with powerful movements as waves in both directions up to the upper line.
- The upper line signals the unfamiliar strength
- The lower line depicts unexpected weakness
Also, these kinds of robust movements normally indicate that one trend ends with the starting of another trend. However, sometimes prices reside only in the channel lines because, after a channel breakout, strong trends do not grab hold.
The tool can depict the areas in which a trader will be inclined to open positions for buying and selling in trading. Mainly, traders open a buy position if the asset’s price goes higher towards the channel’s lower line after dipping.
On the contrary, traders open sell positions after the price of the asset breaks along the upper line yet begin to drop back to the channel. Traders must remember that since the price has collapsed or climbed outside the lower and upper line, it does not indicate that it will always continue.
A short-term trading strategy
Once the Keltner trading indicator is set up on your chart properly, the simple method is to open a trade when the price retrace to the middle line. This trading method is mainly built to ride a trend using short pullbacks. It is a very profitable trading method that many professional market participants use.
This short-term trading method takes advantage of the trending bias and gives signals with a probable 1:3 risk-reward ratio. However, all retracements to the middle line should not be traded. Look for the price that created a strong bullish candle after a retracement for confirmation. Furthermore, we are trading based on a 15 minutes chart to provide higher confirmations.
Bullish trade setup
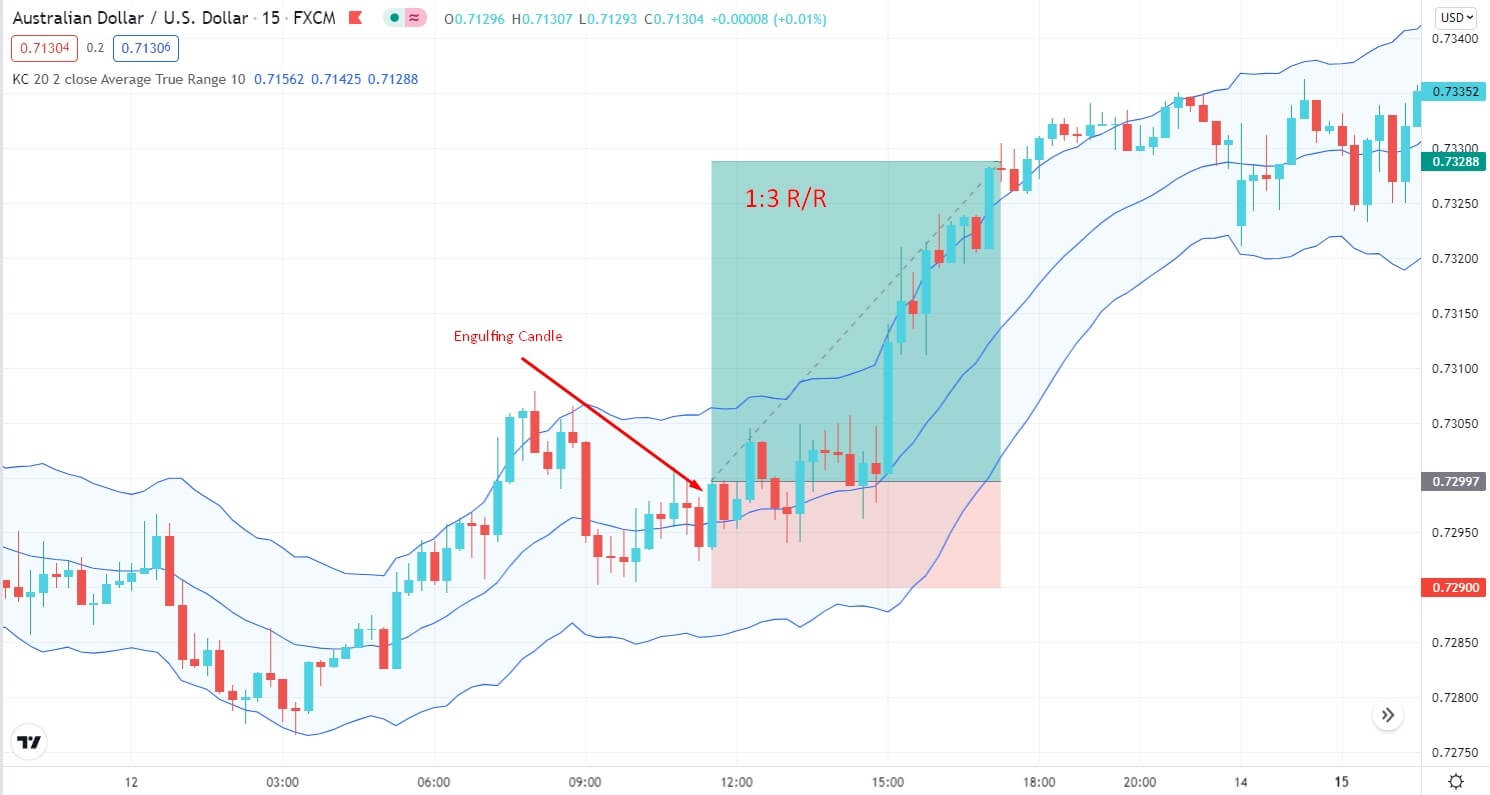
Bullish short-term strategy
Entry
Buy when the price pullbacks towards the middle band after an impulsive bullish move.
Stop loss
Place the order below the bullish closing candle with a 4-5 pips buffer.
Take profit
Take the profit when the price reaches the upper band. Or else, you can target at least a 1:3 risk/reward ratio.
Bearish trade setup
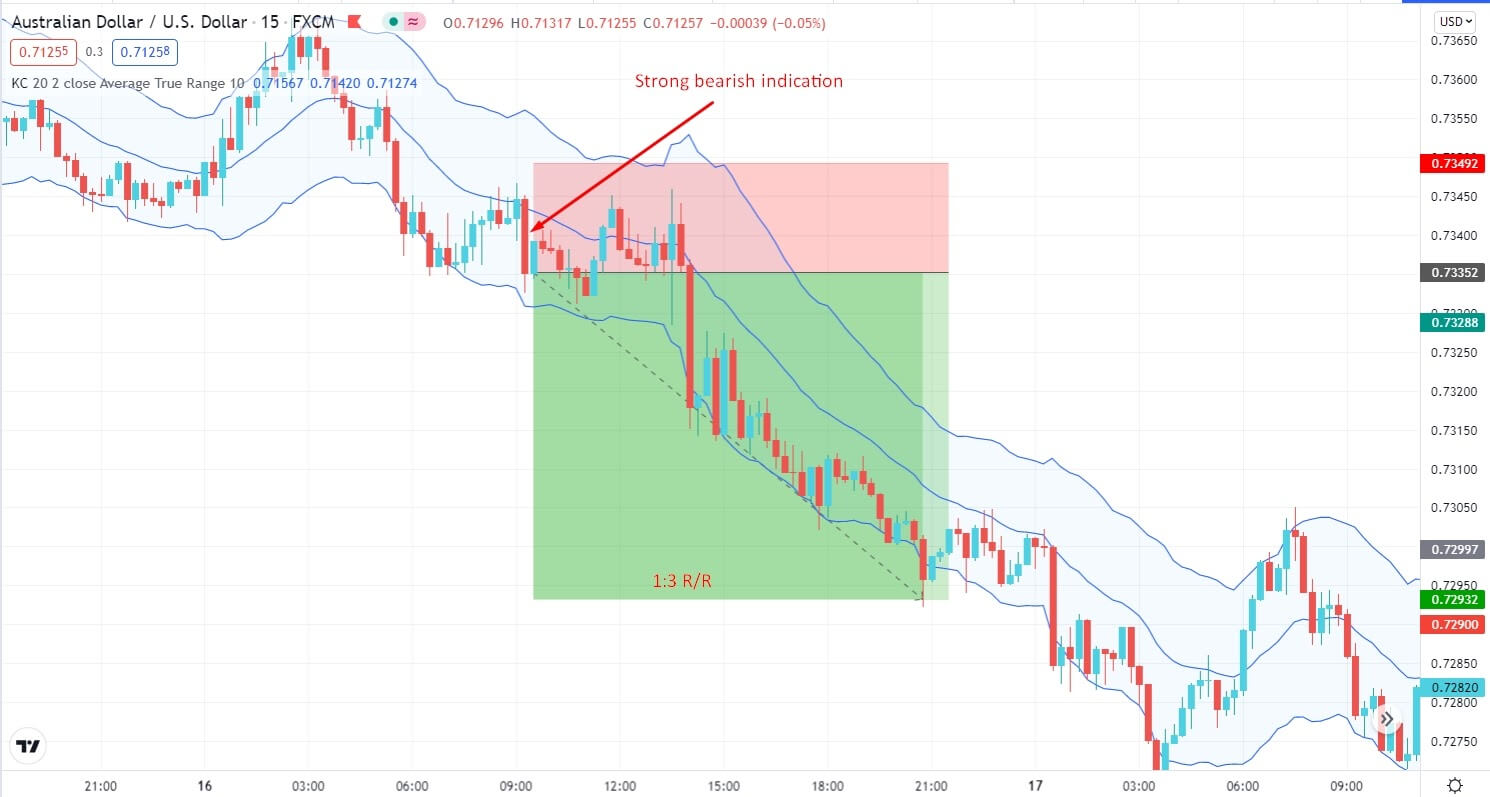
Bearish short-term strategy
Entry
Sell when the price pulls back towards the middle band after an impulsive bearish move.
Stop loss
Place the above the bearish closing candle with a 4-5 pips buffer.
Take profit
Take the profit when the price reaches the lower band. Or else, you can target at least a 1:3 risk/reward ratio.
A long-term trading strategy
Long-term trading using the indicator is highly accurate, and it provides the best outcomes in the long run. This long-term trading method is built based on divergence. We will only look for trades if the price has created a bullish divergence or a bearish divergence. Moreover, we are also using the MACD indicator and the Keltner channel to identify divergence in the market.
Bullish trade setup
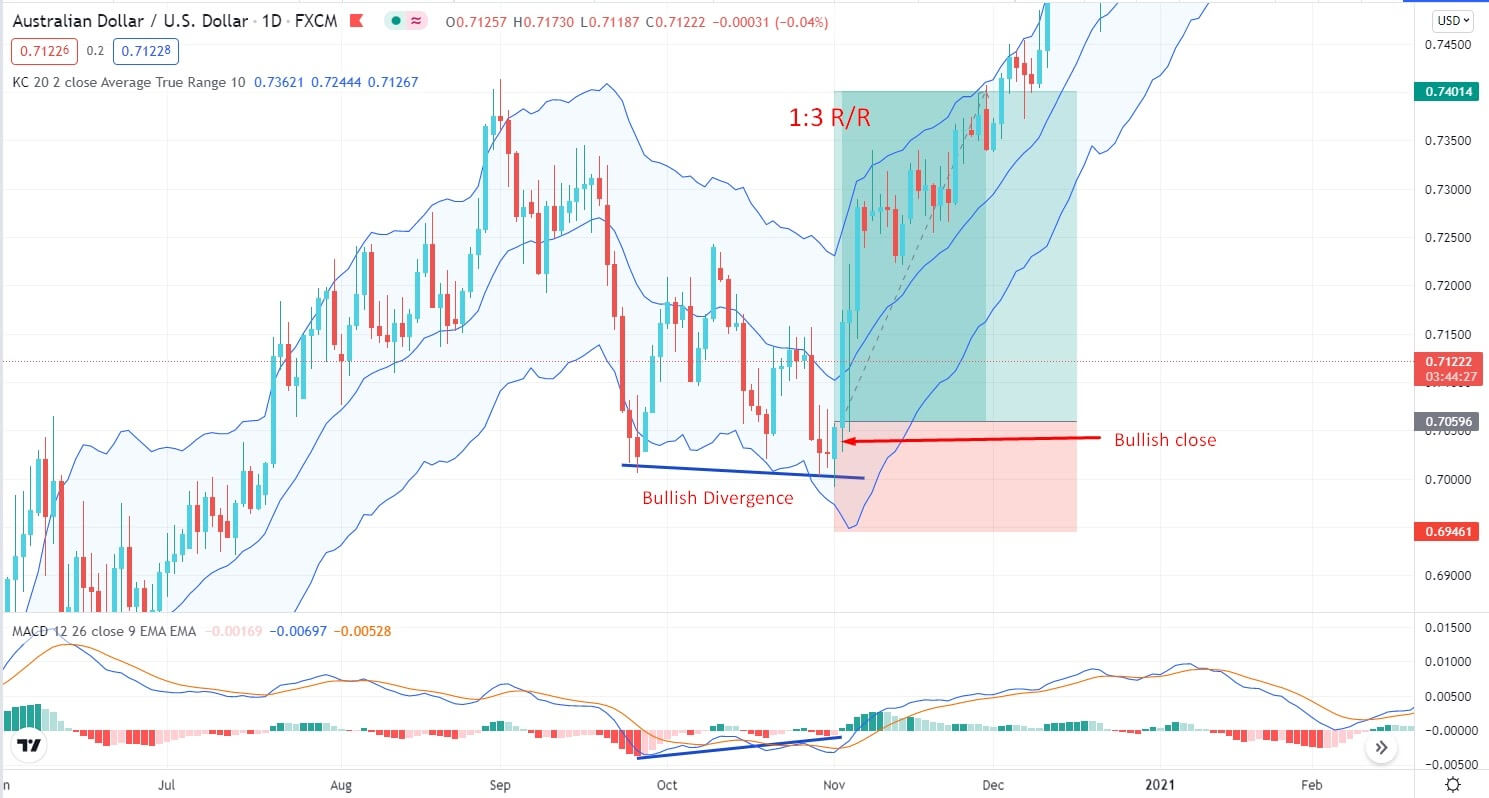
Bullish long-term strategy
Entry
Look for a buy entry when the price had a daily bullish candle close above the lower band after creating a bullish divergence.
Stop loss
Your order should be placed below the lower band with a 10-15 pips buffer.
Take profit
Take the profit by target 1:3 risk/reward ratio. Otherwise, you can take the profit when the price touches the upper band.
Bearish trade setup
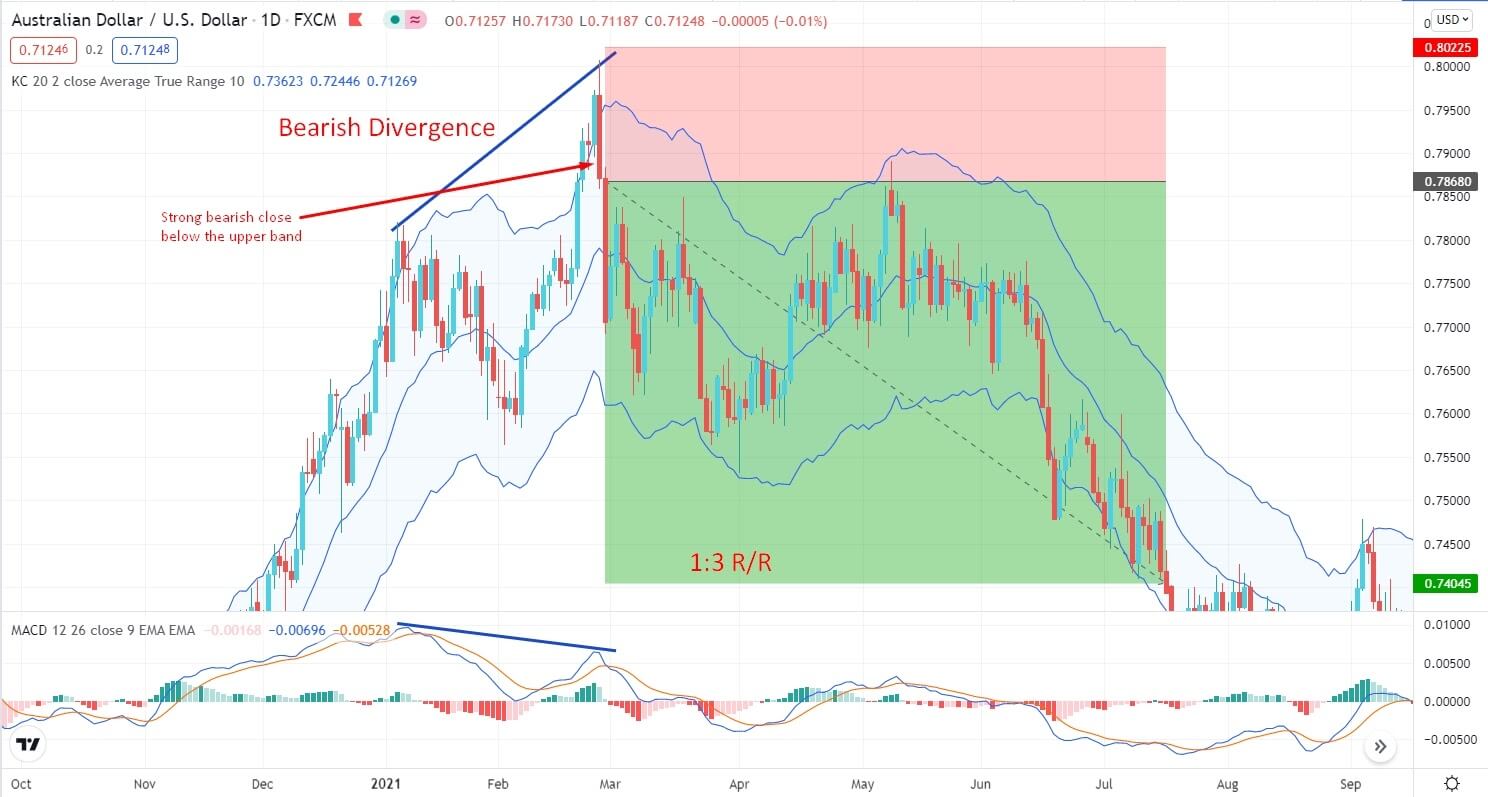
Bearish long-term strategy
Entry
Look for a sell entry when the price had a daily bearish candle close below the upper band after creating a bearish divergence.
Stop loss
Your order should be placed above the upper band with a 10-15 pips buffer.
Take profit
Take the profit by target 1:3 risk/reward ratio. Otherwise, you can take the profit when the price touches the lower band.
Pros and cons
| 👍 Pros | 👎 Cons |
|
|
|
|
|
|
Final thoughts
Finally, the trading setup used has a significant impact on the effectiveness of this technical tool. Hence, traders must set the method that shows how they are willing to use the indicator. Afterward, use it as an aid to gain the targeted result.


Comments