
It is prevalent among financial traders to use technical indicators to determine trading positions. Different technical indicators use different calculation techniques to show the market context. It becomes easier for traders and investors to make trading decisions by readings that come from technical indicators and tools. The KDJ is a popular tool among other technical indicators.
However, when you want to trade using any indicator, it involves learning the functionality of that particular tool. This article will introduce you to the KDJ indicator besides describing trading strategies and listing the top pros and cons.
What is the KDJ indicator?
It is a technical indicator that shows the market context in an independent window. It shares some similarities with the stochastic oscillator indicator, which contains only two lines. Meanwhile, the KDJ indicator has three lines:
- %K
- %D
- %J
The %K and %D act as the stochastic oscillator indicator and indicate the levels of oversold (20) and overbought (80). Meanwhile, the %J line can go beyond these levels.
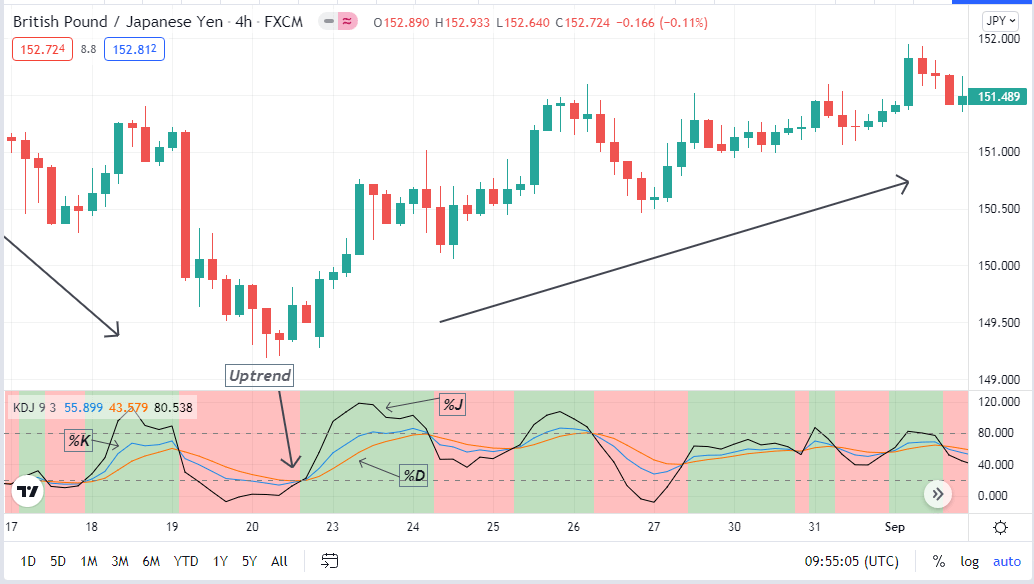
Different trends by KDJ indicator
Crossover between these lines indicates trends. When these lines come together, it means an upcoming movement that can be bullish or bearish. You may know the stochastic oscillator and alligator indicator separately; this indicator will generate trade ideas that include calculations similar to both of them.
How to trade using the KDJ indicator?
This tool is popular among investors to generate trade ideas for stocks, forex pairs, commodities, etc. When the %K or the blue line crosses the %D or red line, it indicates a bullish pressure on the asset price.
Inversely, the exact opposite crossover between these lines declares a bearish pressure on the asset price. When these lines are near the lower (20) level, it means the price remains in an oversold condition, and it indicates an overbought condition when these lines are near the upper (80) line.
When a bullish trend starts, the %J line crosses both the %K and %D lines on the upside, and it crosses these lines on the downside when the price movement turns bearish. You can use only KDJ or combine it with other technical tools and indicators to generate trade ideas.
A short-term trading technique
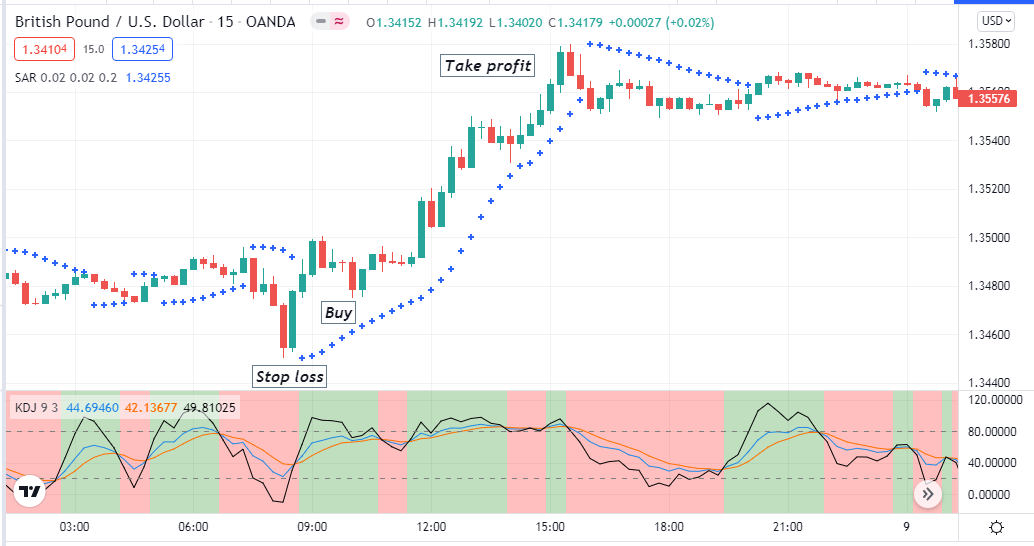
In our short-term trading method, we use the KDJ indicator beside another popular technical indicator, the parabolic SAR. This trading technique applies to any tradable trading asset on any time frame chart.
We recommend using at least 15min or above charts to generate trade ideas using this trading technique. The parabolic SAR dots declare trends by appearing on above or below price candles. If you use time frames of 15 min or an H1 chart, then it is better to confirm the price direction from the upper timeframes, such as H4 or daily charts.
Bullish trade scenario
Check the chart if:
- The parabolic SAR dot appears below price candles.
- The %K line of the KDJ indicator crosses the %D line on the upside.
- The %J line crosses both the %K and %D lines on the upside.
- These crossovers occur near the lower (20) line.
Bullish setup
Entry
When these conditions above match your target asset chart, it signals an upcoming possible bullish pressure on the asset price. Place buy order.
Stop loss
The stop loss position for your buy order will be below the current swing low.
Take profit
Close the buy order when:
- The parabolic SAR dot appears above price candles.
- The %K line crosses the %D line on the downside.
- The %J line crosses below both the %D and %K lines.
- All dynamic lines of the KDJ indicator remain near the upper (80) line.
Bearish trade scenario
Check the chart if:
- The parabolic SAR dot appears above price candles.
- The %K line of the KDJ indicator crosses the %D line on the downside.
- The %J line crosses both the %K and %D lines on the downside.
- These crossovers occur near the upper (80) line.
Bearish setup
Entry
When these conditions above match your target asset chart, it signals an upcoming possible bearish pressure on the asset price. Place sell order.
Stop loss
The stop loss position for your sell order will be above the current swing high.
Take profit
Close the sell order when
- The parabolic SAR dot appears below price candles.
- The %K line crosses the %D line on the upside.
- The %J line crosses above both the %D and %K lines.
- All dynamic lines of the KDJ indicator remain near the lower (20) line.
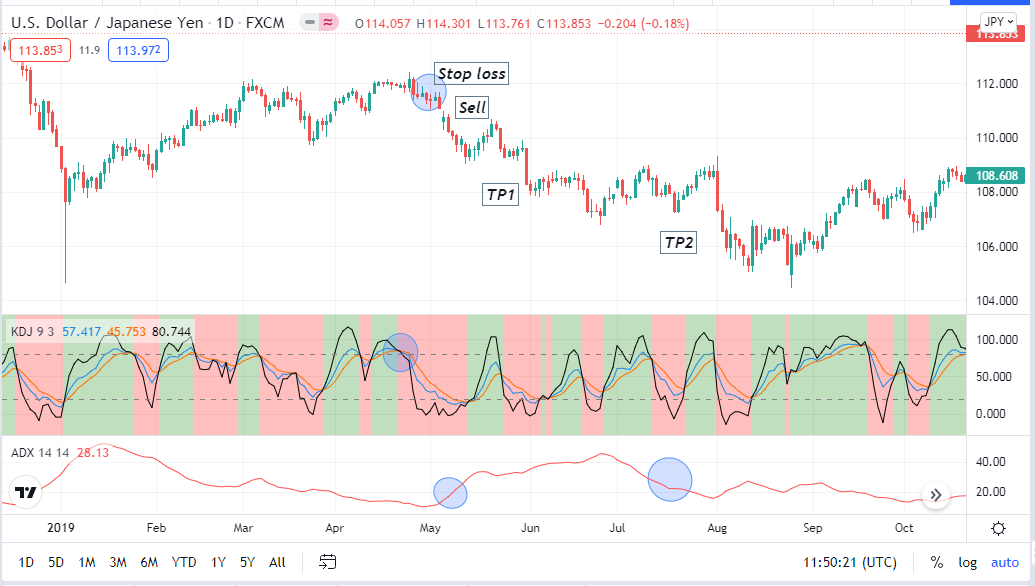
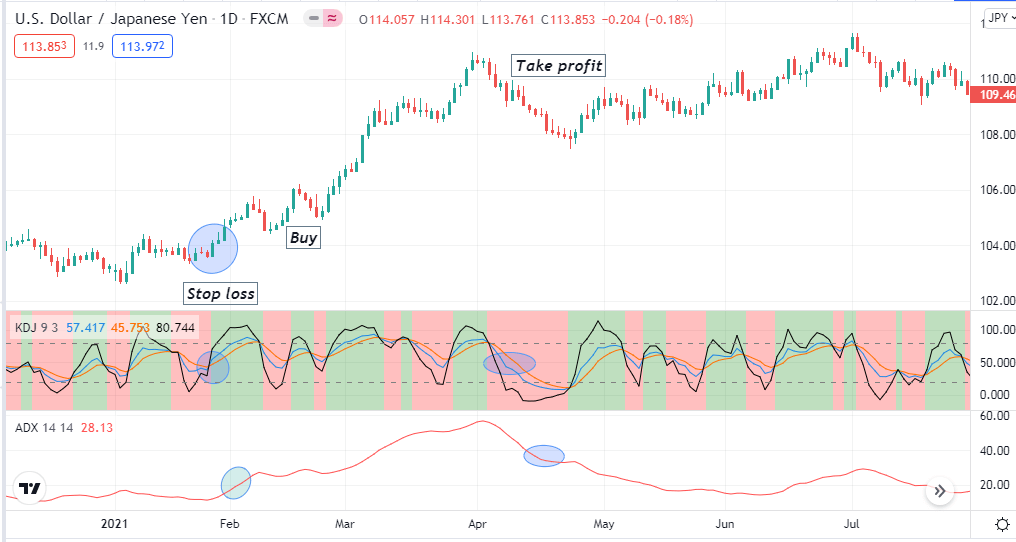
A long-term trading technique
We use the ADX indicator beside the KDJ indicator in our long-term trading method. Both indicators show readings on independent windows. You can apply this strategy to any timeframe chart; we recommend using H4 or higher charts to catch long-term trades.
Bullish trade scenario
Observe your target asset chart if:
- The %K line crosses the %D line on the upside of the KDJ window.
- The %J line crosses both the %K and %D lines on the upside.
- These crossovers occur near the lower (20) line.
- The ADX line is above 20.
Bullish setup
Entry
When these conditions above match your chart, place a buy order.
Stop loss
Set a stop loss below the current swing low.
Take profit
When the KDJ indicator window’s signal lines reach the upper (80) line, you can close the buy order. Otherwise, close the order when
- The KDJ signal lines come at the mid (50) level of that indicator window.
- The ADX value drops below 35.
Bearish trade scenario
Observe your target asset chart if:
- The %K line crosses the %D line on the downside of the KDJ window.
- The %J line crosses the other two dynamic lines on the downside.
- These crossovers occur near the upper (80) line.
- The ADX line is above 20.

Bearish setup
Entry
When these conditions above match your chart, place a sell order.
Stop loss
Set a stop loss above the current swing high.
Take profit
When the KDJ indicator window’s signal lines reach the lower (20) line, you can close the sell order. Otherwise, close the order when:
- The KDJ signal lines come at the mid (50) level of that indicator window.
- The ADX value drops below 35.
Pros and cons
| 👍 Pros | 👎Cons |
| You can trade many financial assets. | It only depends on technical data while ignoring many fundamental impacts. |
| You will get both short-term and long-term trades using this indicator. | This indicator can fail during significant fundamental news releases. |
| The KDJ indicator is simple to use. | This indicator is not available in all trading platforms or is not among the built-in indicators. |
Final thought
Finally, the KDJ indicator is a potential indicator to execute constant profitable trading positions. We recommend using it wisely and practicing demo trading to master the concept before using it for real trading.


Comments