
Market participants have been using many technical indicators besides many tools to determine accurate trading positions. Using these things in trading enables traders to make constant profits and sort out the most profitable trades with lower risks. The stochastic is one of the top popular oscillator indicators that financial traders choose to obtain market context.
However, many available indicator types, such as trend, momentum, volume, etc., use different calculations to define market conditions. A brief discussion may help you to understand the functionality of each type. This article will introduce you to this tool besides trading strategies with chart attachments using this tool.
What is the stochastic indicator?
It is a choosable momentum indicator that works with the closing price of specific periods to generate trade ideas. It shows results in an independent window.
That window contains two dynamic lines that move with the price changing at a range of 0 to 100. The upper level is at 80 of that range, and the lower level is at 20. When the dynamic signal lines reach or cross any of these levels indicates a high/low range of specific period settings.
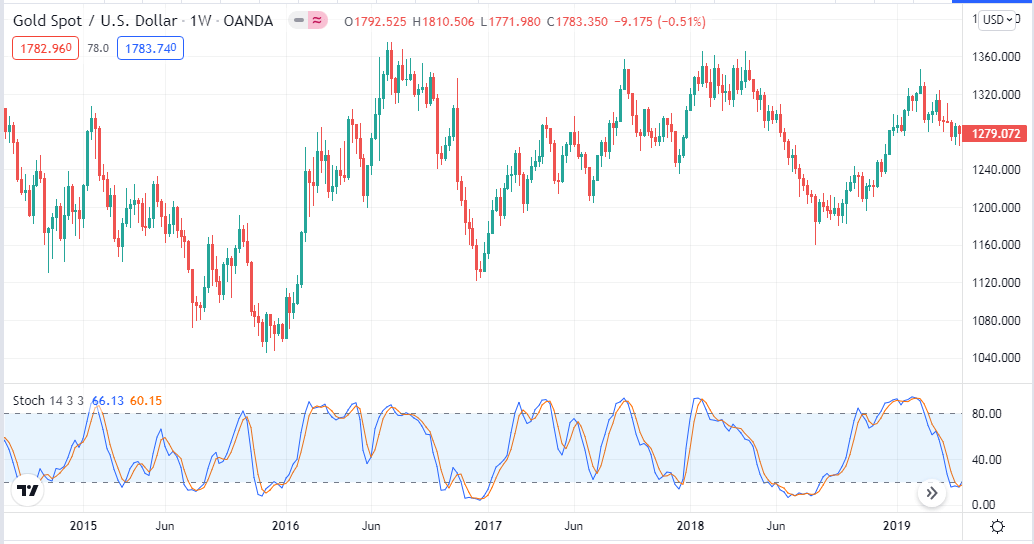
The stochastic indicator on a weekly chart of XAU/USD
The best values of an oscillator indicator are 14,3,3 to obtain the market context. These values work fine at H4 or D1 charts, as you can avoid the fake swing high/low levels of shorter time frame charts. When the blue line crosses the dynamic red line on the upside, it declares buyer domination at the asset price.
Inversely blue line crossed below the red line indicates seller domination at the asset price. These lines reach or stay above the upper (80) line confirms an overbought condition. Meanwhile, this indicator declares an oversold condition when these lines come or remain below the lower (20) line.
How to trade with a stochastic oscillator indicator?
The trading indicator stochastic describes the market data so briefly that you can make trading positions by a single use of this indicator. Experts often combine this indicator reading with other tools and indicators such as RSI, MACD, MA crossover, support resistance levels, trendlines, etc., for getting more accurate trading positions.
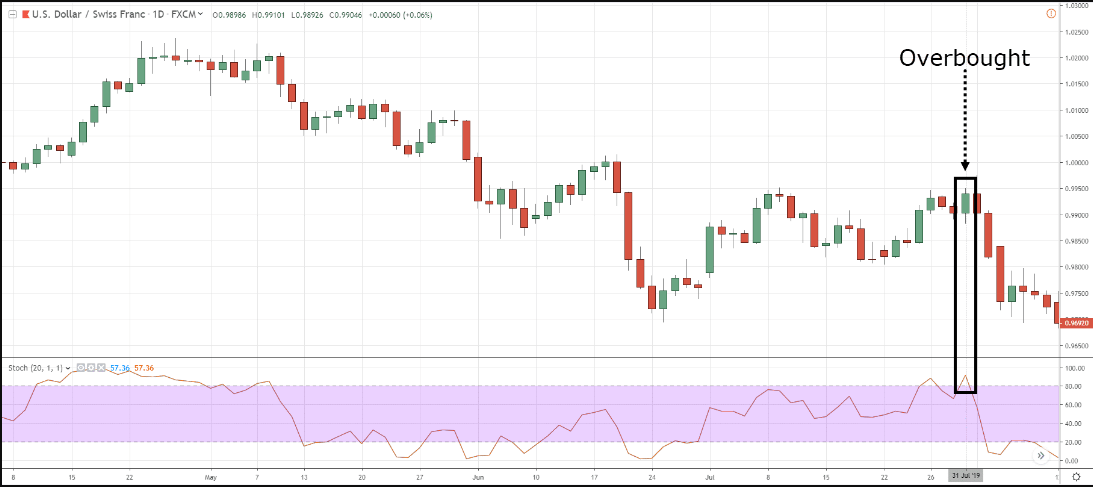
Stochastic oscillator making the overbought area
You can use this indicator on any trading asset, including forex pairs, stocks, commodities, and so on. Between the stochastic indicator’s two lines, one reflects the oscillator’s actual value for a particular session; the other reflects a three-day simple moving average value. A buy signal comes from this indicator when the signal lines at or below 20. On the other hand, when those lines are at or above 80, the sell signals come.
A short-term trading technique
Our short-term method combines stochastic oscillator reading with support resistance of the target asset to sort out potentially profitable trading positions. You can obtain good results on any time frame chart using this strategy.
We recommend using 15min charts to have profitable short-term trading positions. Any trading asset that has sufficient volatility is suitable to trade applying this trading method. First, mark valid support resistance levels from upper time frames such as H4, Daily, etc. Daily, weekly, monthly opening, closing, high, low are considerable levels to mark.
Bullish trade scenario
Mark the support resistance levels from the upper time frame charts for the target asset and seek entry positions at the 15-min chart. When price touches or reaches near any support level, check the price reaction and stochastic window. Check if:
- The blue line crosses the dynamic red line on the upside.
- Both signal lines are below or near the bottom (20) line.
- Both dynamic lines are heading toward the upside.
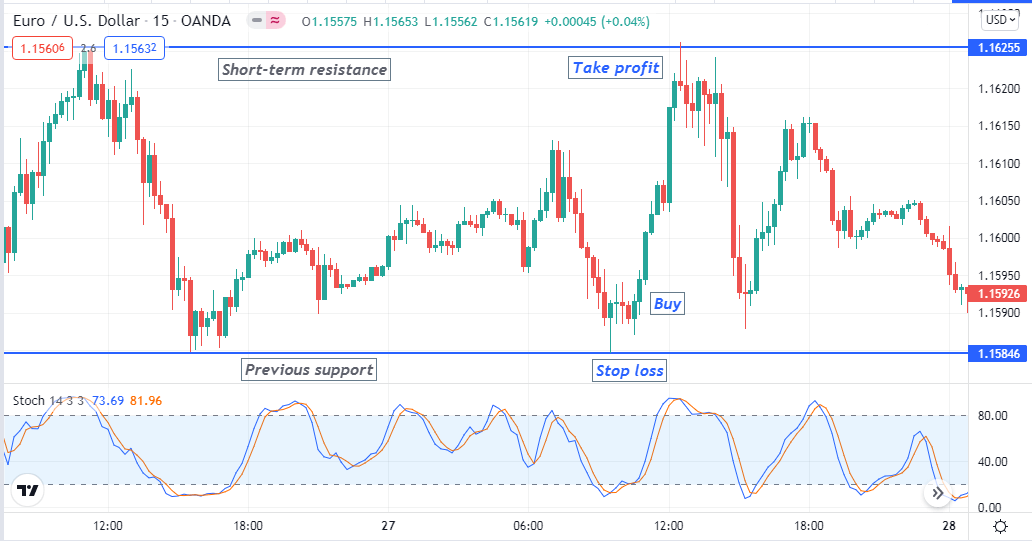
Bullish setup
Entry
If all the above conditions match your target chart, place a buy order after closing the current candle.
Stop loss
The stop-loss level of your buy order will be below the current swing low with a buffer of 5-10pips.
Take profit
The first profit target will be below the nearest resistance level.
Bearish trade scenario
When price reaches any resistance level that you mark, check the price reaction and stochastic window. Check if:
- The blue line crosses the dynamic red line on the downside.
- Both signal lines are above or near the upper (80) line.
- Both dynamic lines are heading toward the downside.
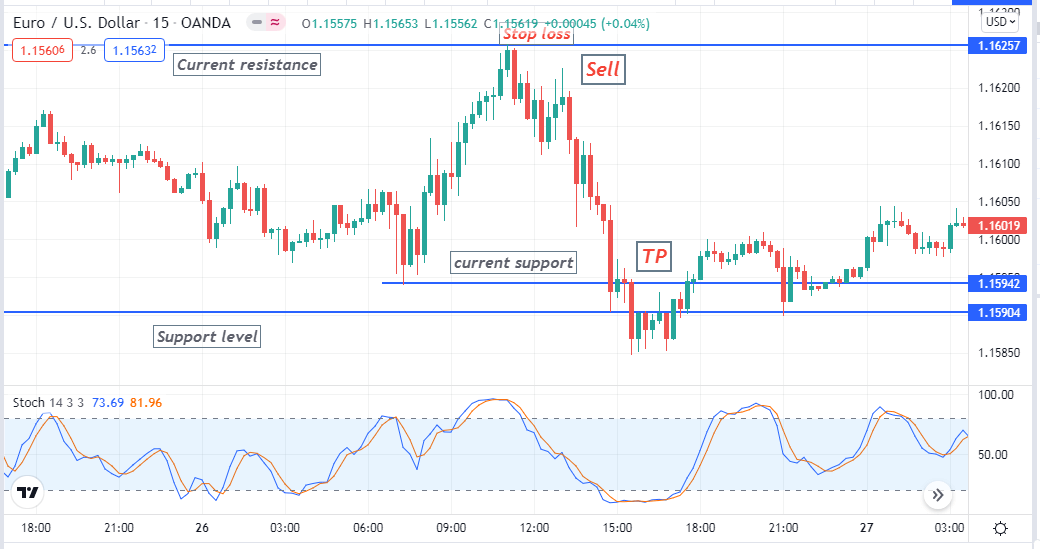
Bearish setup
Entry
If all the above conditions match your target chart, place a sell order after closing the current candle.
Stop loss
The stop-loss level of your buy order will be above the current swing high with a buffer of 5-10pips.
Take profit
The first profit target will be above the nearest support level.
A long-term trading method
Our long-term trading method involves using another popular indicator, MACD, besides the stochastic oscillator. It also has two dynamic lines, and crossover occurs between them according to the market context; besides, green and red histogram bars take place at both sides of the middle line. This strategy applies to any time frame chart. We recommend using H4 or above time frame charts to get pleasing results.
Bullish trade scenario
When the price makes a current swing low position check:
- The blue line crosses above the red line on both MACD and the stochastic indicator window.
- Both dynamic lines head toward the upside at both indicator windows.
- MACD green histogram bars take place above the middle (0.0) line.
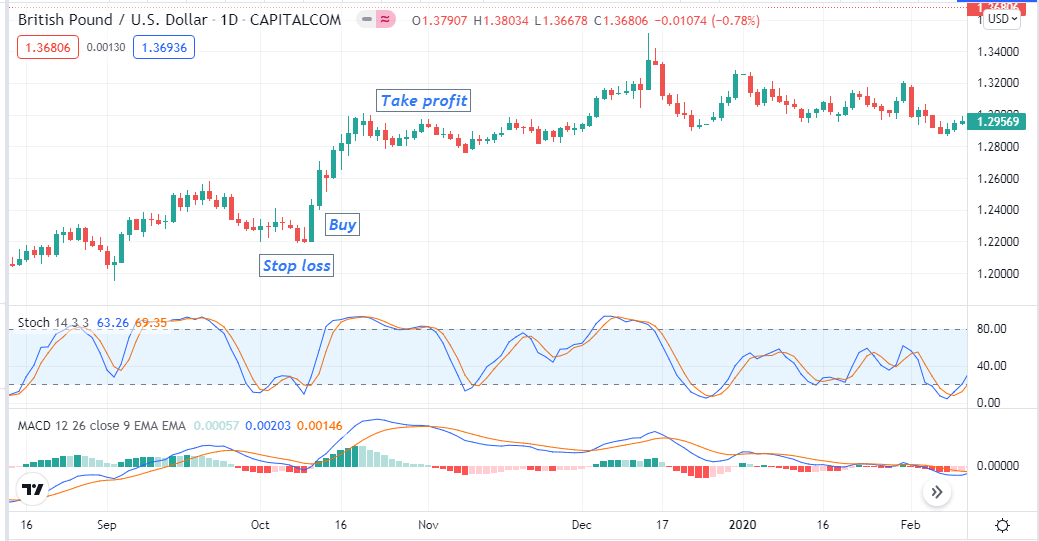
Bullish setup
Entry
When price movement matches these conditions above, place a buy order.
Stop loss
The stop-loss level of the buy order will be below the current swing low.
Exit
Exit from the buy position when:
- The dynamic blue lines cross the dynamic red lines on the downside of both indicator windows.
- MACD red histogram bars take place below the middle (0.0) line.
Bearish trade scenario
When the price makes a current swing high position check:
- The blue line crosses below the red line on both MACD and the stochastic indicator window.
- Both dynamic lines head toward the downside at both indicator windows.
- MACD red histogram bars take place below the middle (0.0) line.
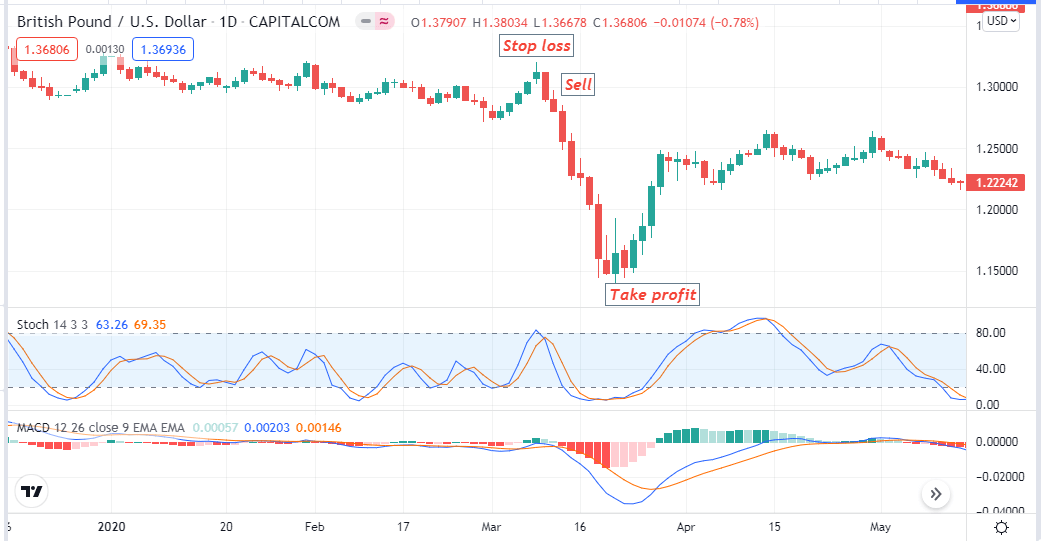
Bearish setup
Entry
When price movement matches these conditions above, place a sell order.
Stop loss
The stop-loss level of the sell order will be above the current swing high.
Exit
Exit from the position when:
- The dynamic blue lines cross the dynamic red lines on the upside of both indicator windows.
- MACD green histogram bars take place above the middle (0.0) line.
Pros and cons
| Pros | Cons |
|
|
|
|
|
|
Final thought
This indicator is a preferable technical tool that traders choose. We suggest using these strategies above in demo trading before applying for live trading.


Comments