Some standard trading indicators apply to any trading instruments, and the moving average (MA) is among those indicators. Most trading platforms support these indicators for increasing popularity. Beginners to professional traders feel comfortable using moving averages to determine the market context and generate trade ideas.
However, several types of moving averages are available in the financial market. So novice traders may face some confusion while choosing any moving average. This article will introduce you to Simple moving average (SMA) and Exponential moving average (EMA), best for day trading. Additionally, it includes trading strategies with chart attachments using that MA type.
What are SMA and EMA?
Moving averages are a standard technical indicator that calculates a series of price candles depending on specific info to a particular period. There are diverse moving averages available to demonstrate the market context, including as Simple moving average, Weighted moving average, Exponential moving average, Arnaud Legoux moving average, etc.
Technical investors use moving averages on charts to determine the trend, the trend’s strength, determine support resistance points, or even frequently identify entry/exit points of trades.
SMA and EMA of the same periods
You can implement moving averages using various info of price candles such as opening price, closing price, highs, lows, etc.
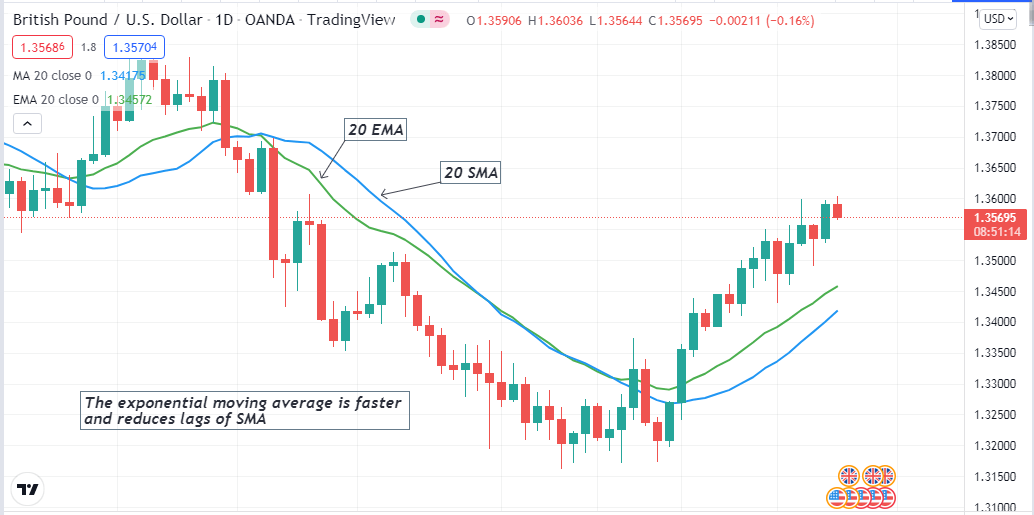
For example, a series of prices is 20$, 22$, 23$, 24$, 25$, 26$, 28$. Then the SMA calculation will be (20$+22$+23$+24$+25$+26$+28$=168$/7=24), which are the seven periods of SMA. SMA and EMA are the same in calculation; the primary difference is SMA puts the same weighting in all values, whereas the EMA gives weighting on the recent price changing values.
This feature of EMA makes it more popular with day traders as it reduces lags than SMA.
How to use EMA on trading strategy?
The MA is a straightforward tool to apply. You can use this indicator to trade any trading instrument, including stocks, indices, forex, etc. MA strategies are so popular among traders as you can implement these on any timeframe chart to obtain market context.
A common practice among technical analysts is to use MA crossover to generate trade ideas using two or more moving averages lines on a chart.
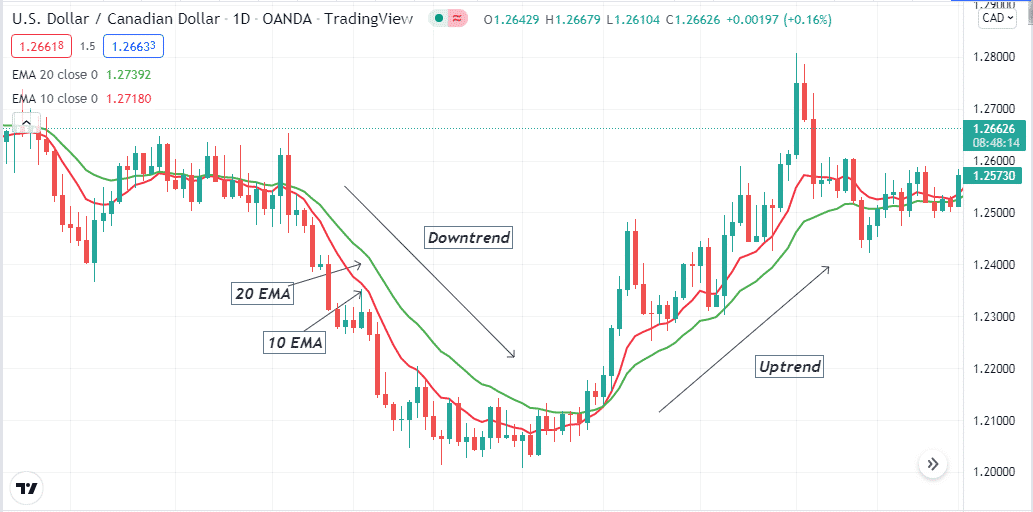
MA crossover concept
When the MA with a smaller value crosses the MA with a larger value on the upside declares bullish momentum, and the exact opposite crossover declares bearish momentum. You can use only this concept to execute successful trades or combine other technical tools and indicators to execute successful trades.
A short-term trading strategy
We use three different EMA to generate trade ideas in our start-term trading strategy. EMA 10 is a red line in this method, EMA 20 is a green line, and EMA 100 is a blue line. The blue EMA determines the support resistance points, and crossovers between the other two EMA lines suggest trades’ entry/exit points. This method applies to any trading instrument on any timeframe; we recommend using a 15-min chart to determine short-term trading positions.
Bullish trade scenario
Apply those EMA lines on your target asset chart and observe when:
- The red EMA crosses the green EMA on the upside.
- The green EMA crosses the blue EMA on the upside.
- The red and the green EMA both head toward the upside and remain above the blue EMA.
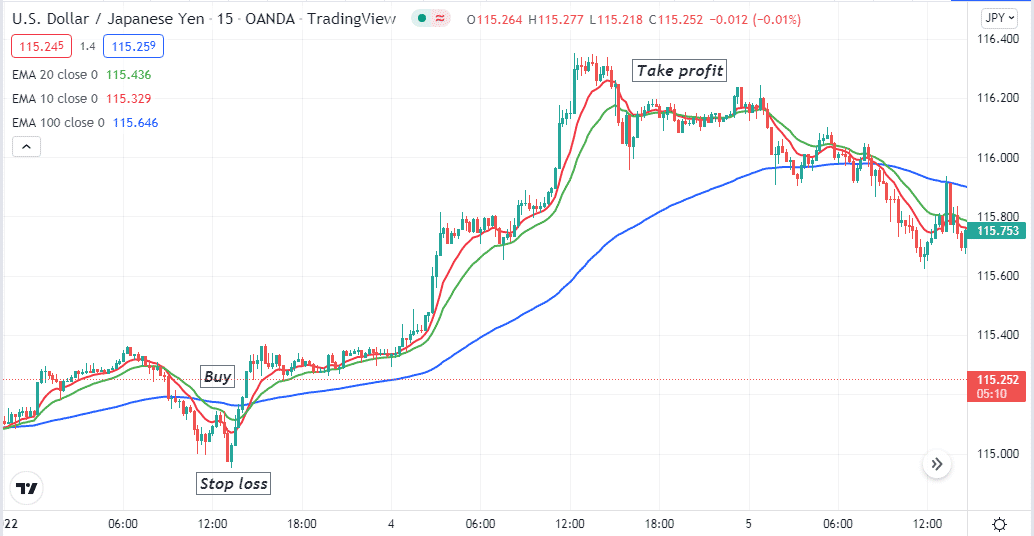
Bullish setup
Entry
When these conditions above match your target asset chart, it declares sufficient bullish pressure on the asset price. This method suggests opening a buy position here.
Stop loss
The initial stop loss level will be below the bullish momentum.
Take profit
Continue the buy trade till the bullish momentum remains intact. Close the buy position when the red EMA crosses the green EMA on the downside.
Bearish trade scenario
Apply those EMA lines on your target asset chart and observe when:
- The red EMA crosses the green EMA on the downside.
- The green EMA crosses the blue EMA on the downside.
- The red and the green EMA both head toward the downside and remain below the blue EMA.
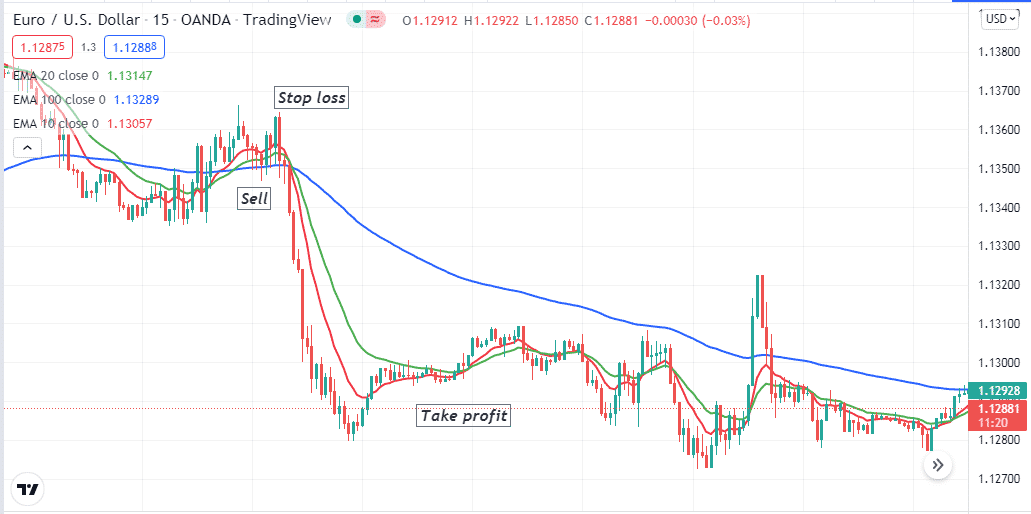
Bearish setup
Entry
When these conditions above match your target asset chart, it declares sufficient bearish pressure on the asset price. This method suggests opening a sell position here.
Stop loss
The initial stop loss level will be above the bearish momentum.
Take profit
Continue the sell trade till the bearish momentum remains intact. Close the sell position when the red EMA crosses the green EMA on the upside.
A long-term trading strategy
We use the golden and death crossover concepts alongside the MACD indicator in our trading method. EMA 50 (green) and EMA 200 (blue) are two different EMA. When the green EMA crosses the blue EMA on the upside, a golden crossover declares the uptrend, and the exact opposite crossover declares the downtrend, the death crossover. This trading method is suitable for use in D1 charts.
Bullish trade scenario
Confirm the bullish trend when:
- The golden crossover occurs between those EMA lines.
- The dynamic blue line crosses the dynamic red line on the upside at the MACD window.
- MACD green histogram bars take place above the central line.
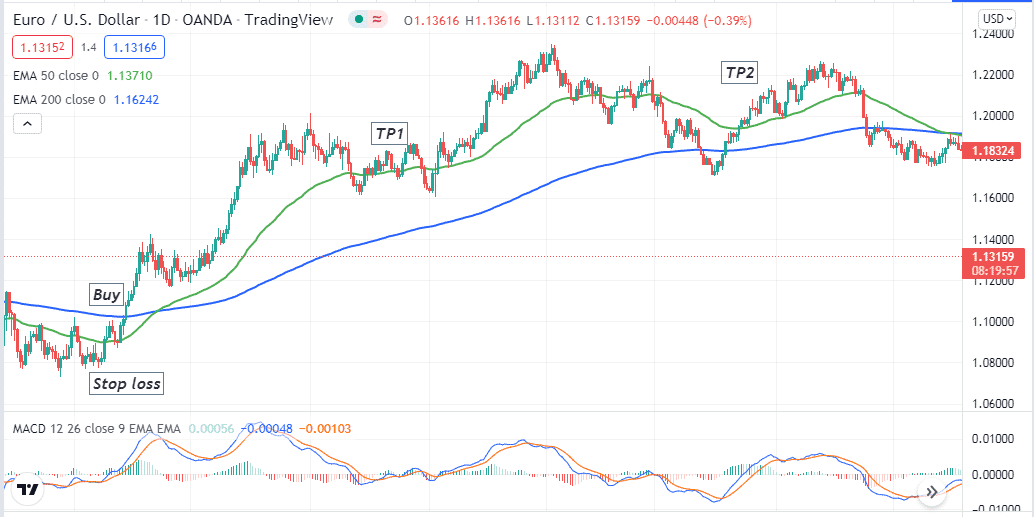
Bullish setup
Entry
Match these conditions above and place a buy order.
Stop loss
Place an initial stop loss below the current bullish momentum.
Take profit
Continue your position according to the market context. Your buy order is safe till the golden crossover remains intact. Close the buy order when the MACD bearish crossover occurs, or red histogram bars take place below the central line.
Bearish trade scenario
Confirm the bearish trend when:
- The death crossover occurs between those EMA lines.
- The dynamic blue line crosses the dynamic red line on the downside at the MACD window.
- MACD red histogram bars take place below the central line.
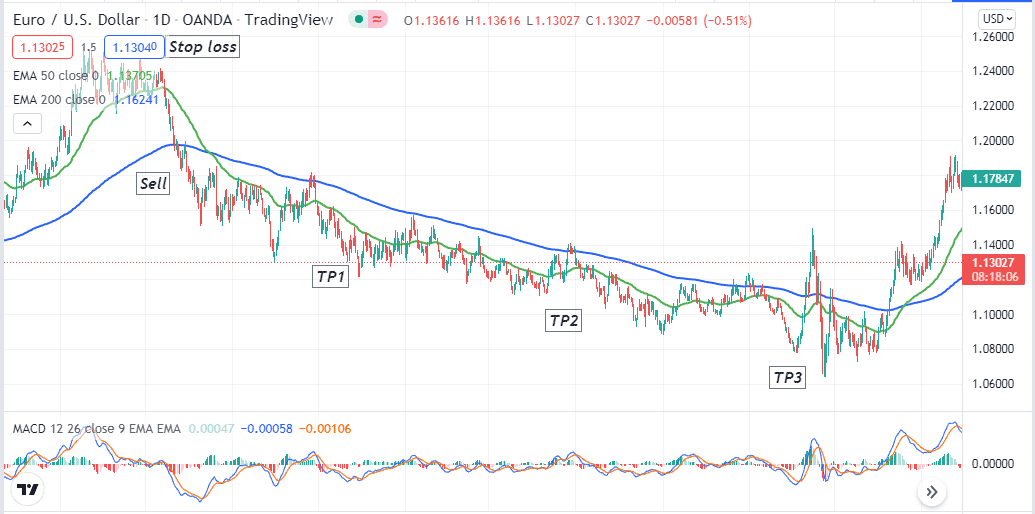
Bearish setup
Entry
Match these conditions above and place a sell order.
Stop loss
Place an initial stop loss above the current bearish momentum.
Take profit
Continue your position according to the market context. Your sell order is safe till the death crossover remains intact. Close the sell order when the MACD bullish crossover occurs or green histogram bars take place below the central line.
Pros and cons
| 👍 Pros | 👎 Cons |
|
|
|
|
|
|
Final thought
Moving average is a core element that most traders use in financial trading. Investors should ensure better use of this tool by cautiously applying it in the chart. There is no alternative to using appropriate money management and risk management system in any trading strategy.


Comments