
The Bitcoin Strength Index (BSI) indicator effectively uses different metrics to obtain the market context. This technical indicator is unique somehow as it uses on-chain analysis alongside traditional technical analysis that has been familiar to financial traders for decades. So it makes sense that this technical indicator is an effective tool for crypto trading.
However, it is not wise to start trading using any technical indicator without adequately knowing the components of that indicator. This article will dive deep into the Bitcoin Strength Indicator and describe sustainable trading strategies using BSI.
What is the BSI indicator?
Many investors declare the crypto market an” immature market” as many market participants enter the marketplace with no previous experience. Moreover, many participants do not know the crypto market or the market’s fundamentals and are not much interested in educating themselves. The indicator is an attractive technical indicator for all crypto traders, including those novice traders, that is relatively unique.
Three components of the BSI indicator are:
- BSI short-term trend
It allow crypto investors to see when the short-term trend changes to be bearish or bullish.
- BSI on-chain trend
It is the most attractive feature offering of the indicator. It allows crypto investors to understand the fundamentals of what is happening on the blockchain before it comes displayed in charts.
- BSI cloud
It helps crypto investors to determine long-term support resistance is bullish and bearish price movements.
Combining these three readings into a single indicator, the BSI becomes an attractive and powerful technical indicator to crypto investors.
BSI interface
How to trade using the BSI indicator?
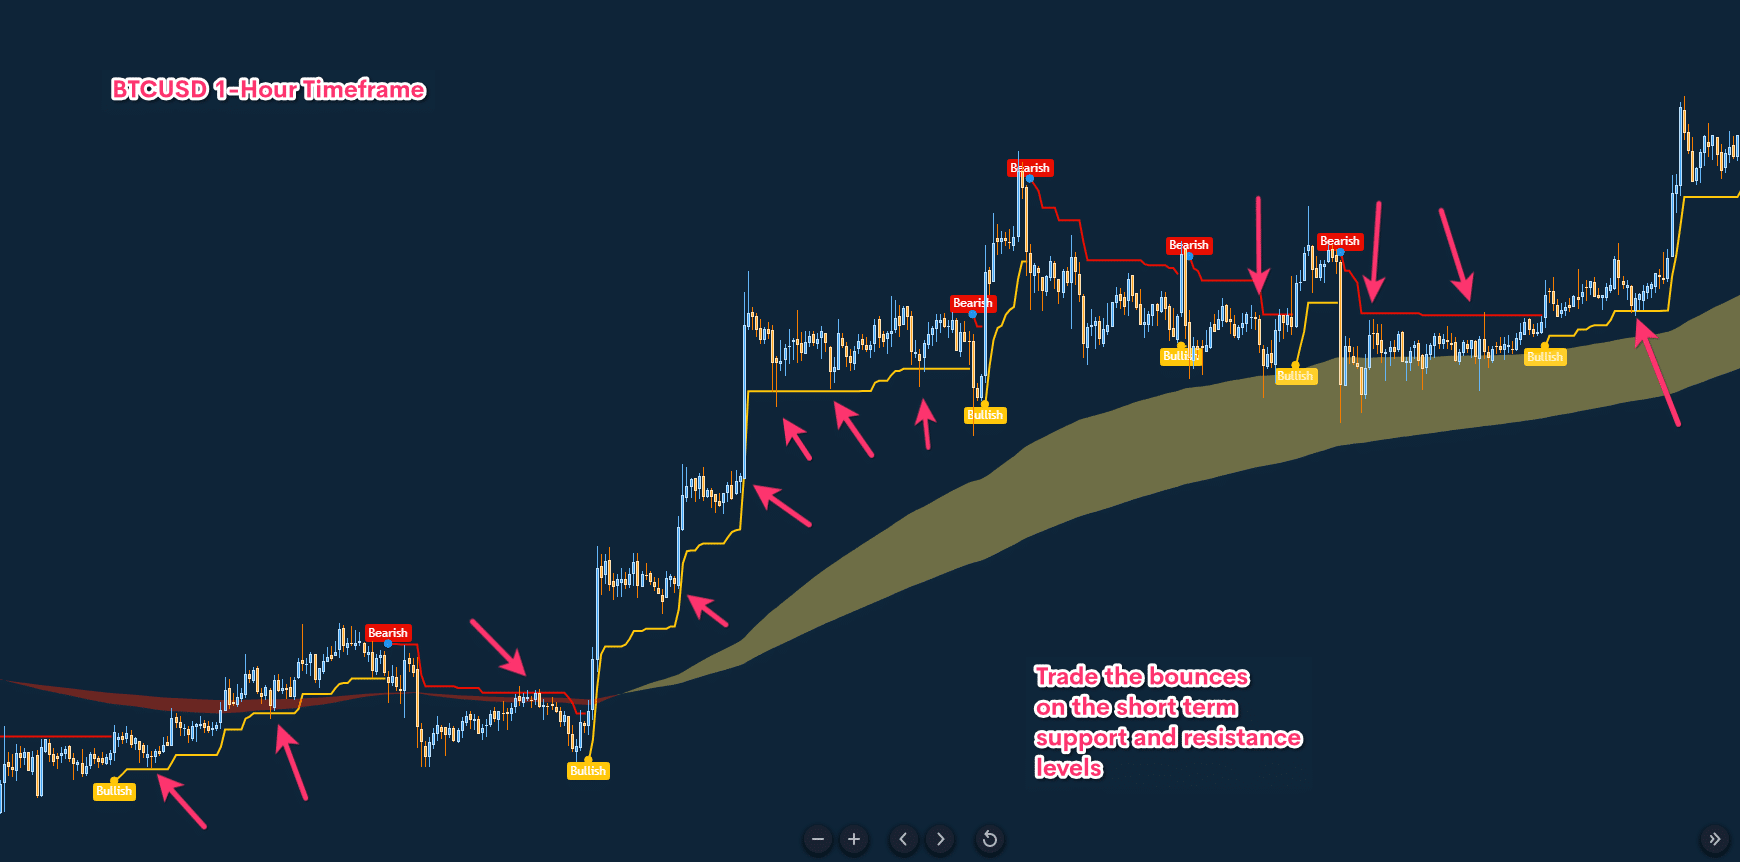
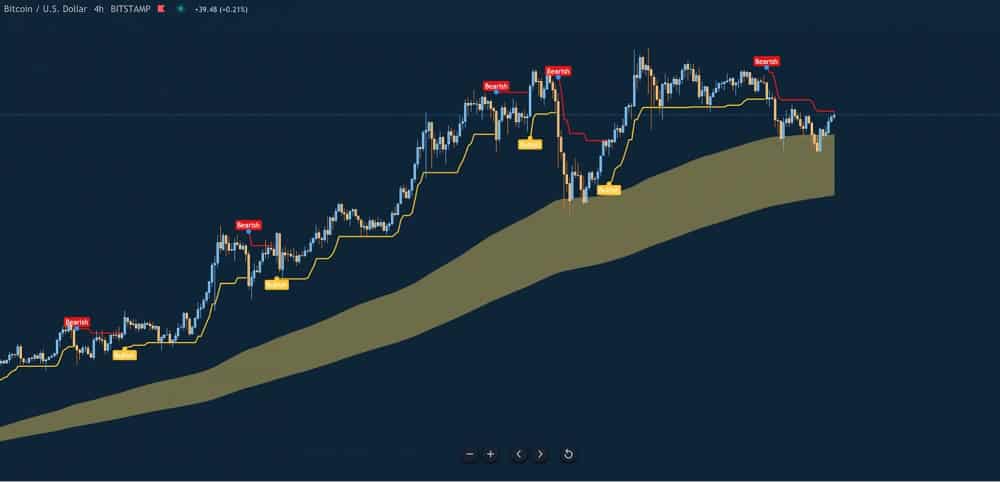
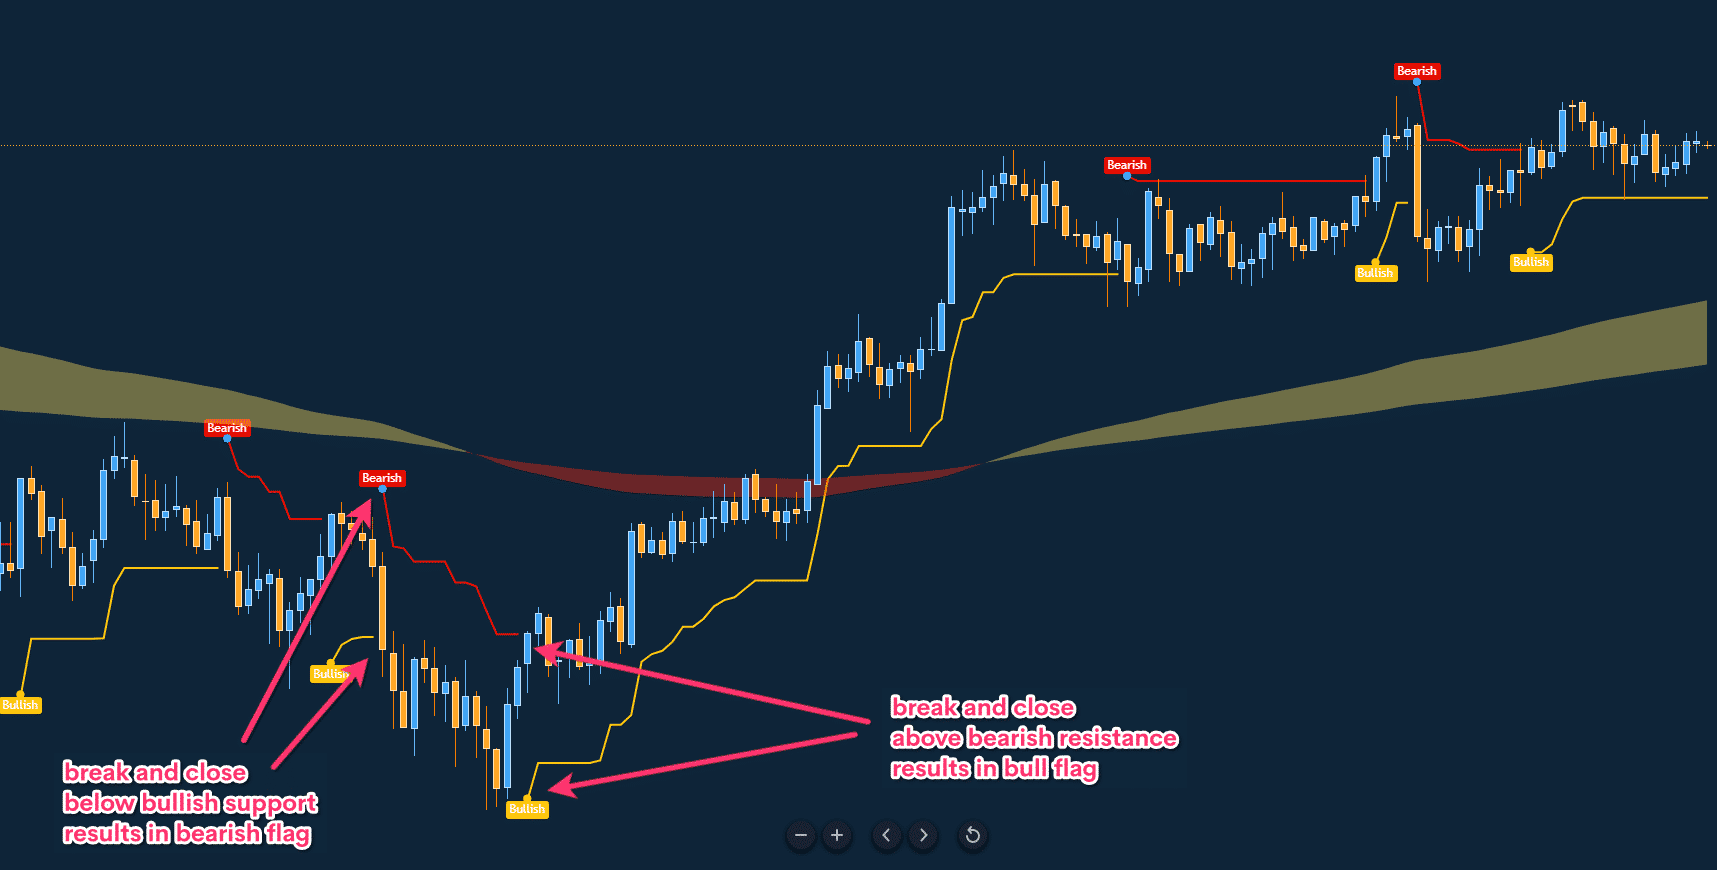
The indicator is straightforward. When the price enters a bullish trend, a yellow line appears below price candles and continues till the price remains on the uptrend. Meanwhile, when the price movement switches to a downtrend, the line shifts at the upper side and becomes blue. Meanwhile, trend swinging points this indicator declares as bullish and bearish bubbles.
Additionally, there is the BSI cloud that declares long-term support- resistance. You can use this concept independently to generate constant profitable trading ideas. Otherwise, you can combine this indicator reading with other technical indicators, including RSI, MACD, MA crossover, ADX, etc., to participate in the most efficient and potentially profitable trades.
Short-term trading strategy
We use MACD as a supportive indicator alongside the BSI indicator in this short-term trading method. When both indicators suggest a particular direction, this strategy means opening a position either buy or sell. This method suits fone on any crypto asset, and we recommend using it on an hourly or at least a 15min chart to generate trade ideas.
BSI indicator interface
Bullish trade scenario
Set both indicators at your target asset chart and seek to open positions by checking the conditions below:
- The price is above the yellow line of the BSI indicator.
- The BSI indicator creates a bullish bubble.
- BSI cloud remains below price candles.
- The dynamic blue line reaches above the dynamic red line at the MACD indicator window.
- MACD green histogram bars take place above the central line.
Entry
Match these conditions above with your target asset chart and open a buy order.
Stop loss
Place an initial stop loss below the recent swing low.
Take profit
Close the buy order by checking the conditions below:
- The yellow line of the BSI indicator switches above price candles and turns blue.
- The BSI indicator creates a bearish bubble.
- The dynamic blue line drops below the dynamic red line of the MACD indicator window.
- MACD red histogram bars take place below the central line.
BSI buy example
Bearish trade scenario
Set both indicators at your target asset chart and seek to open positions by checking the conditions below:
- The price is below the blue line of the BSI indicator.
- The BSI indicator creates a bearish bubble.
- BSI cloud remains above price candles.
- The dynamic blue line reaches below the dynamic red line at the MACD indicator window.
- MACD red histogram bars take place above the central line.
Entry
Match these conditions above with your target asset chart and open a sell order.
Stop loss
Place an initial stop loss above the recent swing high.
Take profit
Close the sell order by checking the conditions below:
- The blue line of the BSI indicator switches above price candles and turns yellow.
- The BSI indicator creates a bullish bubble.
- The dynamic blue line surpasses the dynamic red line on the upside of the MACD indicator window.
- MACD green histogram bars take place above the central line.
Long-term trading strategy
This trading method uses a popular momentum indicator, RSI, alongside the BSI indicator. The RSI indicator is so popular among financial traders. Crypto investors get more efficient trading positions when combining this indicator reading with the BSI indicator. We suggest using a daily or at least an H4 chart to conduct analysis using this strategy.
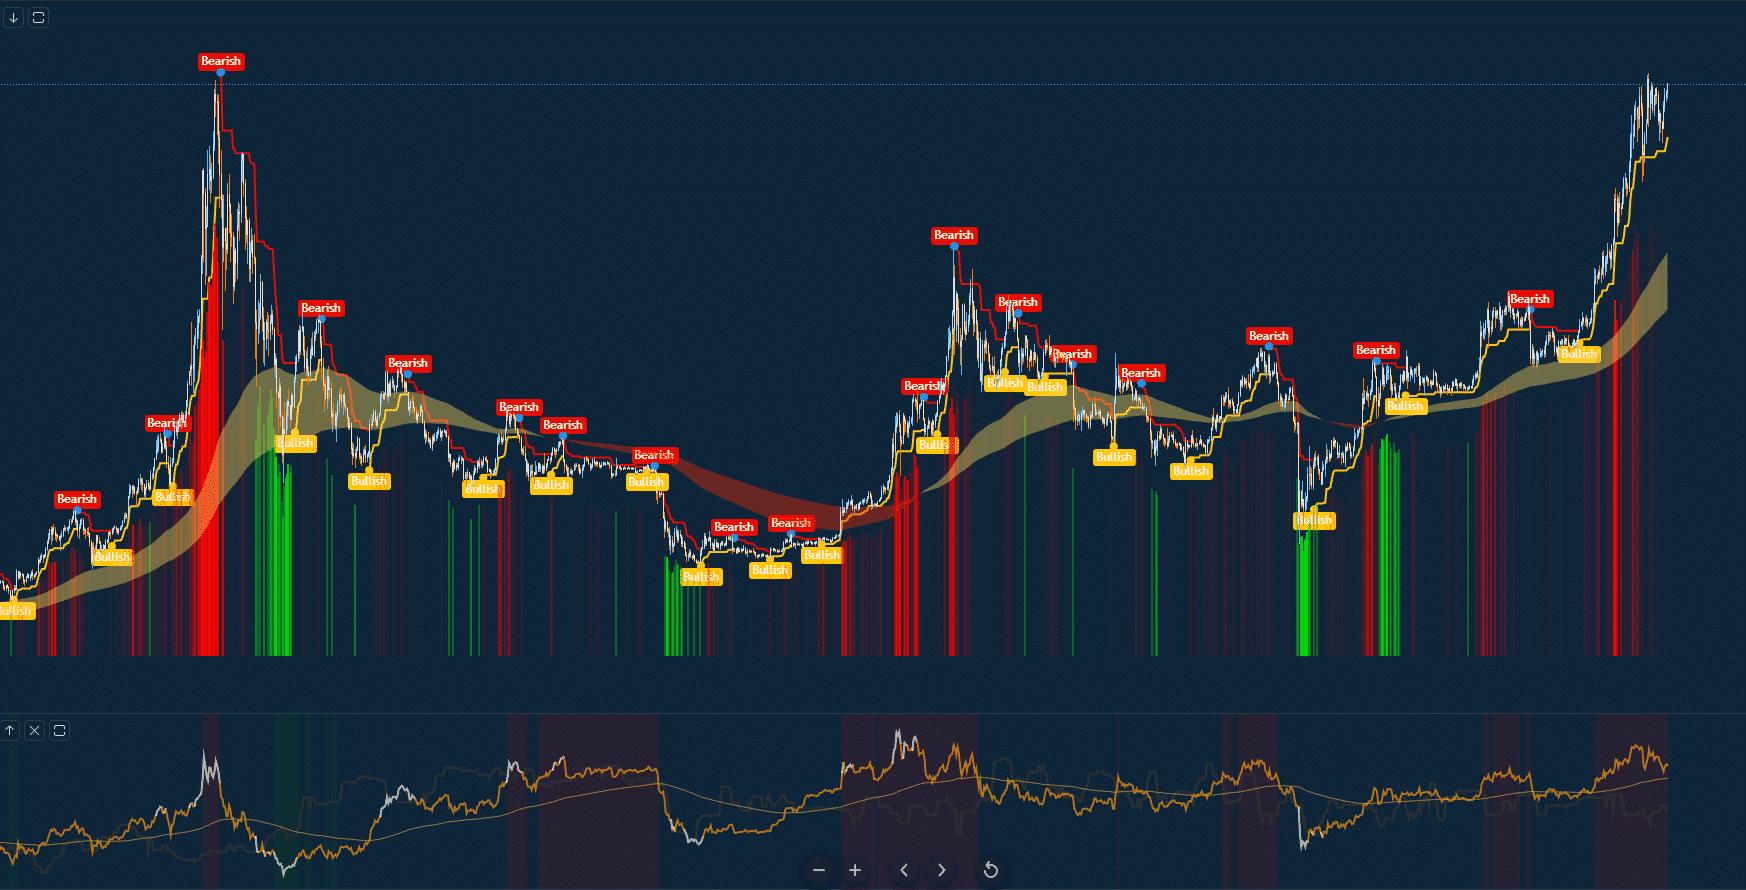
BSI detailed analytics
Bullish trade scenario
This method suggests buying trades when the conditions below match:
- The BSI cloud remains below price candles.
- BSI yellow line appears.
- The BSI indicator creates a bullish bubble.
- The RSI dynamic line floats near the central (50) line and heads on the upside.
Entry
When these conditions above match your target asset chart, it indicates the initiation of a bullish trend. Open a buy order.
Stop loss
Set an initial stop loss below the current bullish momentum.
Take profit
Close the buy order by checking the conditions below:
- The BSI blue line appears above price candles.
- The BSI cloud switches above price candles.
- The BSI indicator creates a bearish bubble.
- The RSI dynamic line reaches above the top (70) level or starts dropping after getting that level.
Bearish trade scenario
This method suggests buying trades when the conditions below match:
- The BSI cloud remains above price candles.
- BSI blue line appears.
- The BSI indicator creates a bearish bubble.
- The RSI dynamic line floats near the central (50) line and heads on the downside.
Entry
When these conditions above match your target asset chart, it indicates the initiation of a bearish trend. Open a sell order.
Stop loss
Set an initial stop loss above the current bearish momentum.
Take profit
Close the sell order by checking the conditions below:
- The BSI yellow line appears below price candles.
- The BSI cloud switches below price candles.
- The BSI indicator creates a bullish bubble.
- The RSI dynamic line reaches below the bottom (30) level or starts increasing after getting that level.
Pros and cons
| 👍 Pros | 👎 Cons |
|
|
|
|
|
|
Final thought
Finally, the indicator is unique from many other technical tools for its features. If someone can master the concept and use it efficiently, it becomes easier to catch enormous profitable trades.


Comments