In forex, traders use various technical tools and indicators to identify the market condition. As well as some effective patterns to determine the future price movement of assets using harmonic price patterns.
Harmonic price patterns utilize the Fibonacci retracement levels and make geometric price patterns define the price turning points. Like all other trading methods, this pattern type also predicts the future price movement of assets. Often it includes large and smaller waves.
What is the Crab pattern?
It is a pattern that appears as a five points extension structure. Traders should use specific Fibonacci retracement levels to identify each point of this pattern.
It combines four legs: XA, AB, BC, and CD, where point D is more likely a start reversing zone for the price. Therefore, that level is called a potential reversal zone (PRZ). This pattern is almost similar to the Gartley and the Butterfly patterns.
The Crab pattern is a kind of technical analysis frequently used across forex, stocks, and futures markets. It is popular that defines the price reversal. However, it suggests entry points at the extreme highs or lows.
How to identify the Crab pattern?
It has four legs, starts with point X and ends with the D. It is similar to the Butterfly pattern that has the ending point at the Fibonacci extension level of 127%. So the ending point of the pattern is at 161.8% Fibonacci extension level of the first leg (XA).
Let’s see a simple illustration of it.
Like other harmonic patterns, this one uses Fibonacci levels that identify the possible retracement levels. But, traders should understand the Fibo retracement and extension ratios carefully while identifying this pattern.
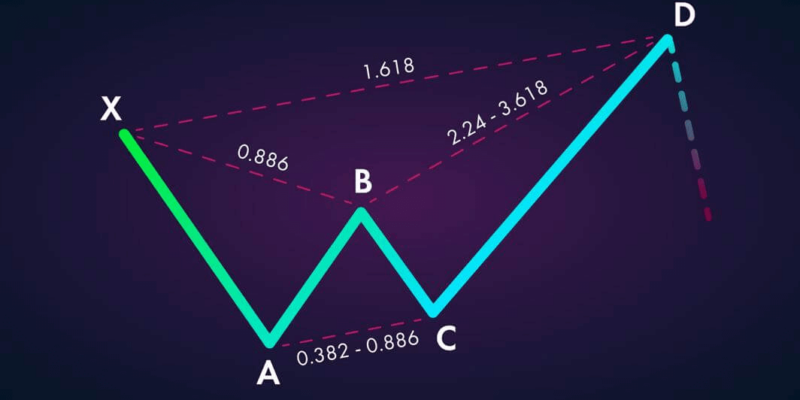
Let’s have a closer look at the legs:
- XA
This is the first leg, which is a significant fact because other ones depend on its calculation. However, there is no Fibo calculation for this first leg of this pattern.
- AB
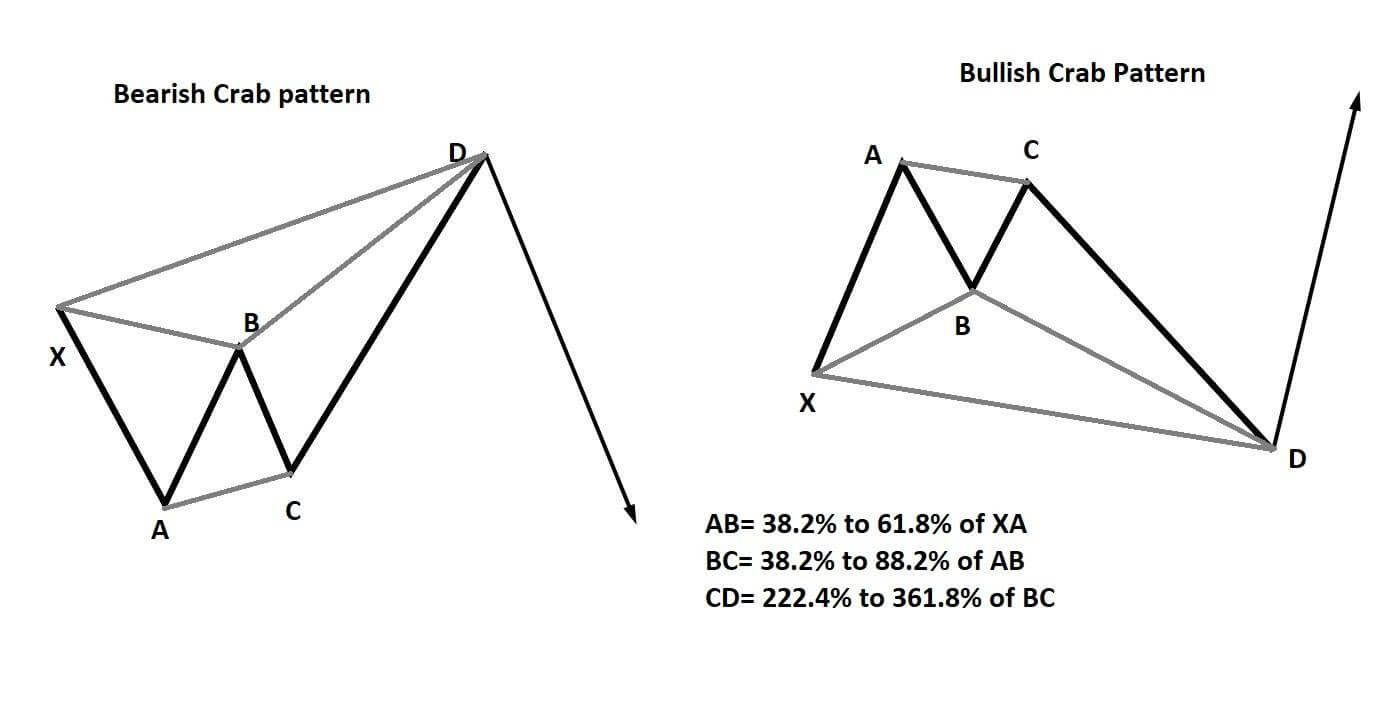
The second leg AB forms by the Fibo calculation of XA. AB can retrace from 38.2% to 61.8% of the Fibo retracement of the first leg (XA).
- BC
The third leg BC is dependent on the Fibo retracement level of AB. This leg can be long as 38.2% to 88.6% of AB. However, this BC confirms the Crab pattern, which is valid until BC doesn’t break below point A.
- CD
The last leg CD is the longest of all others, which confirms this pattern. Thus, it can move toward 224.0% to 361.8% Fibo retracement level of BC.
Crab pattern: critical conditions
We have already seen how the Crab pattern forms with specific Fibo retracement levels. First, however, some basic rules describe the standard Crab pattern.
Let’s highlight the essential conditions:
- Point B should retrace the XA leg.
- Point C should remain within the AB leg. The pattern may become invalid if point C breaks above/ below point B.
- The entry point of this pattern is point D that should break below or above the point X by creating a new higher high or lower low.
The pattern works and identifies the market reversal levels. So anyone can use it in both bullish and bearish market conditions. This pattern identifies the potential reversal zones when the conditions are proper. Moreover, this tool is effective as it suggests the entry, stop loss, and exit positions. So it can be helpful to use an individual trading strategy.
Trading strategies
Let’s discuss the bullish and the bearish trading strategies of this pattern.
Bullish strategy
This type of pattern appears after a bearish move. It works as a critical reversal zone. When point D comes, the market looks like a primary bullish market, and the pattern confirms the continuation of the bullish movement.
After an entire bearish market, find the XA and check the validity by matching the Fibonacci retracement levels as described above. Check all the conditions are proper till finding the point D.
Let’s see how to make a trade based on this pattern:
-
Entry
Identify the point D and wait until the bearish candle forms. As soon as the bearish candle closes, place the buy order.
-
Stop loss
Among all the points, the D is the lowest point. So place a stop loss below the D with a 10-15 pips buffer. That’s the standard buffer for a bullish Crab pattern.
-
Take profit
Take profit is not always the same as it depends on the market condition. Once the price reaches point B, you can close your trade or put your stop loss at the breakeven point. The ideal exit level is near point A, but the price can move above it if any massive force drives the market.
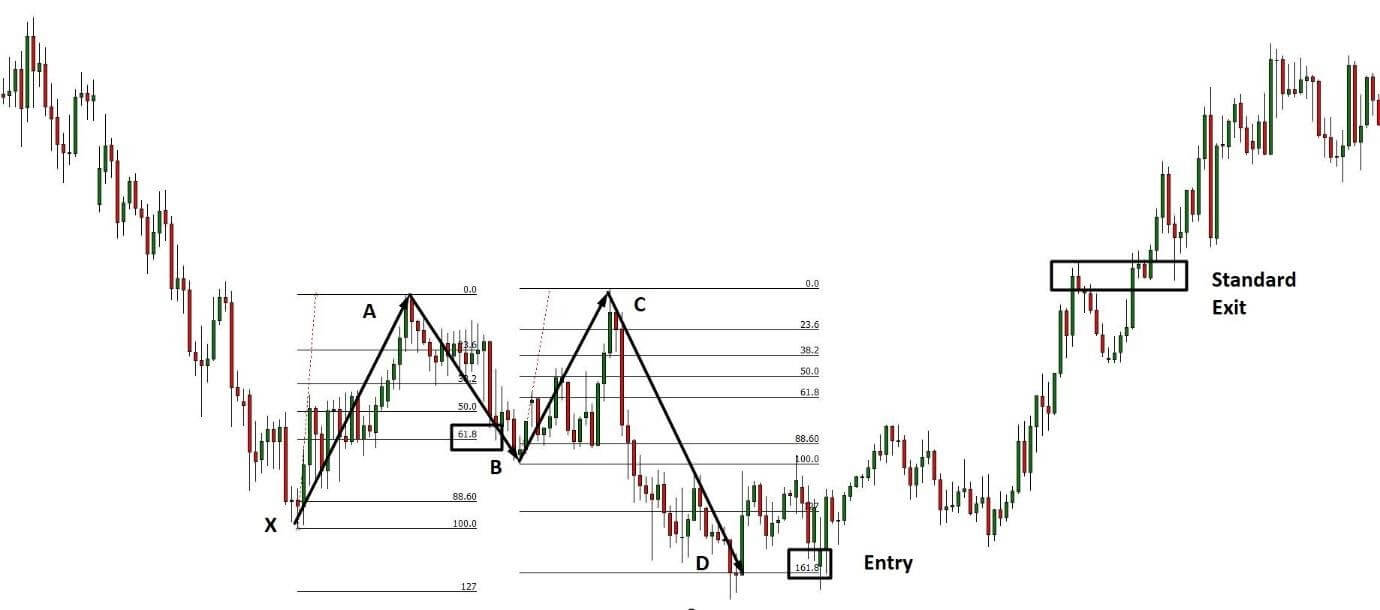
We can see how the Crab pattern forms in the bearish market and provides a decent profit with minimum risk in the above image.
Bearish strategy
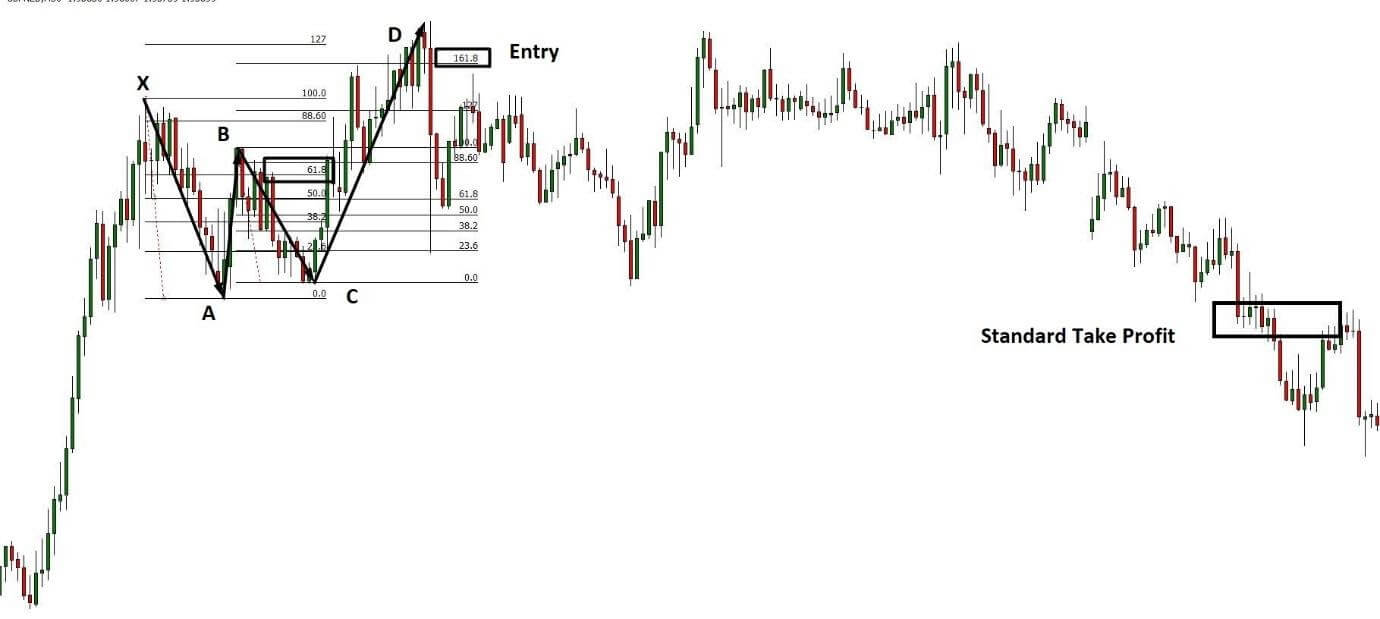
This type of pattern appears after a bullish move. Then, like the bullish pattern, when point D comes, the market looks like a primary bearish market, and the pattern confirms the continuation of the bearish movement.
After a whole bullish market, find the XA and check the validity by matching the Fibo retracement levels described above. Check all the conditions are proper till finding the point D.
-
Entry
Identify the point D and wait until the bearish candle forms. As soon as the bearish candle closes, place the sell order.
-
Stop loss
Among all the points, the D is the highest point. So place a stop loss above the D with a 10-15 pips buffer. That’s the standard buffer for a bearish movement.
-
Take profit
Take profit is not always the same as it depends on the market condition. Once the price moves down to point B, you can close your trade or put your stop loss at the breakeven point. The ideal exit level is near point A, but the price can move below it if any massive force drives the market.
Conclusion
Finally, different time frames may show the chart in different ways. Match the condition carefully before placing an order and check upper timeframe charts. Trade carefully during major fundamental trend-changing events like GDP, interest rate decisions, Central banks policy data, etc.


Comments