
The accumulation/ distribution line (ADL) is a unique indicator that uses the price movement with volume changes to assess whether it is in the accumulation or distribution phase. As a result, investors can anticipate the price by eliminating the weaker trend, as the definite trend should match the momentum from volume.
If you are interested in building a crypto trading portfolio using the accumulation/distribution trading indicator, we suggest you go through this content. Here, you will see how the accumulation and distribution phases come with a complete ADL trading strategy in the financial market.
What is the Accumulation/Distribution Line (ADL)?
It is a trading indicator that shows the comparison between the price movement and volume change so that investors can understand the movement’s strength. Usually, the price movement with the support from volume allows traders to consider it solid and reliable. On the other hand, if the price moves higher, but volume keeps falling, a divergence could lead the price to a reversal. In that case, the ADL indicator applies to continuation and reversal methods.
When we talk about the ADL trading strategy, investors should include other trading indicators to increase the accuracy to a satisfactory level. The common approach is to use the price action, candlesticks, and indicators with the ADL to make the strategy profitable.
How to trade using the ADL in trading strategy?
ADL helps traders to find how the supply and demand influence the price. This indicator is shown in a separate window in a dynamic line that can follow the price direction or remove to the opposite side.
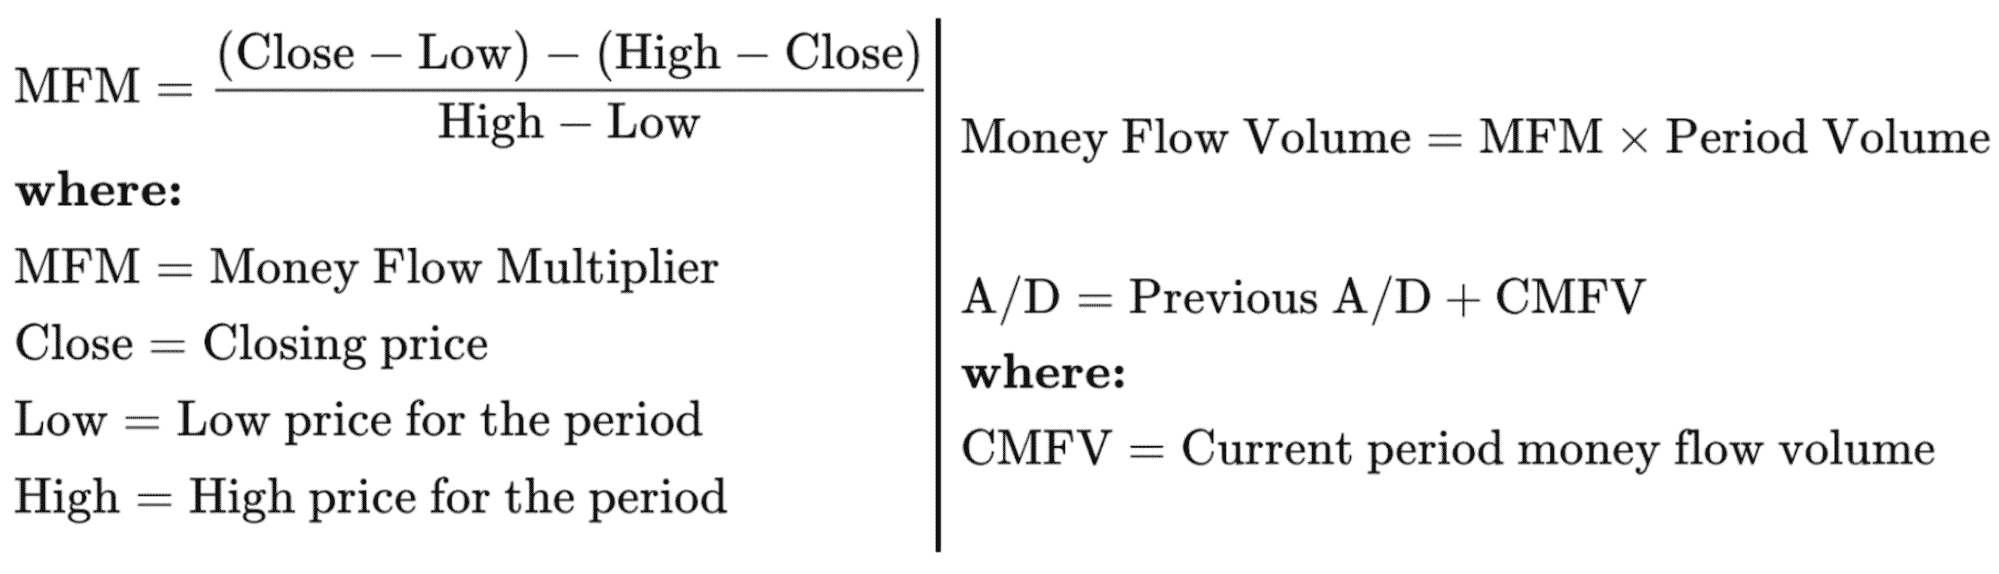
ADL formula
In the ADL calculation, the multiplier shows how strong the bullish or bearish sentiment is for a particular time. It considers the closing price of a candle, above or below the range with the support from volume.
- If the candle closes near the resistance of the range, ADL will move up.
- If the candle closes near the support of the range, the ADL will move down.
On the other hand, another approach is to find a bullish price with a downside pressure in ADL that will indicate a bearish reversal possibility. Conversely, if the price moves down, but ADL moves up, it will create a divergence leading to a bullish reversal.
Let’s see an example of ADL divergence from the BTC/USDT intraday chart.
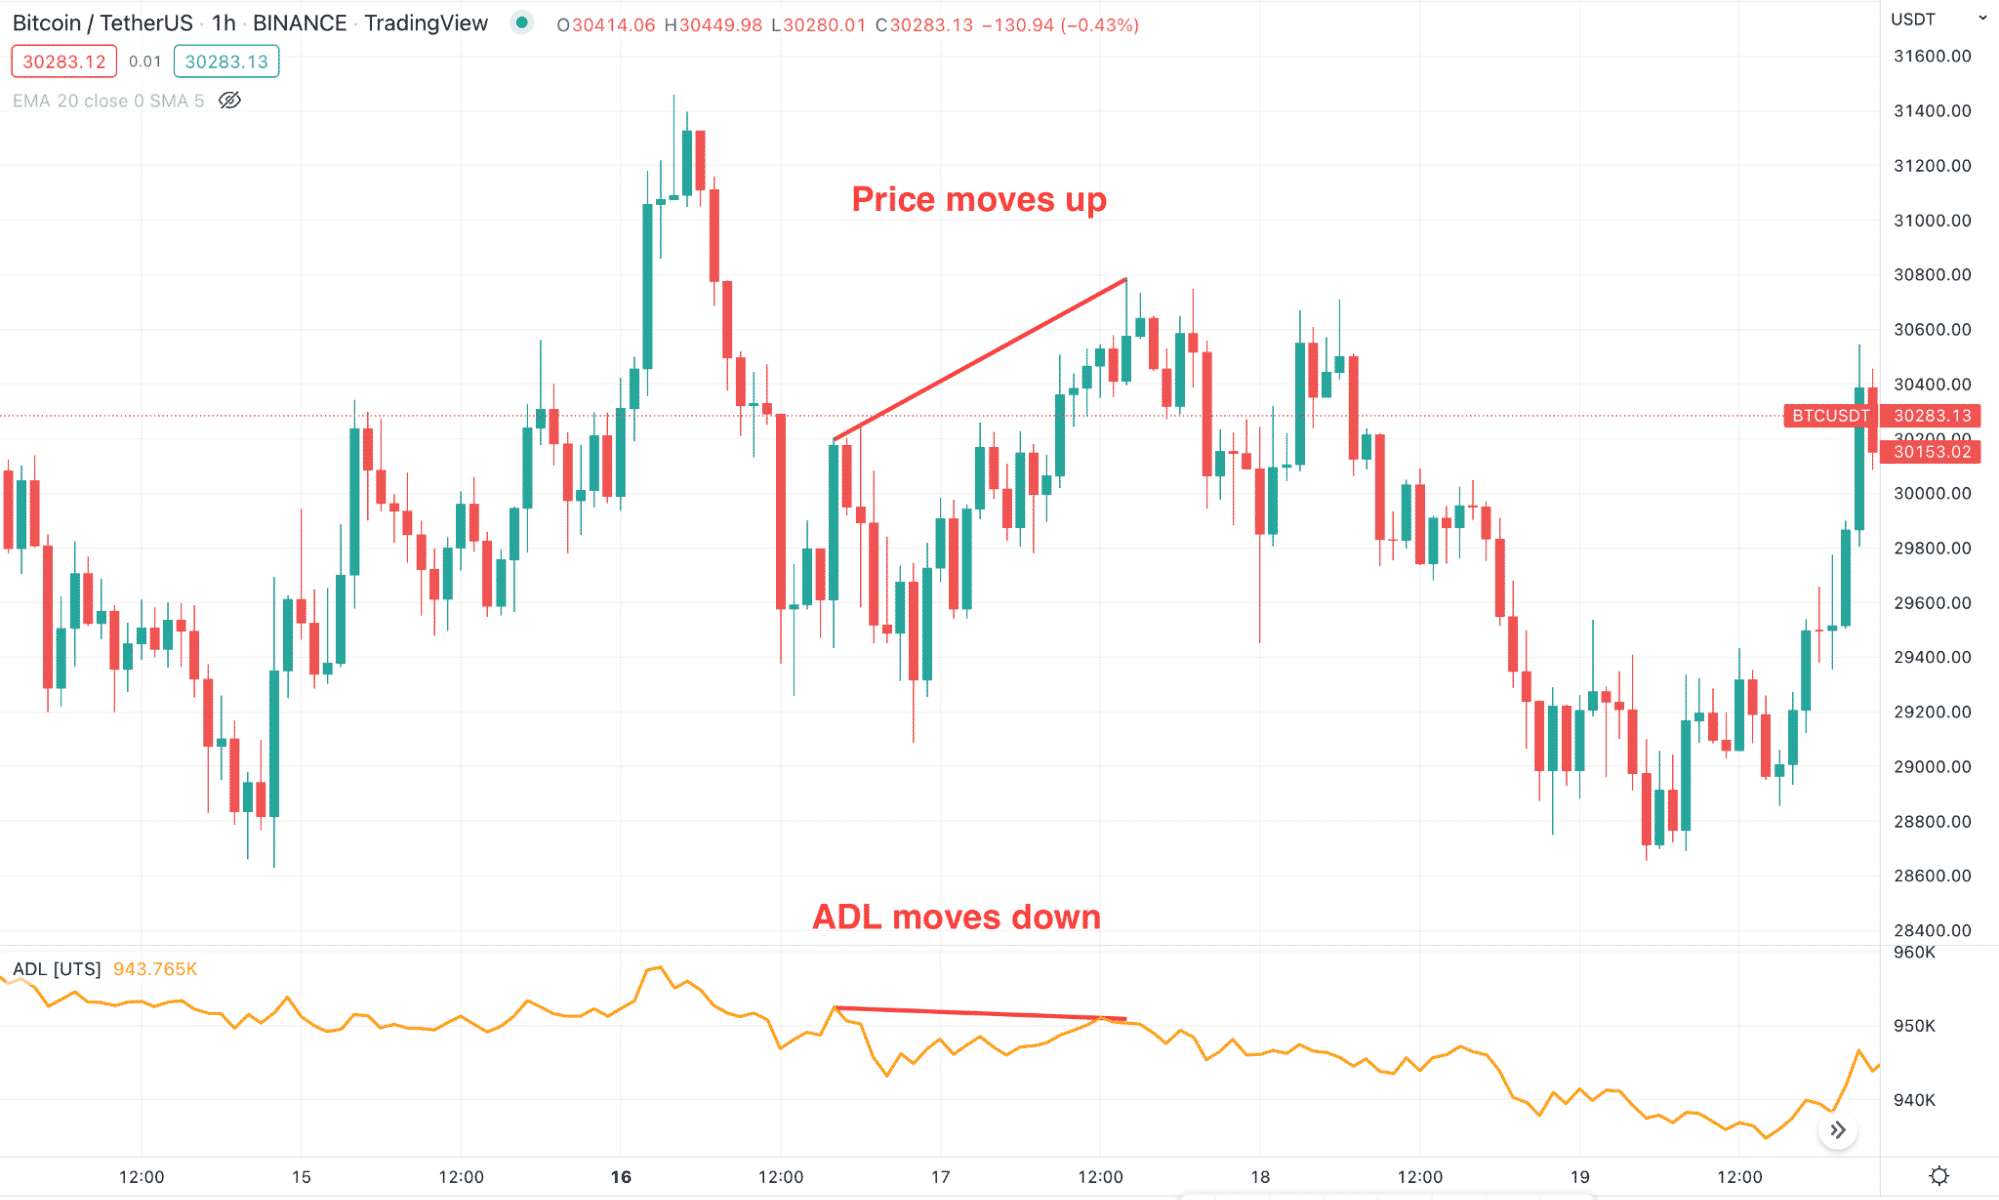
ADL divergence
A short-term trading strategy
In the ADL short-term trading method, we will see how to take the intraday trade on the H1 chart. This method will use 20 EMA as a dynamic support/resistance and MACD histogram besides the ADL.
Bullish trade scenario
As it is a lower-time frame trade, it should match the higher time frames direction. Therefore, the buy trade is valid once the price matches the daily time frame’s direction.
Entry
The trading entry is valid once these conditions are present:
- The daily trend is bullish where the price moves higher from the near-term support level where the gap between the current price and near-term resistance is high.
- In the H1 chart, the price shows a bullish rejection from the near-term support level and a bullish candle appeared above the dynamic 20 EMA.
- MACD histogram closes above the neutral zero line.
- ADL moves higher.
- Open the buy trade when the bullish candle closes above the dynamic 20 EMA.
Stop-loss
Stop loss will be below the near-term swing low with some gap.
Take profit
Close the 50% of the position after having 2X of the risk. Moreover, you can hold it for additional gain if the price action allows.
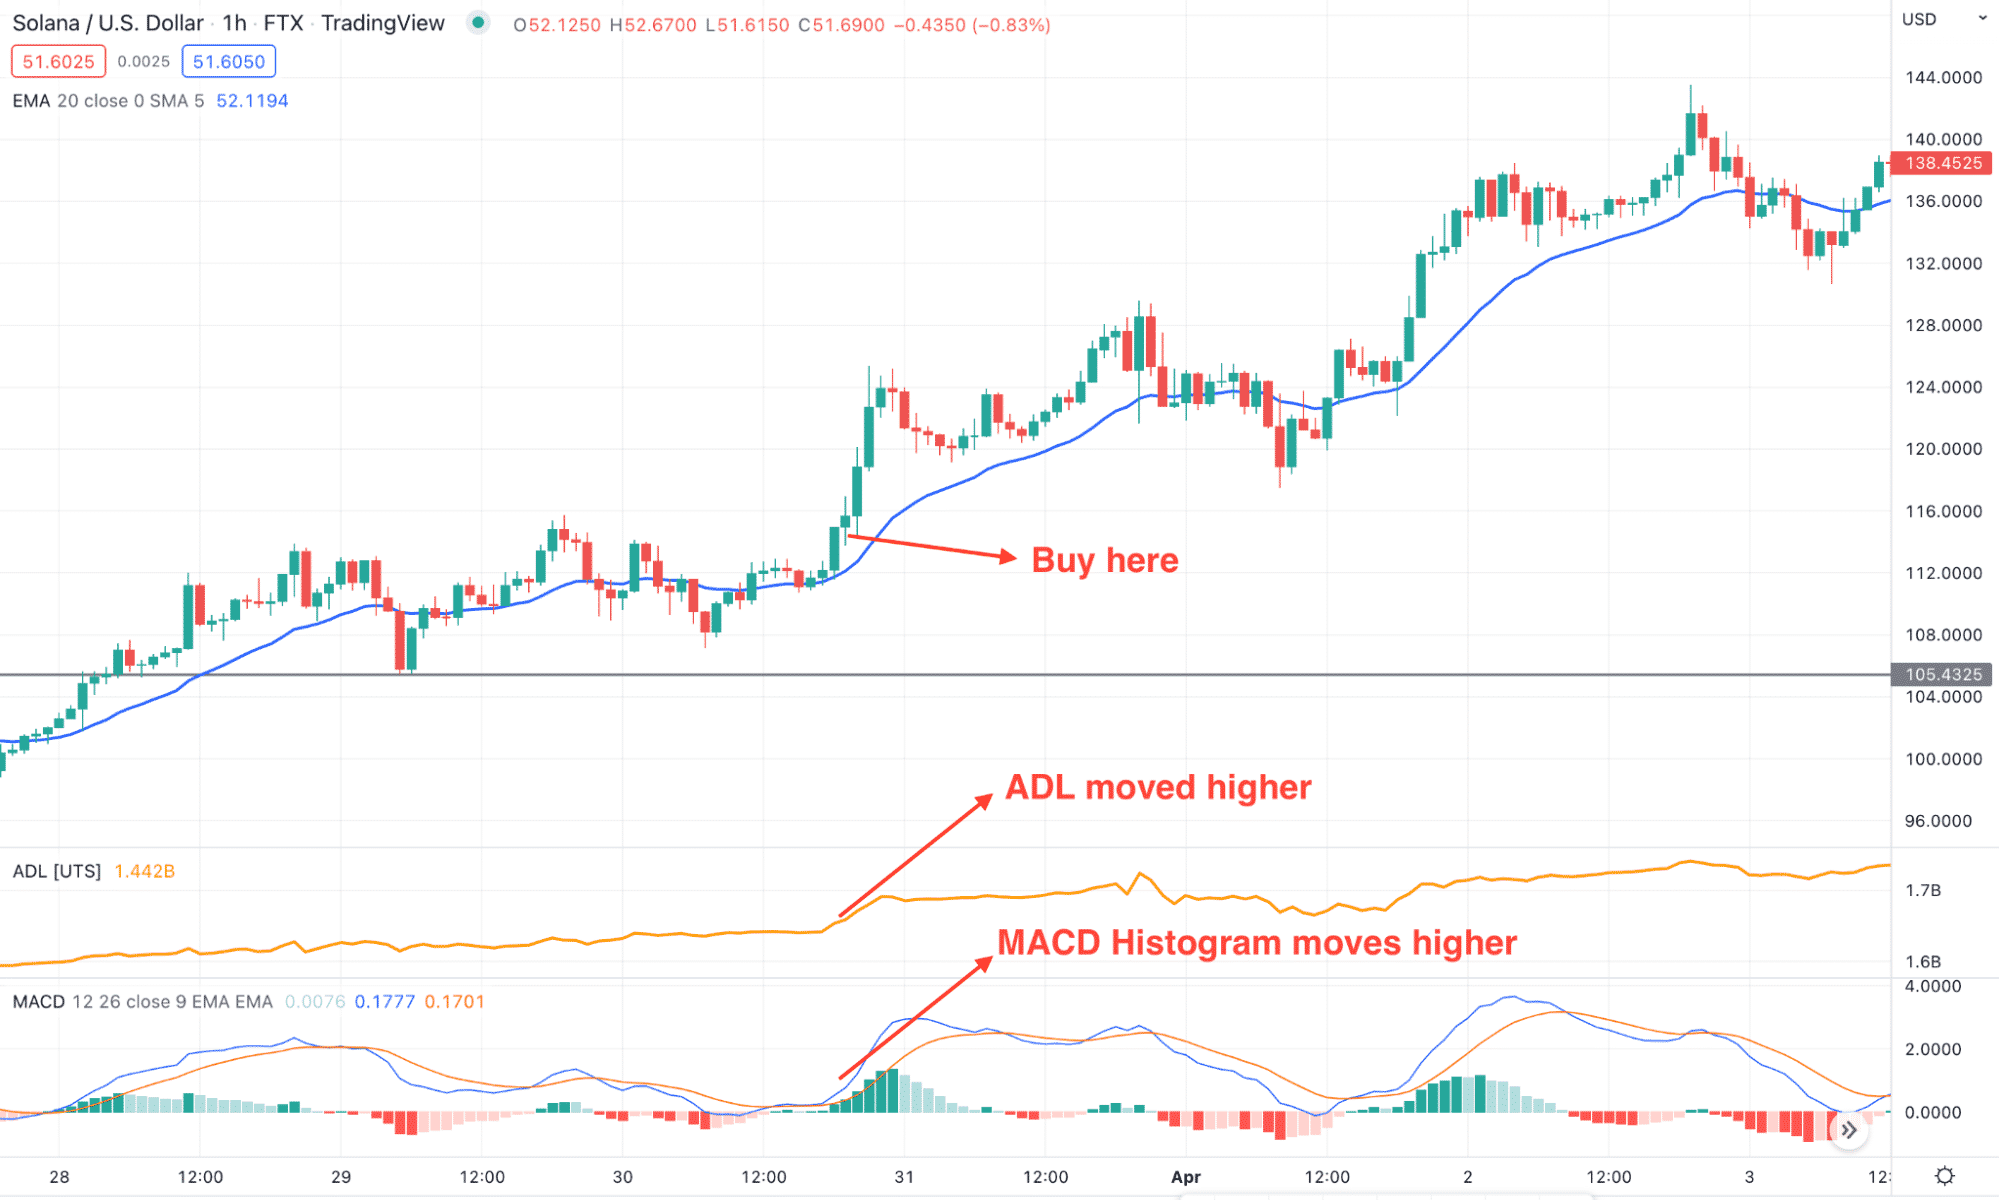
Short-term buy trade
Bearish trade scenario
It is the opposite version of the short-term bullish trade, where the sell trade is valid once the price matches the daily timeframe’s direction.
Entry
The trading entry is valid once these conditions are present:
- The daily trend is bearish where the price moves lower from the near-term resistance level where the gap between the current price and near-term support is high.
- In the H1 chart, the price shows a bearish rejection from the near-term resistance level.
- MACD histogram closes below the neutral zero line.
- ADL moves lower.
- Open the sell trade as soon as the bearish candle closes below the dynamic 20 EMA.
Stop loss
Stop loss will be above the near-term swing high with some buffer.
Take profit
Close the 50% of the position after having 2X of the risk. Moreover, you can hold it for additional gain if the price action allows.
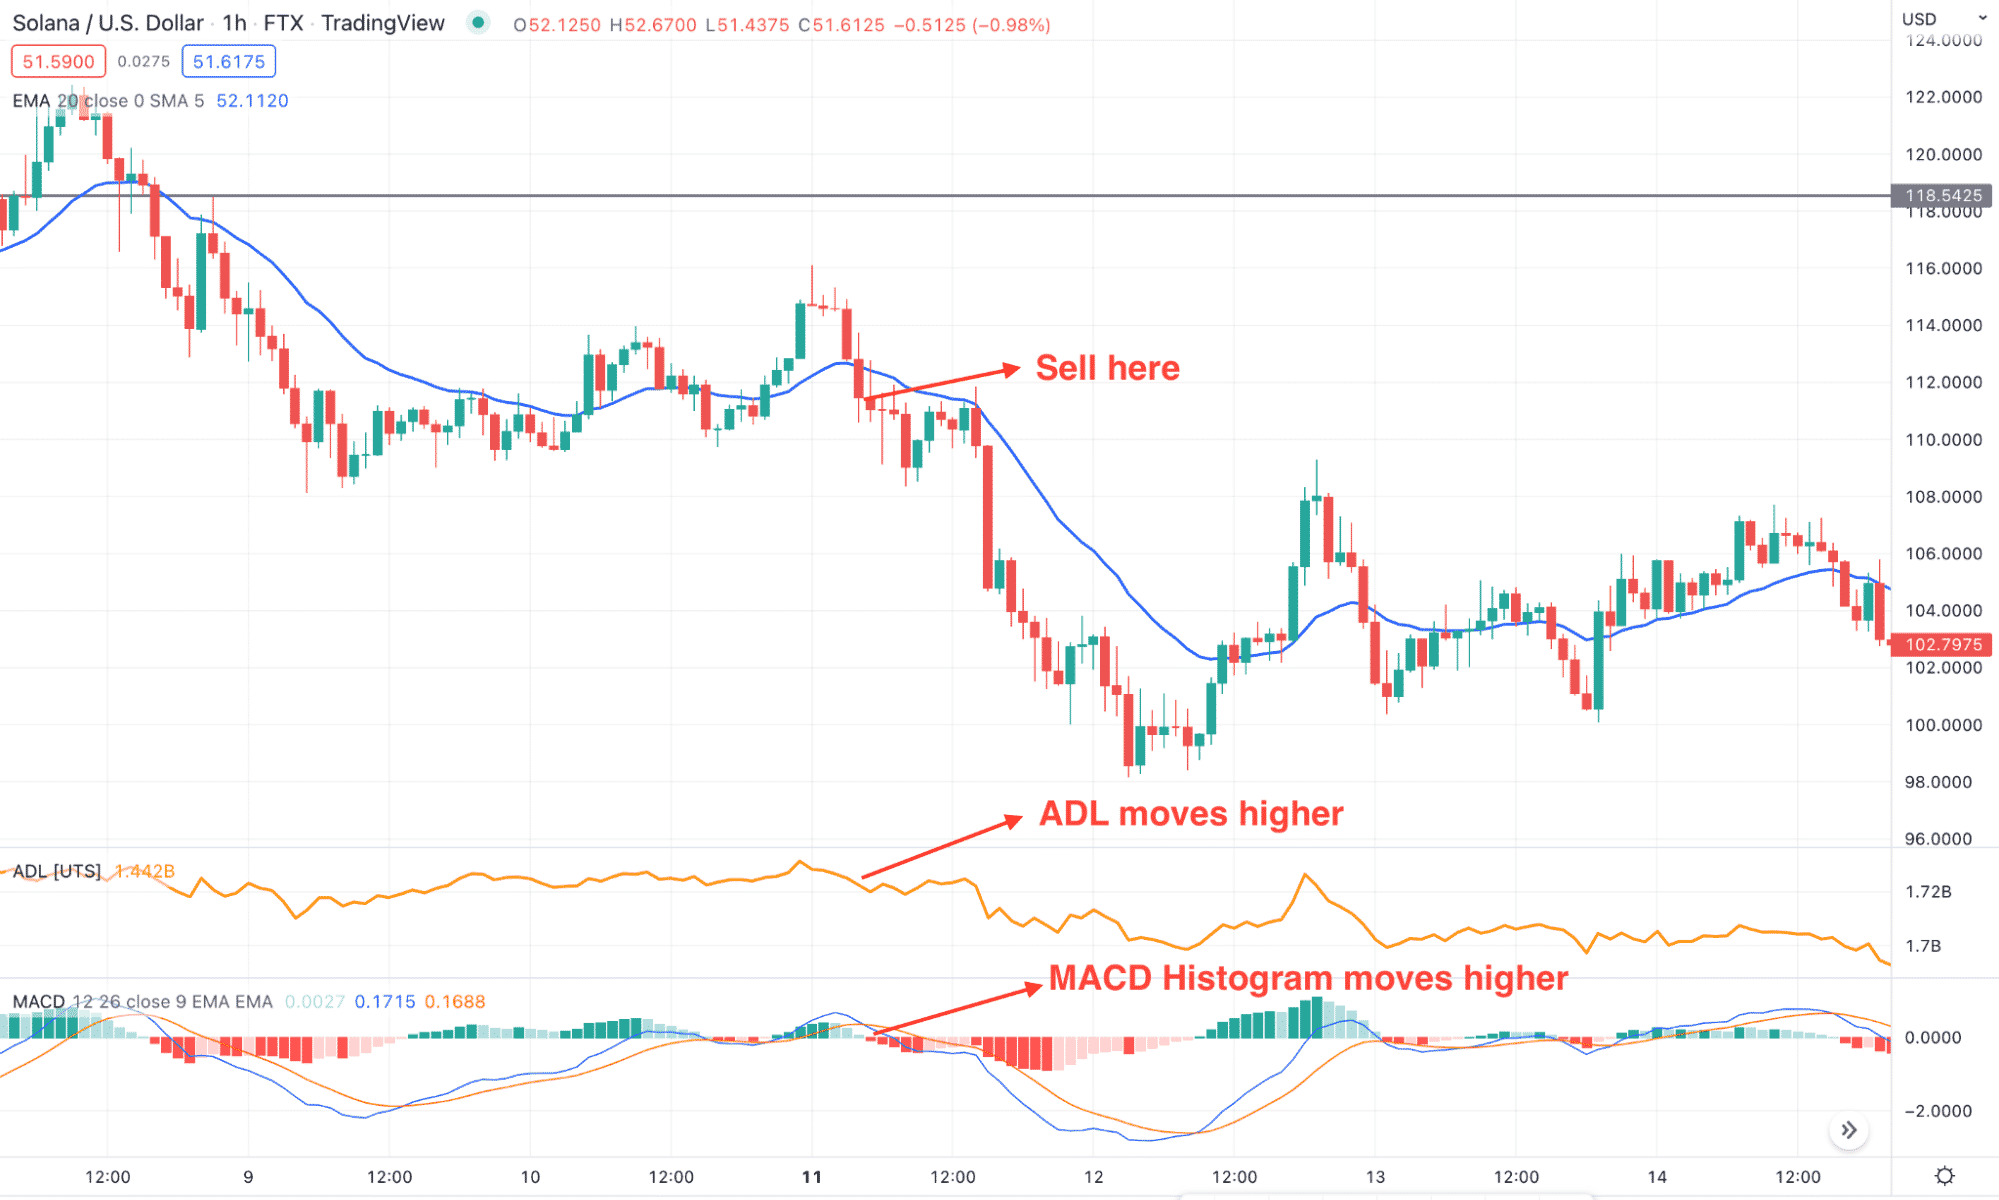
Short-term sell trade
A long-term trading strategy
We will find a major reversal in the long-term trading strategy once a divergence is formed between the price and ADL.
Bullish trade scenario
In the buy trade, investors should monitor the bearish market to identify the major reversal point with the divergence.
Entry
The long-term buy trade is valid once these conditions are present in the daily chart:
- The crypto bear market is running where the daily price shows multiple consecutive lower lows.
- Although the price is moving down, the selling pressure is weakening by moving the price correctively.
- A divergence appeared between the price and ADL, where the price moves lower, but ADL moves higher.
- Open the buy trade once the price closes a daily bullish candle above the dynamic 20 EMA.
Stop loss
The stop loss is below the swing low from where the divergence appeared.
Take profit
Like the short-term method, close 50% of the trade after reaching 1:1 risk vs. reward and keep the trade running until it reaches a significant resistance level.
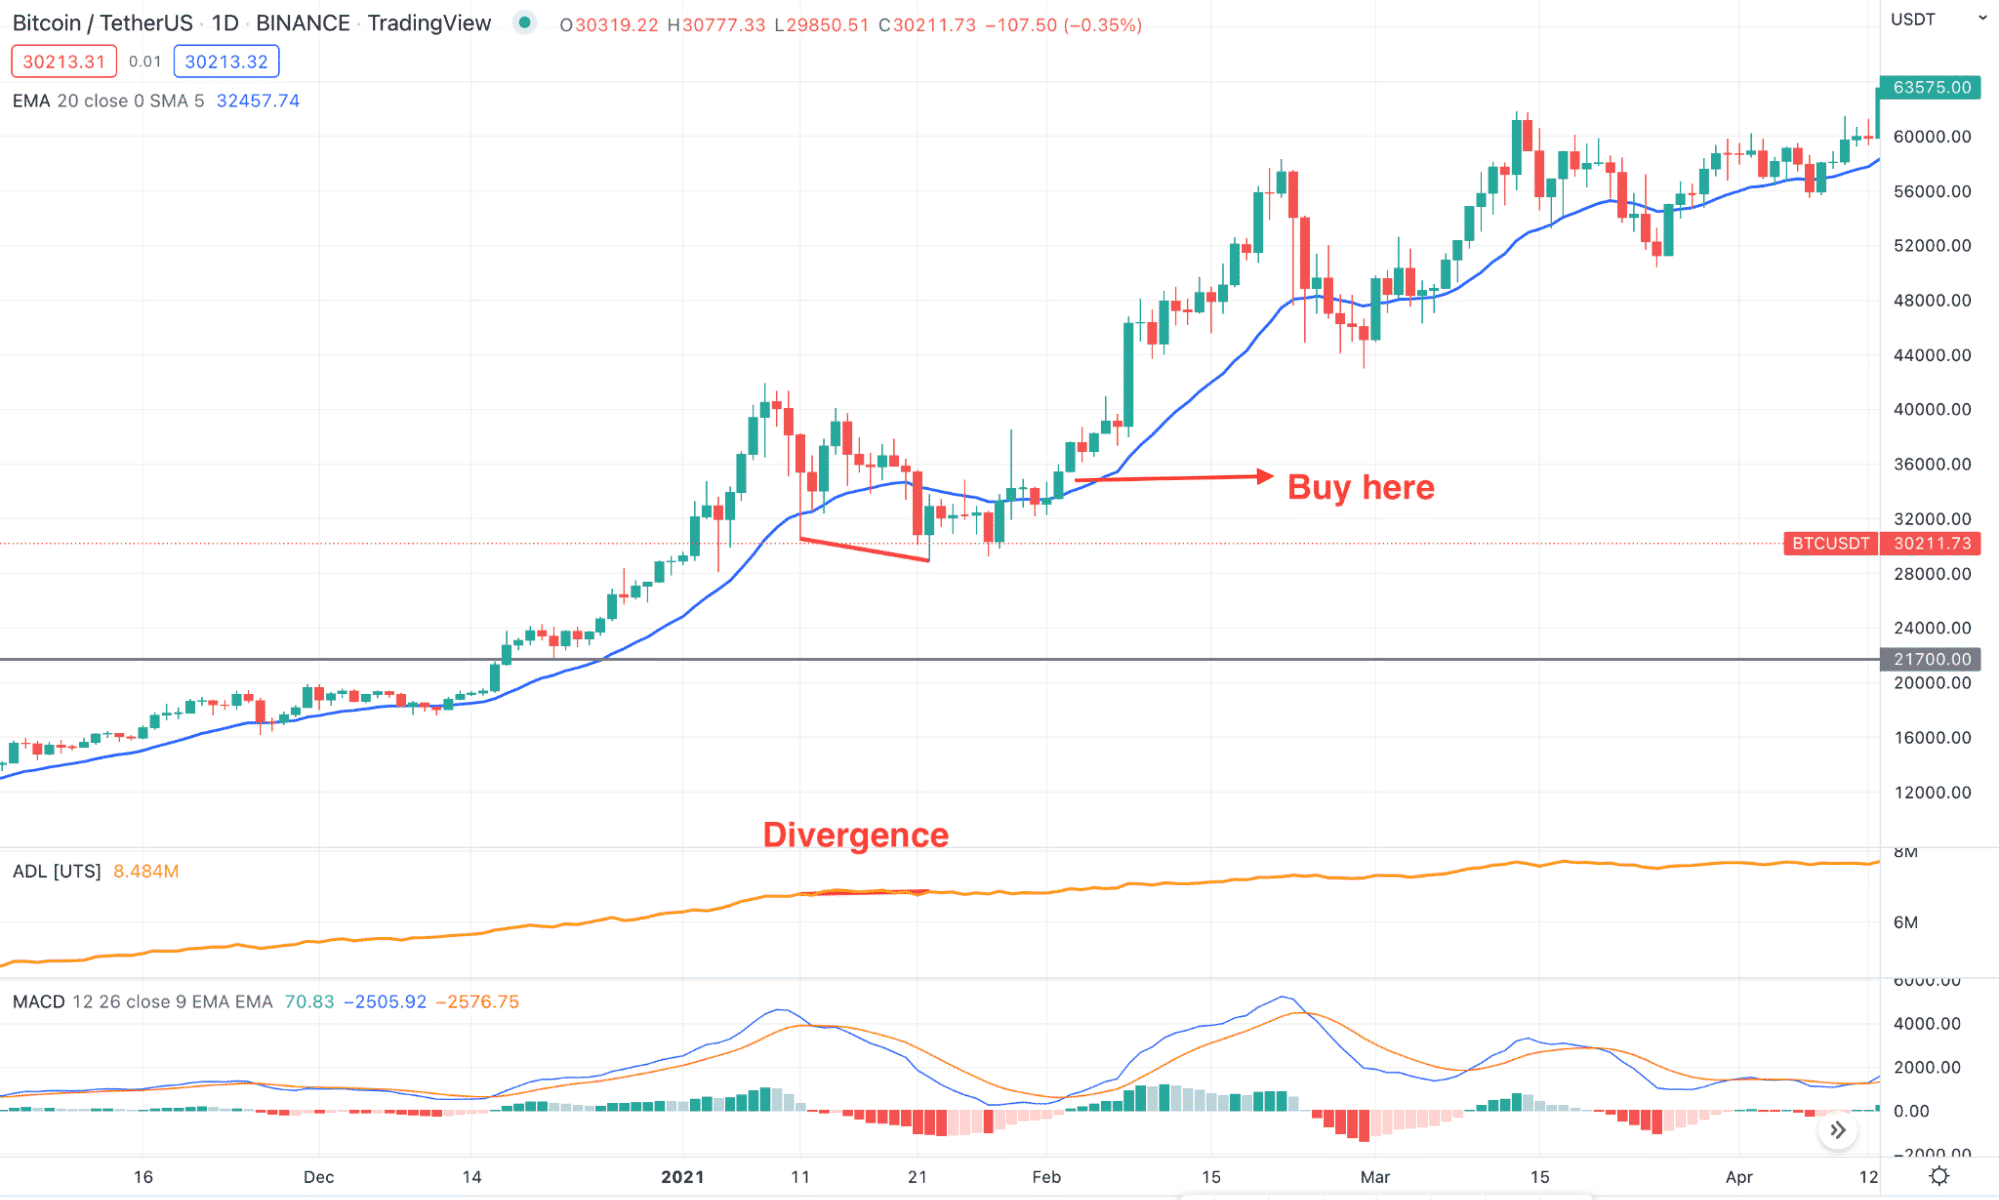
Long-term buy trade
Bearish trade scenario
Investors should monitor the crypto bull market to identify the major reversal point in the sell trade.
Entry
The long-term sell trade is valid once these conditions are present in the daily chart:
- The crypto bull market is running where the daily moves higher by making new swing highs.
- Although the price is moving up the bullish pressure is weakening.
- In the daily chart, the price moves higher but ADL moves lower.
- Open the buy trade once the price closes a daily bearish candle below the dynamic 20 EMA.
Stop loss
The stop loss is above the swing high from where the divergence appeared.
Take profit
Like the short-term method, close 50% of the trade after reaching 1:1 risk vs. reward and keep the trade running.
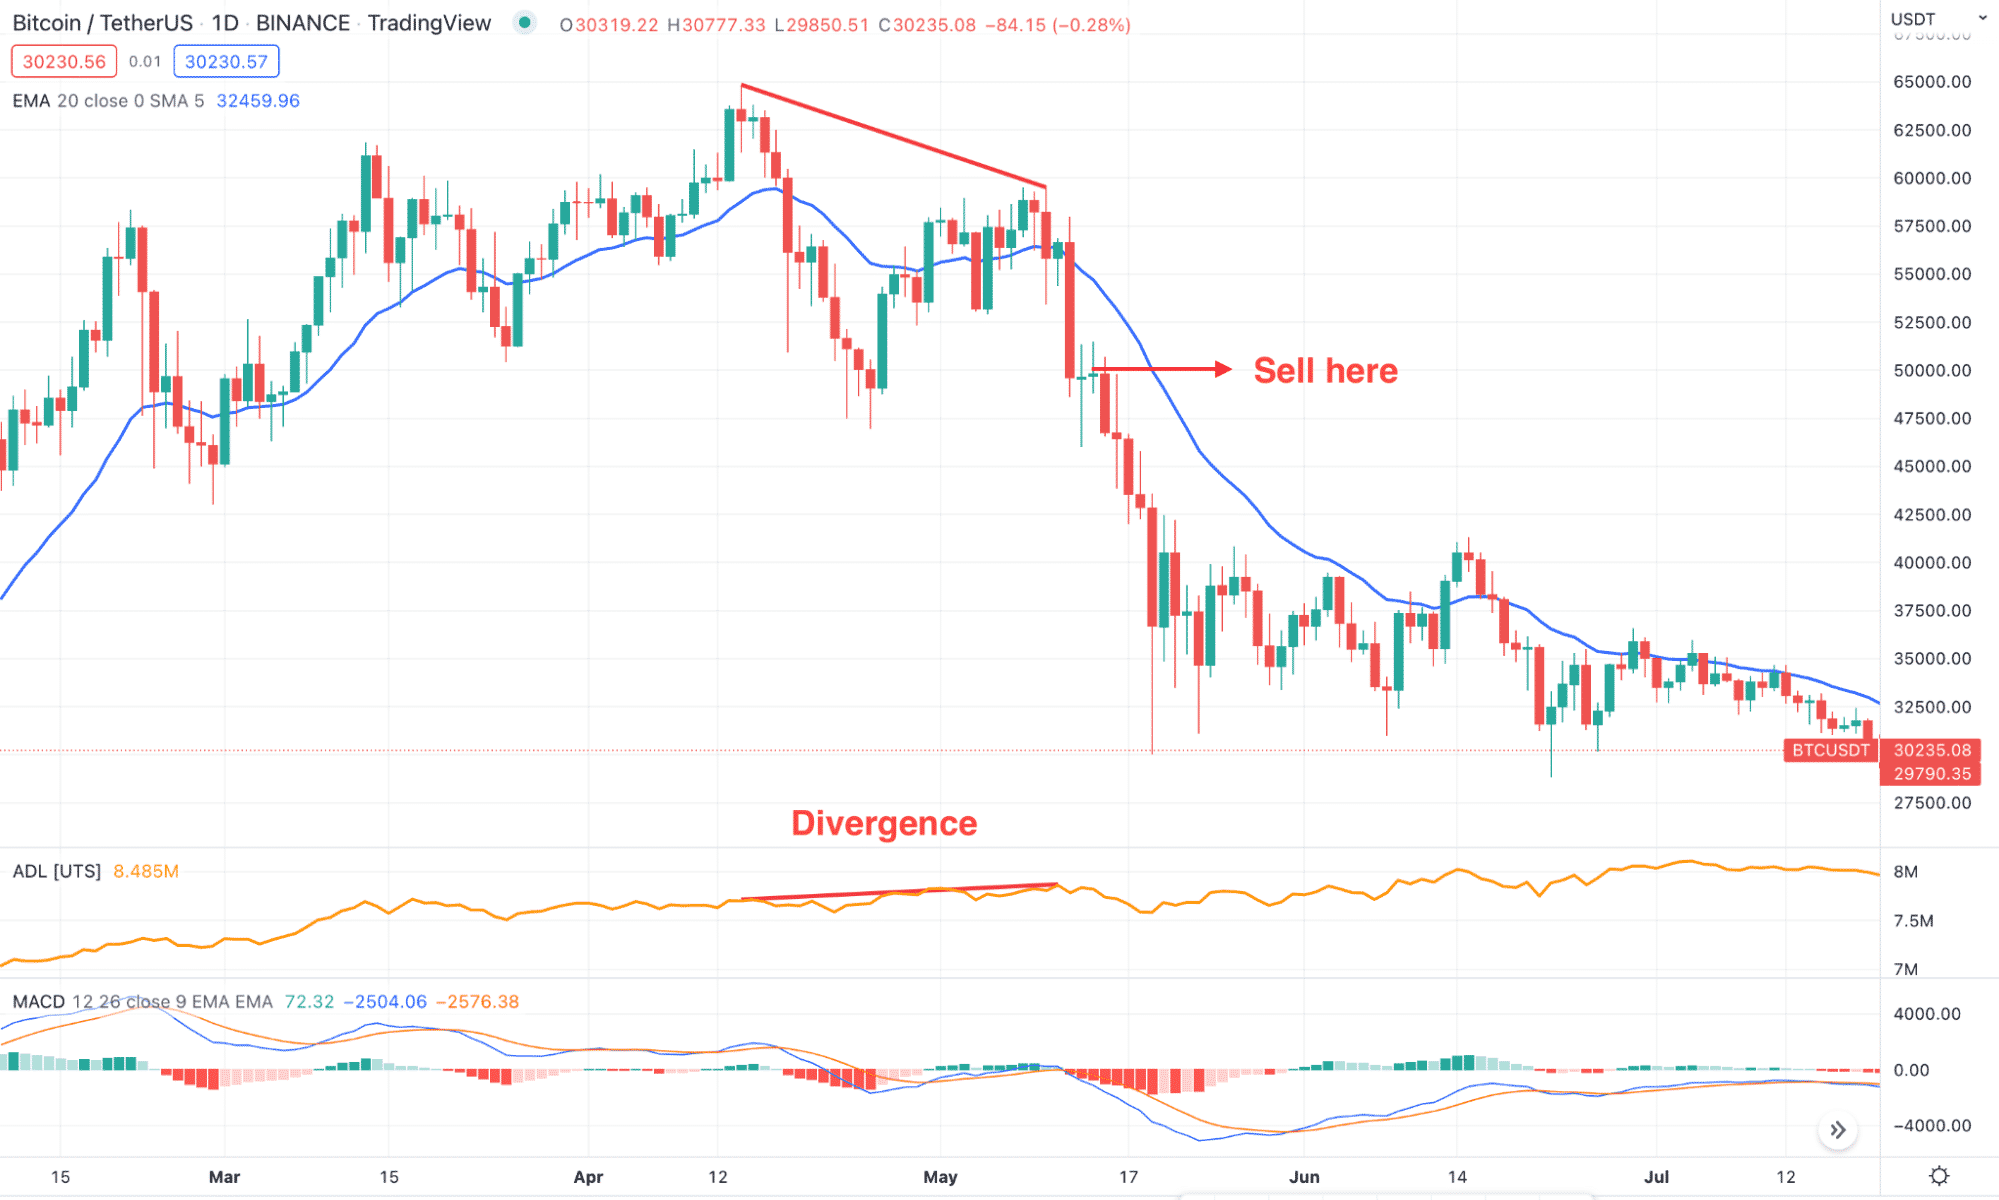
Long-term sell trade
Pros & cons
| 👍 Pros | 👎 Cons |
|
|
|
|
|
|
Final thoughts
Accumulation/Distribution Line (ADL) crypto strategy would be your solution to financial trading, where the ultimate result comes after having deep knowledge of risk management. The crypto market is a decentralized market with excessive volatility. Therefore, investors may experience uncertain market movements where making profits would be hard.


Comments