The volatility Breakout Channel trading system for MT4 is a profitable trend-following strategy that generates a modest profit from an ongoing trend. This system mainly focuses on following the more significant trend in any time frame to get price momentum.
Additionally, we will use multiple trading indicators line Average True Range (ATR) and Simple Moving Average (SMA) set-ups to increase trading possibilities.
What is volatility?
It is a mathematical calculation of the diffraction of returns for selected currency pairs. Habitually, volatility is estimated as either the standard deviation or change within returns from those similar assets or currency pairs. Most of the time, the higher volatility indicates that the asset is very much riskier.
Market movements are significantly smaller in the forex because of the high liquidity, which results in lower volatility. A vast percentage of the market participants are trading in FX simultaneously. As a result, small movements up and down in the price.
However, sudden and big movements can be tracked in the FX because it depends on fundamental events, such as social and economic events, politics, etc.
Volatility Breakout Channel trading system for MT4
As a trend riding strategy, first, we will have to identify the primary trend in the higher time frame. The stronger the trend was, the higher the accuracy we can get. An analyst can predict the market by 70%-80%.
However, the FX is unpredictable. That’s why the only way to hold down in the market is to build a robust trading strategy with higher accuracy using various indicators.
Let’s have a look at trading indicators for this trading system:
- ATR (30) with EMA 5
- ATR (14) with EMA 4
- 30 SMA apply high
- 30 SMA apply low
ATR
It is a technical indicator that calculates market volatility by breaking down the undivided extent of a security price for that period. In the book called “New Concepts in Technical Trading System,” which was written by the market technician J.Welles Wilder Jr., the ATR volatility indicator was introduced.
SMA
In technical analysis, SMA is one of the critical indicators. SMA indicates the closing price of a stock’s average within a particular period. The stock price constantly shifts; hence the moving average shifts in that consequence, thus the average is called “moving.” Moreover, it is typically the most effortless moving average to formulate.
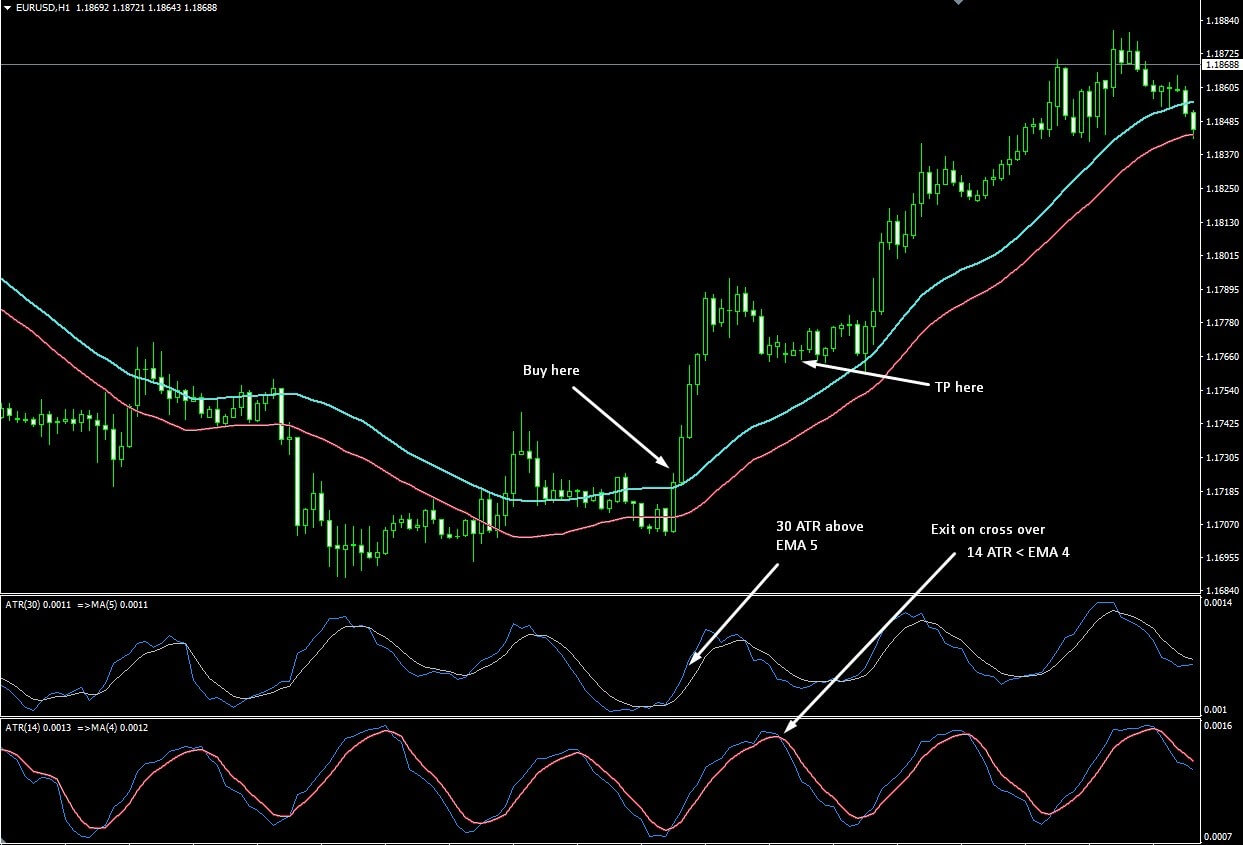
Let’s have a look at the visual illustration of these indicators.

EUR/USD chart
Bullish trading strategy
The volatility Breakout Channel trading system is appropriate on all time frames from five minutes to daily. The one hour and the four hours give high returns as they extract the short-term impacts of the economic events.
However, you can trade on any currency pairs you wish, such as:
- GBP/USD
- GBP/CAD
- GBP/NZD
- EUR/JPY
- GBP/JPY
- USD/JPY
- EUR/USD
- EUR/CAD
- EUR/NZD
Bullish trading conditions
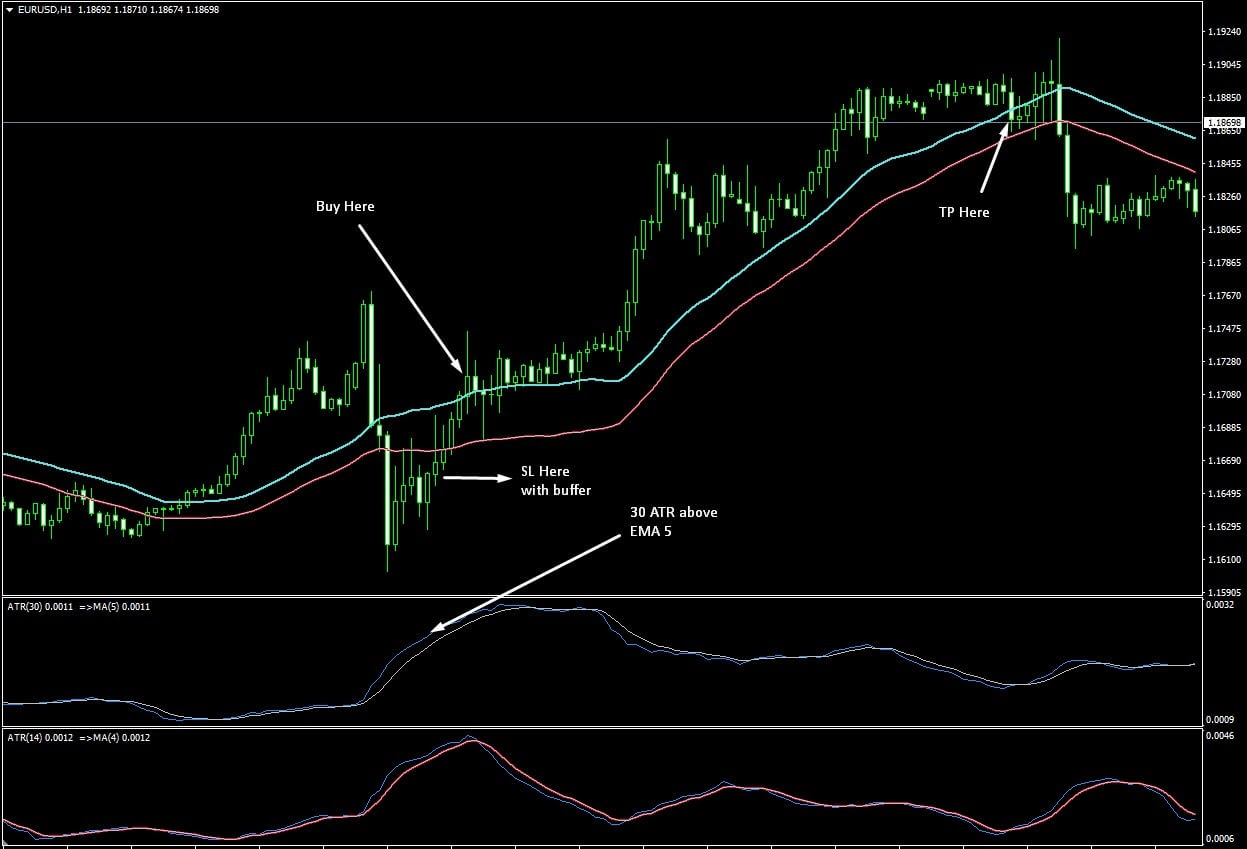
- The price closes above the upper band or 30 SMA high
- ATR > EMA 5

EUR/USD chart
Entry
After confirming all the trading conditions, you should wait for the candle to close and execute the buy trade as soon as the candles close. Do not enter before closing the candle because it may impact your capital if the trade goes against you.
Stop loss
The stop loss should be below the swing low or below the 30 SMA low with a 10-15 pips buffer in the H4 time frame and a 5-10 pips buffer on the H1 time frame.
Take profit
The ideal “take profit” level for this trading strategy is the next fundamental level from where the price may reverse. Moreover, when the price makes a new higher high, you should trail the stop loss to breakeven to make the trade risk-free.
On the other hand, you can wait for the price to break below the 30 SMA high to close the position. Also, you can close the trade when ATR (14) < EMA 4.
Bearish trading strategy
The bearish trading strategy is also applicable on all time frames from five minutes to daily, where one hour and four hours provide the ideal outcomes as it extracts the short-term dominance of the fundamental news.
However, you can trade on any currency pairs you wish, such as:
- GBP/USD
- GBP/CAD
- GBP/NZD
- EUR/JPY
- GBP/JPY
- USD/JPY
- EUR/USD
- EUR/CAD
- EUR/NZD
Bearish trading conditions
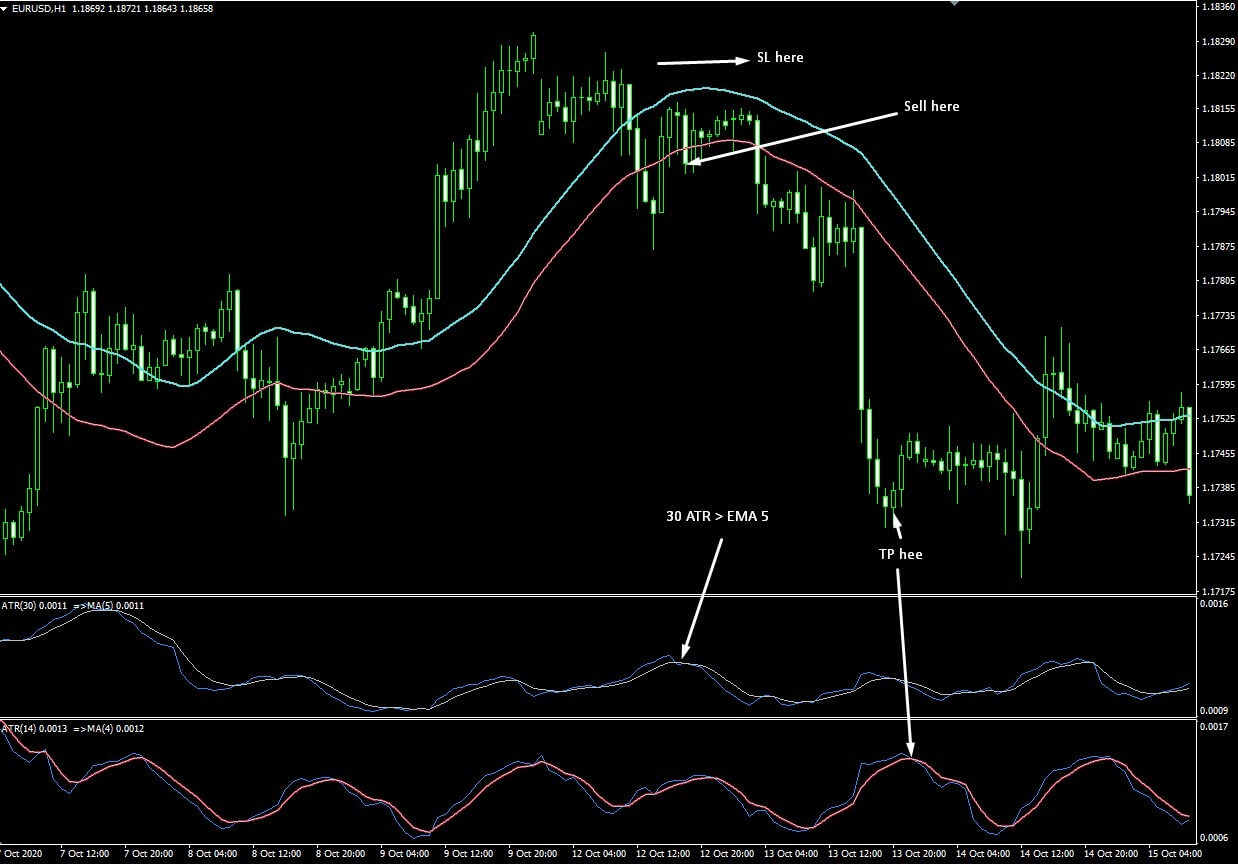
- The price closes below the lower band or 30 SMA low
- ATR > EMA 5

EUR/USD chart
Entry
After confirming all the trading conditions, you should wait for the candle to close and execute the sell trade as soon as the candles close. Do not enter before closing the candle because it may impact your capital if the trade goes against you.
Stop loss
The stop loss should be above the swing high or above the 30 SMA high with a 10-15 pips buffer in the H4 time frame and a 5-10 pips buffer on the H1 time frame.
Take profit
The ideal “take profit” level for this trading strategy is the next fundamental level from where the price may reverse. Moreover, when the price makes a new lower low, you should trail the stop loss to breakeven to make the trade risk-free.
On the other hand, you can wait for the price to break above the 30 SMA low to close the position. Also, you can complete the trade when ATR (14) < EMA 4.
Final thoughts
This system is the most profitable trading method as it depends on highly accurate indicators. Therefore, you can get better trading results at the end of the month. However, in forex trading, there is no 100% guaranteed profit in each trade.
In this manner, the trading system is very profitable in any time frame. Therefore, you should follow multiple trades to determine their accuracy. Moreover, to get a better outcome from this trading strategy, you should utilize the proper money management system and better psychological states.


Comments