
One of the inevitable parts of the financial market is technical indicators. Traders and investors rely on many indicators while executing trades. So no wonder some of them become popular for various positive features. The KDJ indicator is one of the preferable technical indicators.
This article will introduce you to the KDJ indicator. Additionally, it contains the most potential trading techniques with chart attachments using the KDJ indicator for better understanding. However, it is mandatory to learn the computation technique besides understanding indicator components while deciding to use that indicator to execute successful trades.
What is the KDJ indicator?
It is a unique technical tool with the design purpose of making trade decisions effortlessly. You can use it to determine trends and identify optimal entry/exit points if trades. It is a ubiquitous technical tool for trend analysis and swing points. Many traders also consider it a random index. The KDJ indicator shares similarities with another popular trading indicator, the stochastic oscillator.
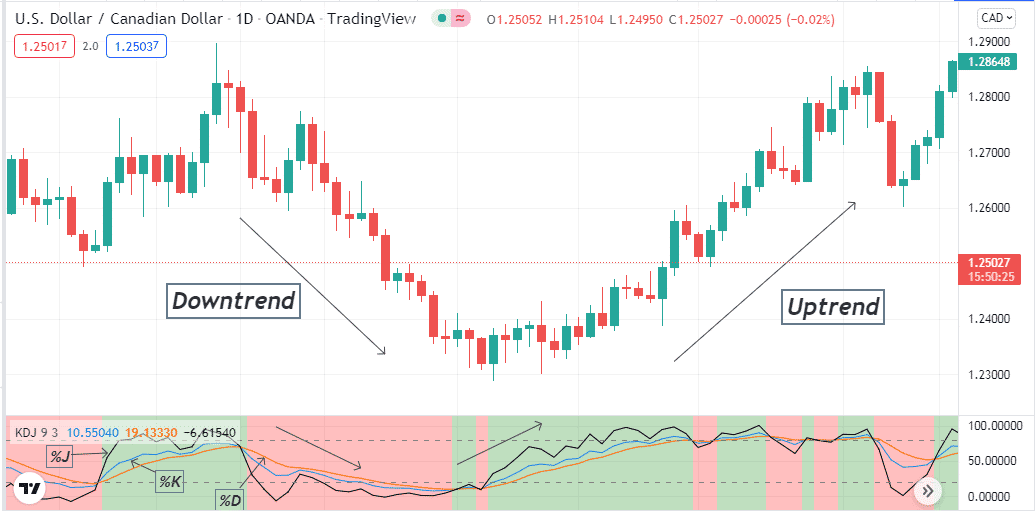
The KDJ indicator on a daily chart of USD/CAD
The primary difference is it has three dynamic lines, whereas the stochastic oscillator has only two. It shows the reading on an independent window and oscillates between 0-100 values.
This indicator has a default oversold level near the 20% of the window and when it rises on the upside near 80% declares that the price reaches an overbought level. Three lines this indicator contains %D, %K and %J. Whereas the %D and %K remain in the range of oversold and overbought, the %J line can reach beyond those levels.
How to use the KDJ indicator in trading strategy?
The indicator is easy to use when you know all the components. The three dynamic lines usually change with the price movement, and crossover between these lines declares trends and trend shifting points. When these lines come together, it states a trend-changing force initiates.
The %J and %K line reaches above the %D line, it indicates a bullish trend starts, and as long as the bullish trend remains intact, these lines stay this way. The exact opposite crossover between these lines means seller domination on the asset price.
When the %D and %K line reaches the upper (80) level and the %J line crosses beyond that level, it declares the price reaches an overbought level besides signaling an upcoming declining pressure on the asset price. Meanwhile, it declares the exact opposite signal when the appearance is the opposite of these lines.
A short-term trading strategy
This short-term trading strategy contains the HMA (20) line beside the KDJ indicator. Both indicators declare bullish pressure on the asset price to open a buy position, and it suggests opening a sell position when both indicate bearish pressure on the asset price. We recommend using this method on a 15-min or hourly chart to catch the most potent short-term trades.
Bullish trade scenario
When the KDJ lines reach the oversold level, observe when:
- The %K line crosses above the %D line.
- The %J line crosses above the %D and %K lines.
- The price candle reaches and closes above the HMA line.
- The HMA line starts sloping on the upside.
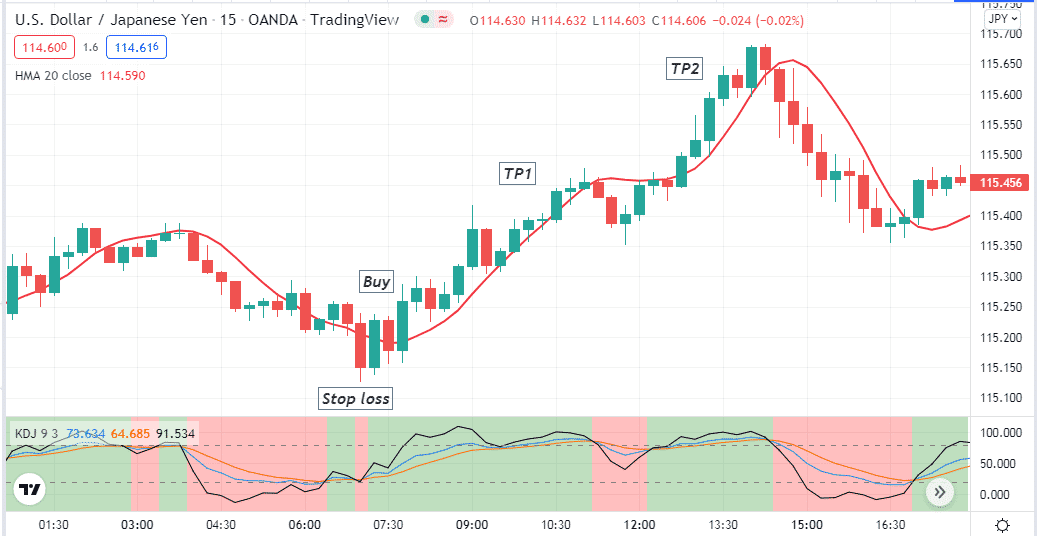
Bullish setup
Entry
When these conditions match your target asset chart, it suggests opening a buy position.
Stop loss
Place an initial stop loss below the recent swing low with a buffer of 5-10pips.
Take profit
Close the buy position when:
- The %J line crosses beyond the overbought level.
- The %K line crosses below the %D line.
- The HMA line starts sloping on the downside.
Bearish trade scenario
When the KDJ lines reach the overbought level, observe when:
- The %K line crosses below the %D line.
- The %J line crosses below the %D and %K lines.
- The price candle reaches and closes below the HMA line.
- The HMA line starts sloping on the downside.
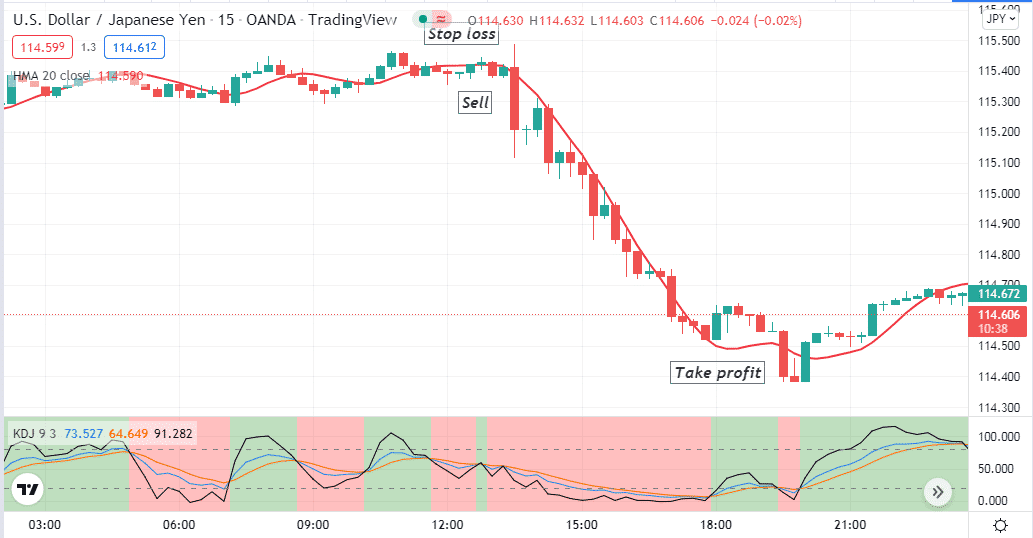
Bearish setup
Entry
When these conditions match your target asset chart, it suggests opening a sell position.
Stop loss
Place an initial stop loss above the recent swing high with a buffer of 5-10pips.
Take profit
Close the sell position when:
- The %J line crosses beyond the oversold level.
- The %K line crosses above the %D line.
- The HMA line starts sloping on the upside.
A long-term trading strategy
We use the RSI indicator, a most popular momentum indicator, alongside the KDJ indicator in our long-term trading strategy. Both indicators show results in independent windows. You already know the KDJ indicator has an overbought level near 80 and an oversold level near 20.
Meanwhile, the RSI indicator has an overbought level near 70 and an oversold level near 30. We use these combinations to generate our trading positions. For identifying long-term trading, positions use an H4 or above chart.
Bullish trade scenario
When both indicator readings show the price reaches the oversold level, seek to open a buy position when:
- The %K line crosses above the %D line.
- The %J line crosses above the %K and %D lines.
- The RSI dynamic line is near the central (50) line heading toward the upside.
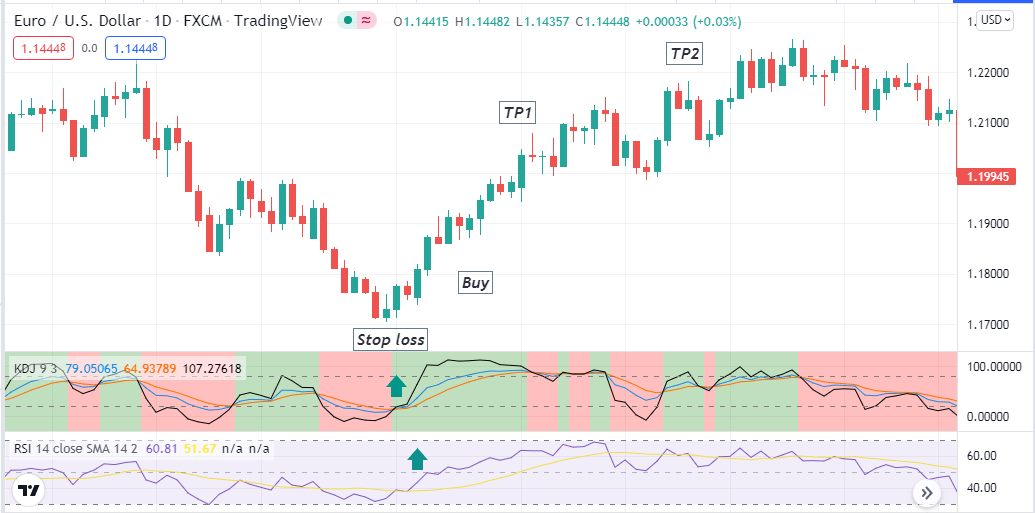
Bullish setup
Entry
These conditions above declare sufficient bullish momentum on the asset price and indicate opening a buy position.
Stop loss
Place a reasonable stop loss below the bullish momentum.
Take profit
Close the buy position when both indicators suggest the bullish momentum is fading. Observe when:
- The %K line crosses below the %D line.
- The %J line reaches beyond the upper (80) level or starts declining after reaching that level.
- The RSI line reaches the overbought (70) level or stat sloping on the downside.
Bearish trade scenario
When both indicator readings show the price reaches the overbought level, seek to open a sell position when:
- The %K line crosses below the %D line.
- The %J line crosses below the %K and %D lines.
- The RSI dynamic line is near the central (50) line heading toward the downside.
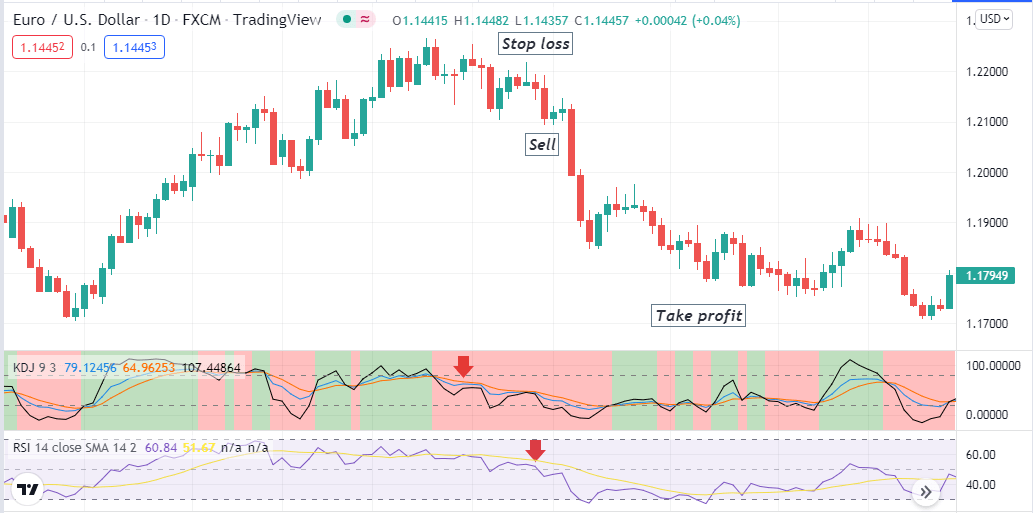
Bearish setup
Entry
These conditions above declare sufficient bearish momentum on the asset price and indicate opening a sell position.
Stop loss
Place a reasonable stop loss above the bearish momentum.
Take profit
Close the sell position when both indicators suggest the bearish momentum is fading. Observe when:
- The %K line crosses above the %D line.
- The %J line reaches beyond the lower (20) level or starts bouncing upside after reaching that level.
- The RSI line reaches the oversold (30) level or stat sloping on the upside.
Pros and cons
| 👍 Pros | 👎 Cons |
|
|
|
|
|
|
Final thought
Finally, we describe all primary info about the KDJ indicator in this article. We hope you find this article sufficiently informative and educative to start trading using the indicator. Don’t forget some demo practicing before applying any trading methods with the KDJ indicator on live trading.


Comments