Island reversal is a pattern with a candlestick gap. When a trending move reaches its final destination, it struggles to move more where Island reversals constantly appear. The candle emergence looks like an island.
The island strategy is mostly rationalized by pre-market incidents driven by news. The ascending volume of the first and the following gap indicates a robust Island pattern.
Moreover, it is a price pattern featuring a combination of days divided into both sides through the price action gap on a daily chart. The pattern depicts that potential price reversal, no matter what the trend is showing currently, is from upside to downside or downside to upside.
What is the Island reversal pattern?
Though this figure is not so popular yet, the potentials accentuate the attention of many traders. The market participants anticipate future movements with the help of the Island system. It is a remarkable method of trading and appears when a group of trading days is outlaid through distinct price action gaps.
This trading method comprises combinations gaps in buying or selling side.
However, the signals indicated by this pattern imply that prices can be reversed regardless of the current market trends. Also, the placement of the gaps is essential for defining the trend. If a gap down comes after a gap up, it is an up sign in the price.
An Island system may emerge both at the high and low. If the Island is above the gap, it is a bullish reversal indication; besides, it is bearish if the pattern is below the gap.
How to use Island patterns in trading strategy?
Finding the Island is straightforward and may be bullish or bearish.
Bullish pattern
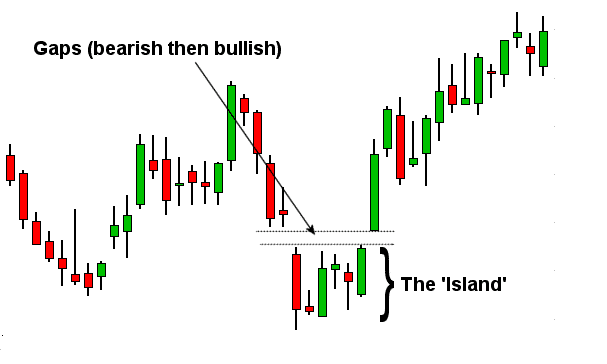
The buying Island pattern emerges within a bearish trend to reverse it and it takes no hard work to predict this. It is significant to pay heed to the potentiality of the selling pressure. A negative gap should be there, which indicates the beginning of a reversal. After defining the gap, you just need to observe the market behavior persistent along with the downtrend movement or is it combining.
Also, after an upward movement, the price ought to retreat while the area of the gap stays intact. It produces a positive gap after trading under the gap for a while and after the emergence of the price action. Generally, it emerges at the price level or pretty near to where the first gap has emerged.
Bearish pattern
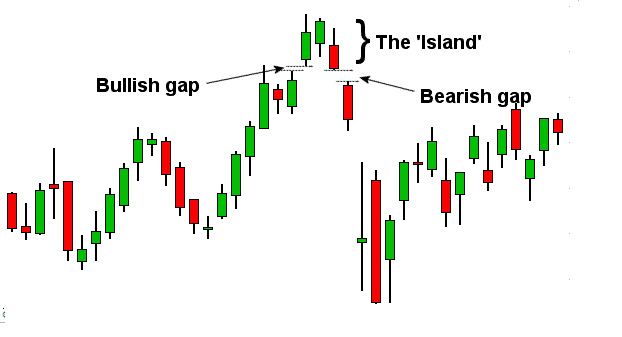
A bearish pattern emerges within a buy trend. A bearish pattern needs the availability of the upside pressure with a major positive gap. The important thing is to monitor whether the market is persistent along with the upward movement or is joining without filling up the gap.
However, it is significant not to instantly fill up the gap area because it will allow a bearish trend throughout the first gap. Therefore, it is a typical rule of this price pattern that often emerges after moving the price in a particular direction, subsequent to the emergence of a gap in the movement’s direction.
A short-term trading strategy
It is a very profitable trading method. It is a price action-based trading system, and it can also provide high accuracy trade signals in short time frames.
Bullish trade scenario
Bullish setup
Best time frames to use
As it is a short-term trading strategy, we will look for trade on M5, M15, and H1 time frames.
Entry
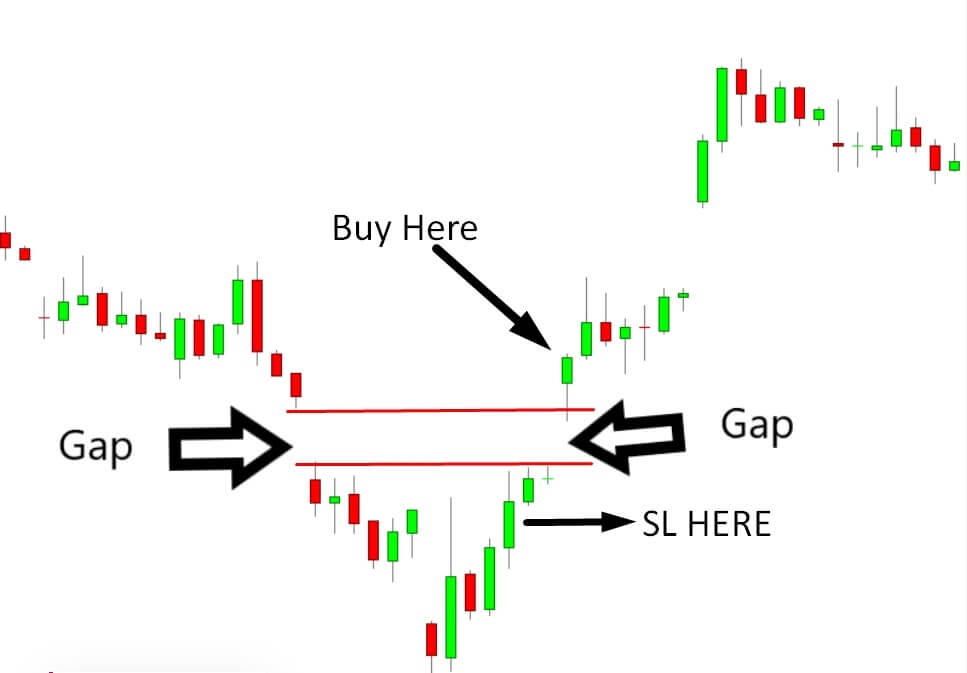
Look for buy entry, when the market goes against the bearish trend and has a bullish close.
Stop loss
Place stop-loss order below the bearish gap with a 5-10 pips buffer.
Take profit
Take the profit by calculating at least a 1:3 risk/reward ratio. Or else, you can ride the trend until the next resistance level arrives.
Bearish trade scenario
Bearish setup
Entry
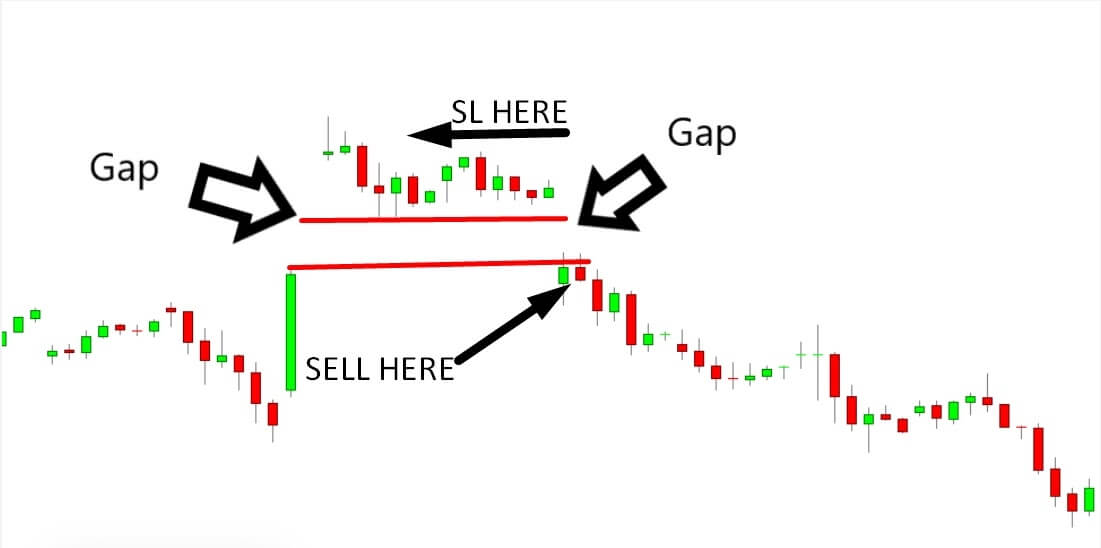
Look for sell entry when the market goes against the bullish trend and has a bearish close.
Stop loss
Place stop-loss order above the bullish gap with 5-10 pips buffer.
Take profit
Take the profit by calculating at least a 1:3 risk/reward ratio. Or else, you can ride the trend until the next support level arrives.
A long-term trading strategy
The price action works best on the higher time frames, and it can also provide good risk/reward ratio-based trades.
Bullish trade scenario
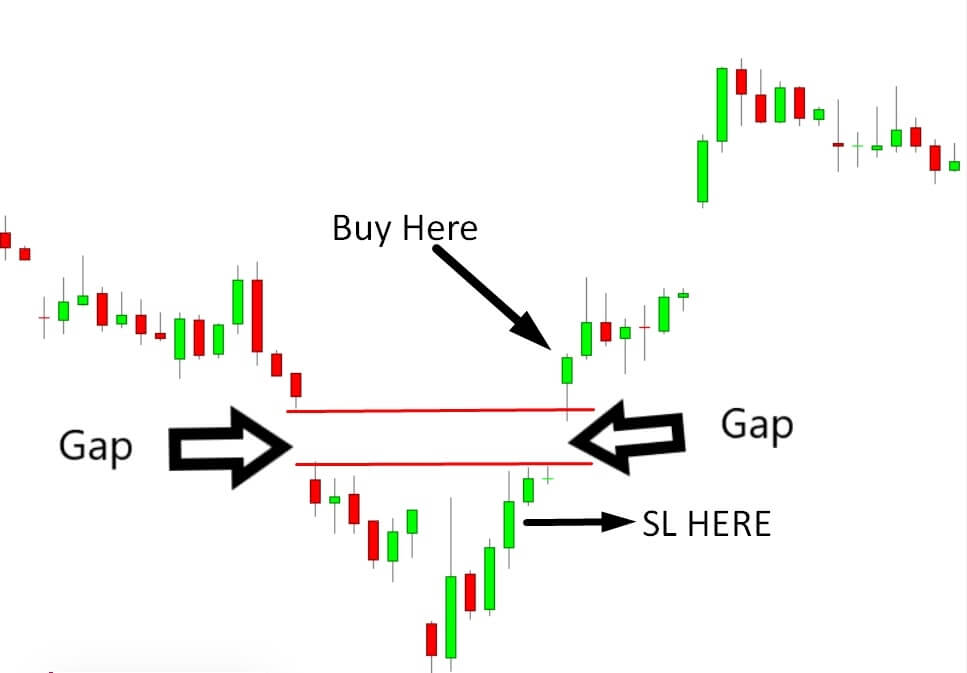
Bullish setup
Best time frames to use
As it is a long-term trading strategy, we will look for trade on H4, D1, and W1 time frames.
Entry
Look for buy entry, when the market goes against the bearish trend and has a bullish close above the bearish gap.
Stop loss
Place stop-loss order below the bearish gap with a 15-20 pips buffer.
Take profit
Take the profit by calculating at least a 1:3 risk/reward ratio. Or else, you can ride the trend until the next resistance level arrives.
Bearish trade scenario

Bearish setup
Entry
Look for sell entry when the market goes against the bullish trend and has a bearish close below the bullish gap.
Stop loss
Place stop-loss order above the bullish gap with 15-20 pips buffer.
Take profit
Take the profit by calculating at least a 1:3 risk/reward ratio. Or else, you can ride the trend until the next support level arrives.
Pros and cons
| 👍 Pros | 👎 Cons |
|
|
|
|
|
|
Final thoughts
In short, the Island method is eccentric since it is explained through the gaps of both sides of a combination of trading days. Many traders and analysts think that the gap will be filled up ultimately.
Filling up the gaps means that price will retreat over any previously occurred gap, whereas the figure relies on the concept that the gaps of both sides won’t be filled sometimes.


Comments