
The term “chaos” in chaos theory might mislead uninstructed readers. You might think it talks about randomness, a word you can use to describe the financial markets. However, chaos in this context is used in reverse. Chaos deals with a high level of order.
Chaos theory, as presented by Bill Williams, attempts to explain the inner workings of the markets. This is done through the use of fractal geometry. With this approach, speculators do not try to forecast the future based on historical price data. Bill Williams claimed that the fractal is the underlying structure of the market in general. Hence you can learn to trade the market by studying the fractal phenomenon.
The three wise men
Bill Williams developed a system that tries to find order in the seemingly chaotic market actions. Generally, a market is in one of two conditions at any point in time: trending or ranging. While you can certainly trade ranging markets, you can find the most money in trending markets.
When implemented correctly, the system proposed should make you profitable as you are trading at the start of a trend. You are predicting a trend change using an entry technique and then add positions as the trend moves in your favor. This is what the three wise men are all about. You will use various indicators in trading this system, particularly alligator and awesome oscillator. Bill Williams developed these indicators himself.
First wise man: divergent bar
The first wise man is a countertrend entry method. The intention is to get in at the start of the trend change. In candlestick trading, a divergent bar is equivalent to a hammer or a hanging man. A valid divergent bar forms far enough from the alligator.
This entry setup is a countertrend trade in its purest sense. This is because you have no confirmation of a trend change besides the divergent bar itself. A corollary requirement for this trade setup is angulation. So the price should move at a steeper angle than the alligator. If this requirement is not met, do not trade the divergent bar.
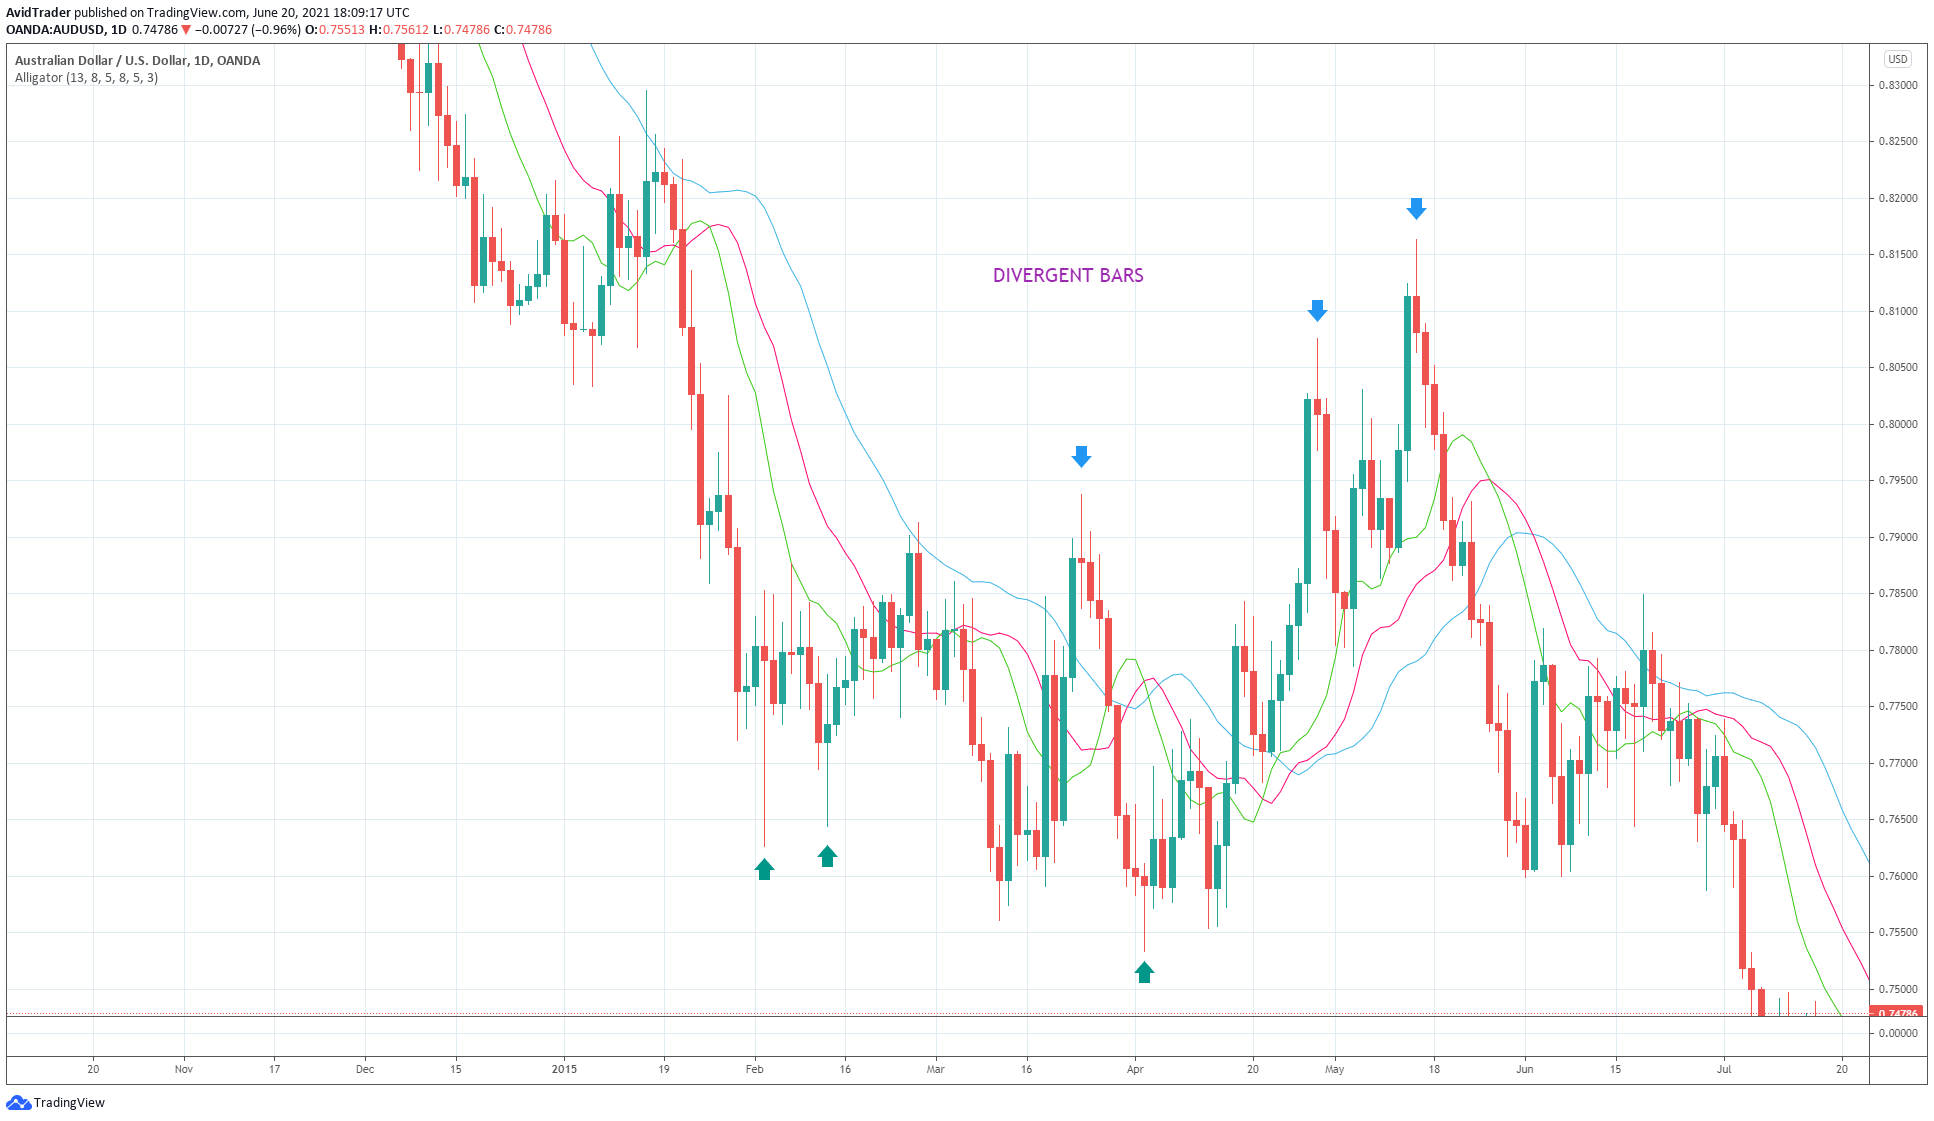
There are two types of divergent bars, bullish and bearish.
- A bullish divergent bar forms below the alligator at the end of a downtrend and signals a long entry.
- A bearish divergent bar forms above the alligator at the peak of an uptrend and signals a short entry.
The above graphic marks some divergent bars on the AUD/USD daily chart.
When the market satisfies the entry rules, you should enter using a buy stop or sell stop order.
- For a bullish divergent bar, place a buy stop a few pips above the high of the divergent bar.
- For a bearish divergent bar, put a sell stop a few pips below the low of the divergent bar.
At the time of entry, you should define the stop loss order as well. This is to prevent losing more than expected if the trade entry is wrong. With a stop loss, the trade risk is fully defined. For a bullish signal, put the stop loss a little below the low of the signal bar. Just do the opposite for a bearish signal.
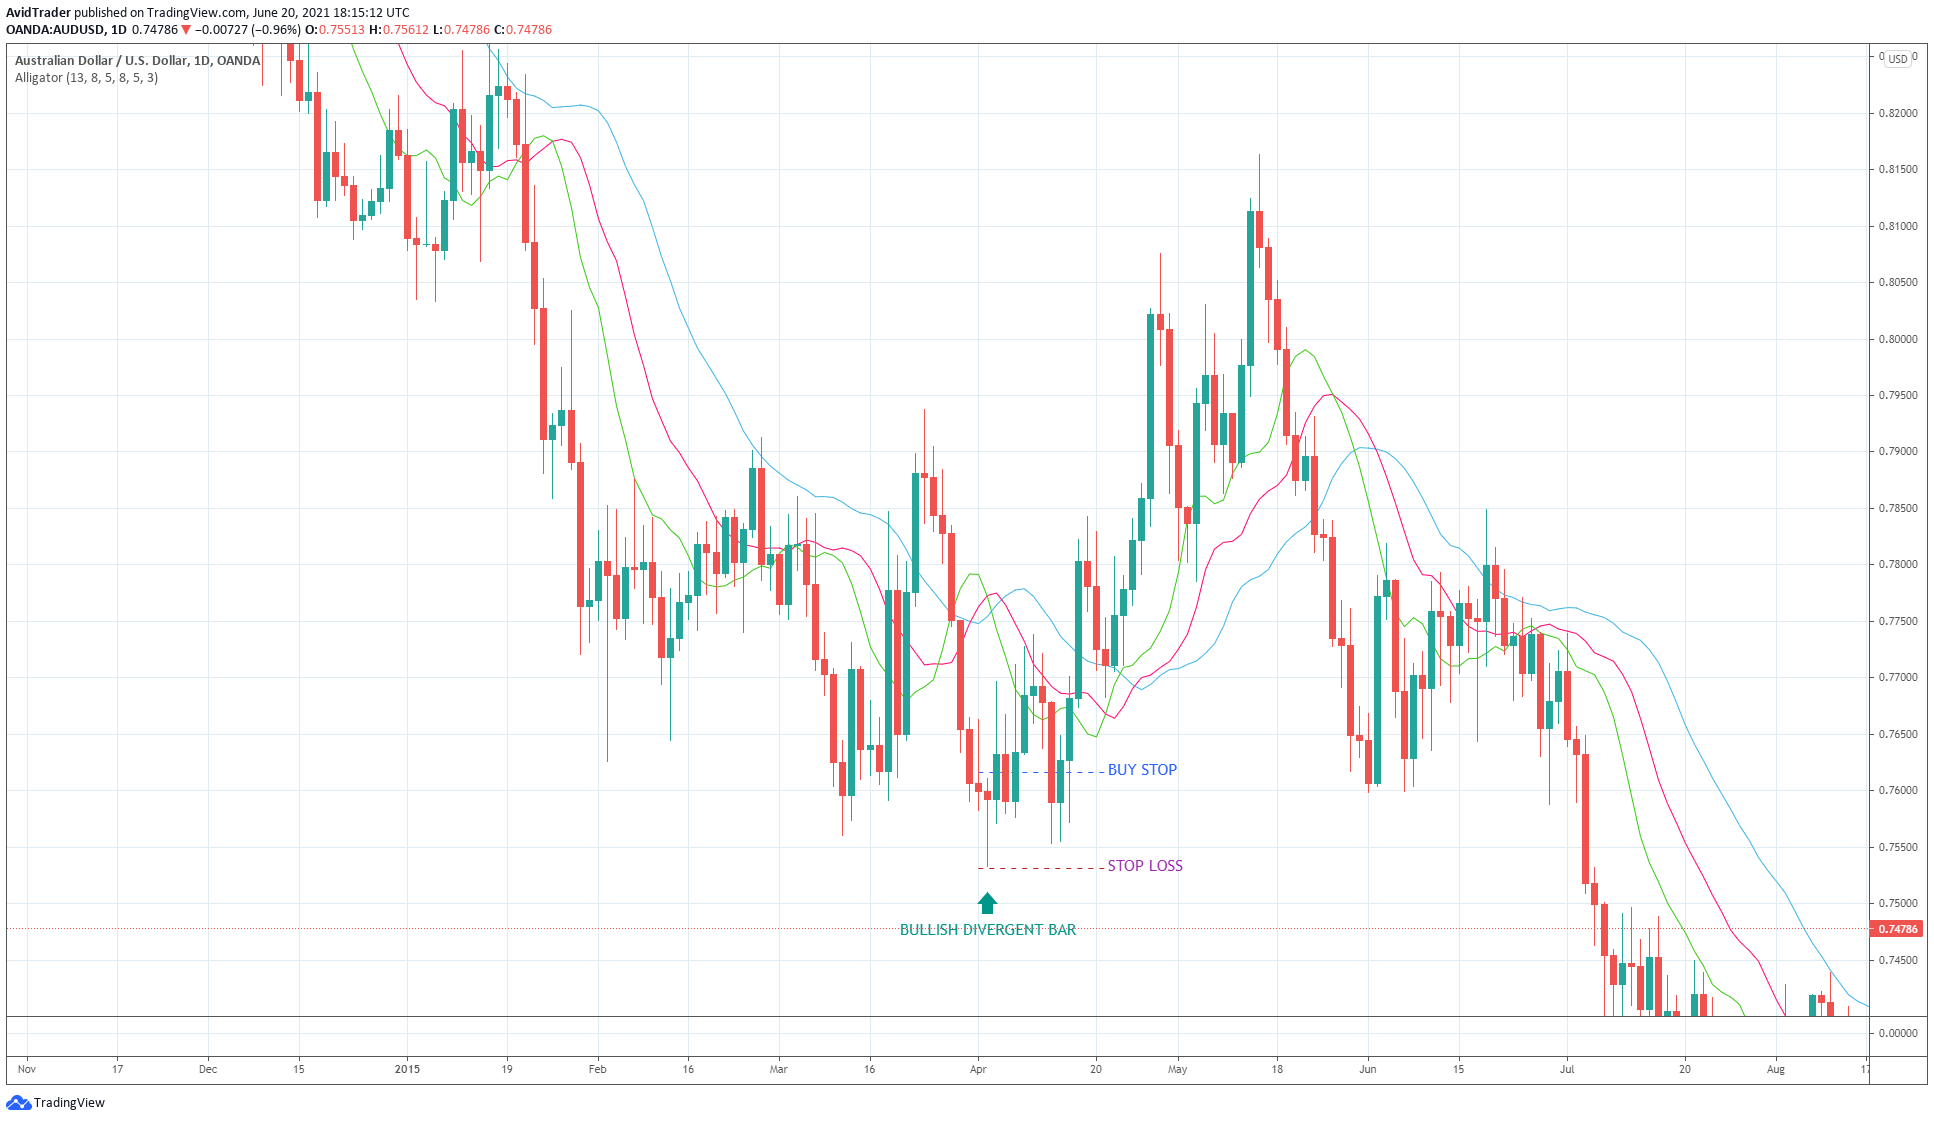
The above chart shows a bullish divergent bar setup with the entry and stop loss defined. Take note that the divergent bar formed below the alligator. By inspection, you can tell that angulation exists here. The price angle is steeper than the alligator angle. When the divergent bar closes, you can put the buy stop above the high of the signal bar and the stop loss below the low of that bar.
Second wise man: awesome oscillator
The goal of this entry strategy is to add a position if the previous entry works as intended. This is trying to take advantage of the current momentum, which is expected to go in the direction of the trade.
We will take the second entry based on the awesome oscillator. A momentum indicator, the awesome oscillator measures the momentum of the last five candles and compares it to that of the previous 34 bars. The awesome oscillator appears as a histogram below the chart. The histogram bars oscillate above and below the zero lines.
- After the first wise man entry, assuming you have taken a buy signal, the awesome red color oscillator is below zero.
- As the reversal begins, the oscillator will start displaying green bars, though the value is still negative.
- Open the second position when the third green histogram forms.
- Put a buy stop at the high of the candle corresponding to the third green histogram.
- After the first entry, it might take several candles before the price touches the second order as the momentum changes direction.
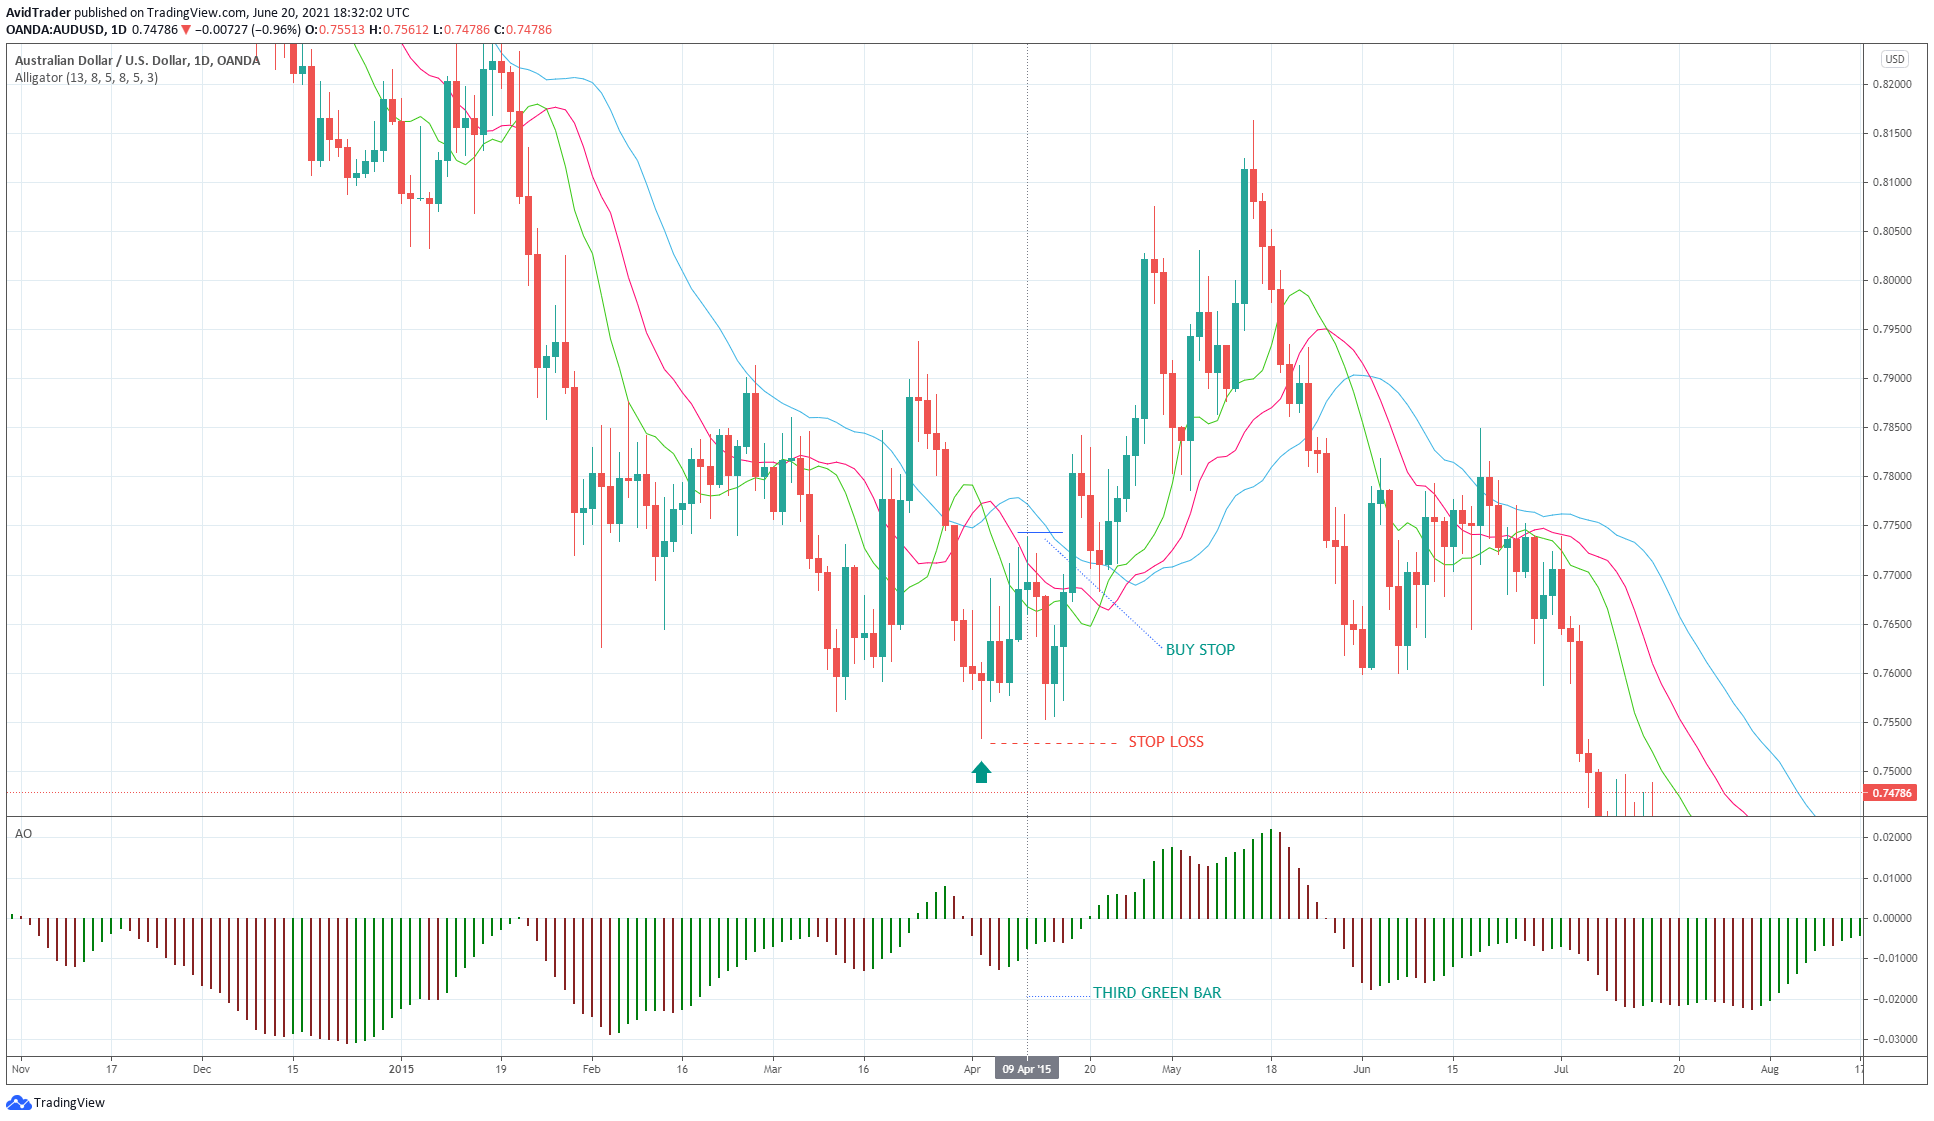
The above visual shows how to enter the second position.
- Put a buy stop above the high of the candle corresponding to the third green histogram in the awesome oscillator.
- Place this order after the candle has closed. As you can see, the price “took the order” after a few candles, resulting in a profit.
- Use a stop and reverse strategy for the second entry, after which a down fractal may have formed at the low signal bar. This is where you should place the stop loss of the second entry.
This means that the first and second buy entries have the same stop-loss price. If the market reverses and hits the stop loss, we will exit the two buy trades at a loss and open a sell trade at the stop loss point.
Third wise man: fractal breakout
While we take the first two entries assuming that the trend is changing, the third entry will confirm the trend change. The third wise man is the fractal breakout setup. Recall that it requires at least five candles to form a fractal. The fractal arrow is printed on the middle candle, and it can be an up or down fractal.
- If the middle candle has the highest high than the candles to the left and right, then an up fractal will form above the middle candle.
- If the middle candle has the lowest low than the candles to the left and right, then a down fractal will form below the middle candle.
For an up fractal, we are interested only in the candle highs. For the down fractal, we are looking at the candle lows only.
We will take the fractal entry if it is adequately located concerning the alligator.
- The alligator has three parts: lips, teeth, and jaw.
- The equivalent color coding is green, red, and blue.
- You should only take a long entry on an up fractal if it is above the red line.
- Just do the opposite for a sell entry on a down fractal. Again, you would use buy stop and sell stop orders for entry.
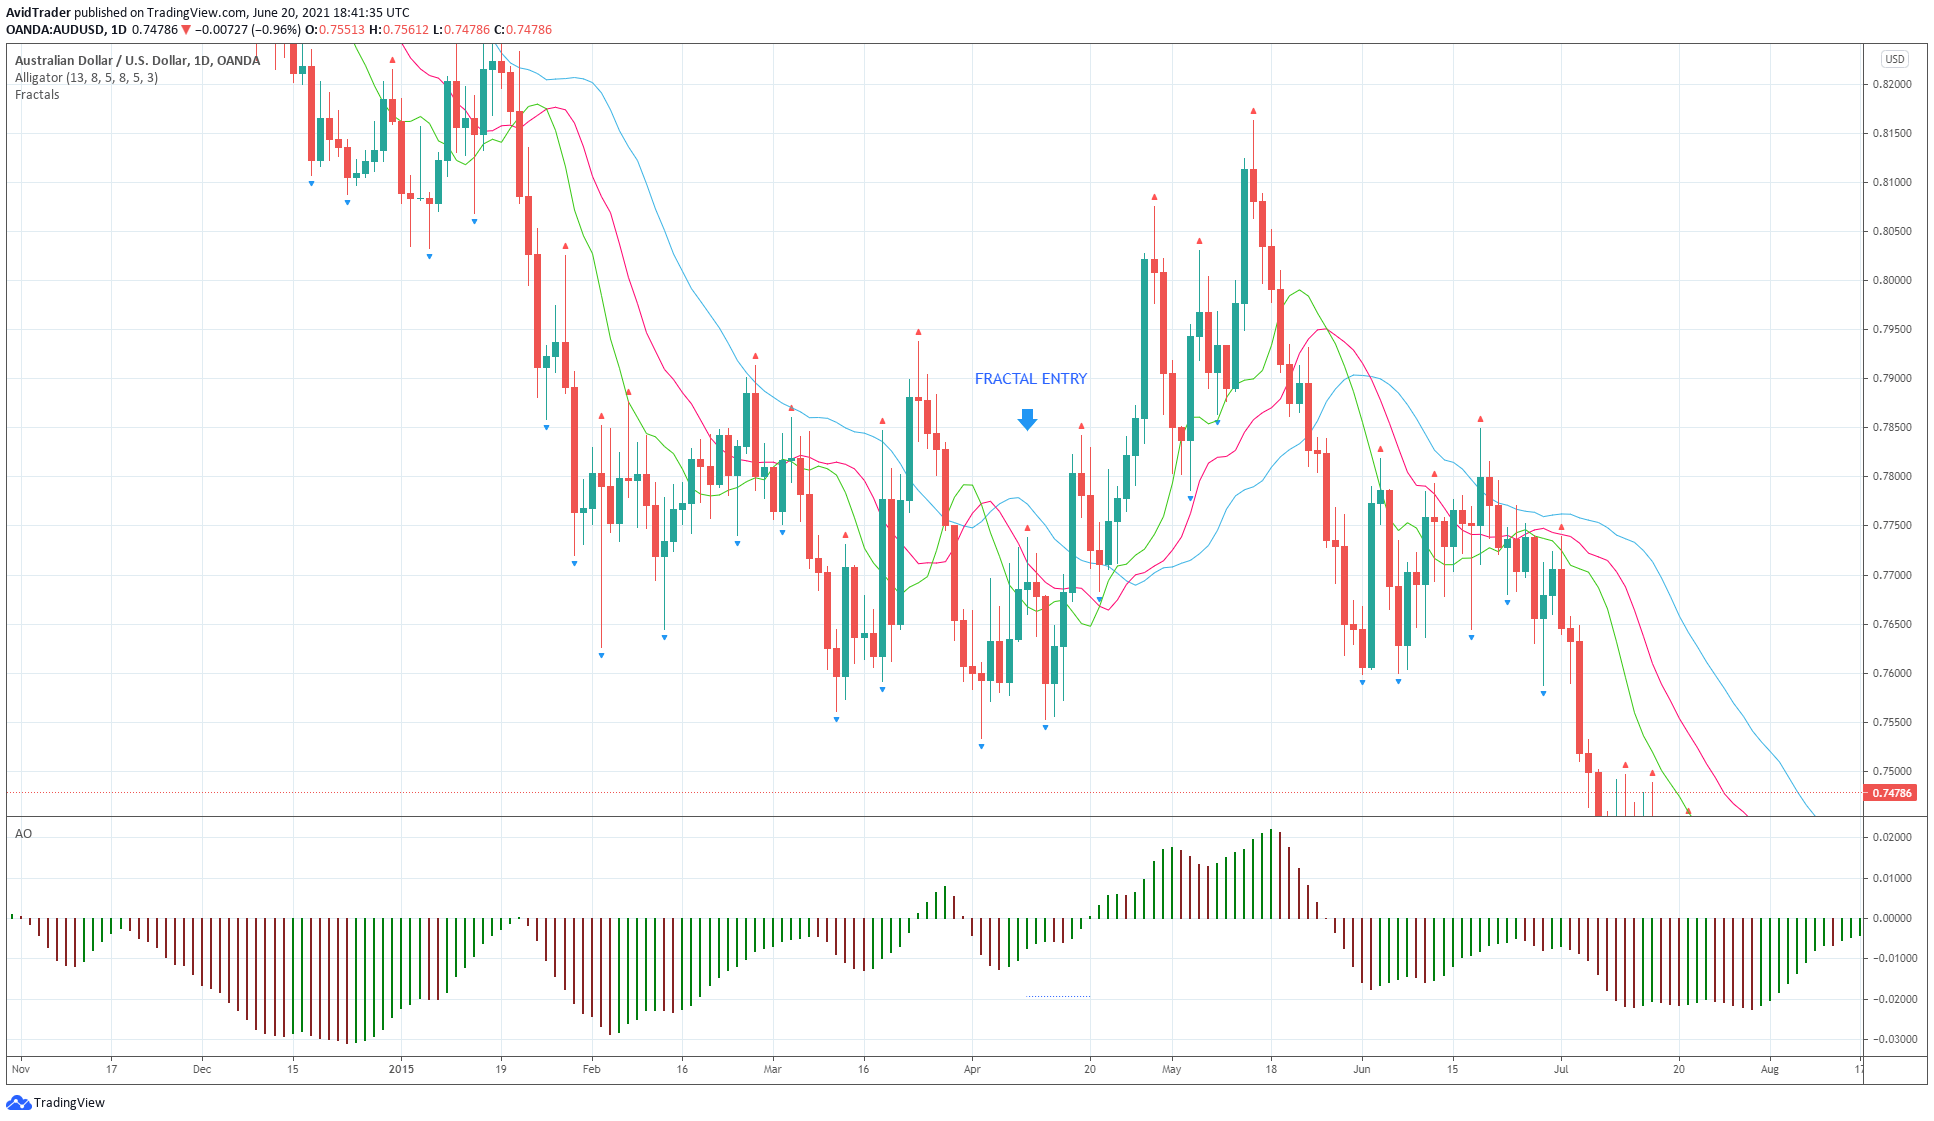
The above visual shows where the buy fractal entry is. Notice that the up fractal formed above the red line. In this case, you would have two entries only instead of three. However, in this example, the third entry coincides with the second entry. While not taken, the fractal entry gives more validity to the second entry.
Final thoughts
Learning about chaos theory will open up a new dimension to your trading. While the concept is hard to digest, the trading application is relatively easy. The three wise men are a complete trading strategy. It allows you to trade with the rhythm of the market. Just follow where the market goes fractal by fractal.


Comments