
You can consider technical indicators as an inevitable part of the financial market. It becomes easier to make trade decisions using technical tools and indicators appropriately. The Accelerator/Decelerator (AC) indicator is a standard oscillator popular among market participants.
However, different indicators use various calculations to obtain the market context. So there is no alternative to learning all components on any indicator and professional operating procedures to get the best results.
In the following section, let’s introduce you to the AC indicator and describe sustainable trading strategies using this indicator.
What is the Acceleration/Deceleration indicator?
The designing purpose of this indicator is to assess the driving force of the market movement, which is the third factor of Bill William’s trading system. You can consider this indicator among the most awesome oscillator indicators that show the most logical continuation of the price movement.
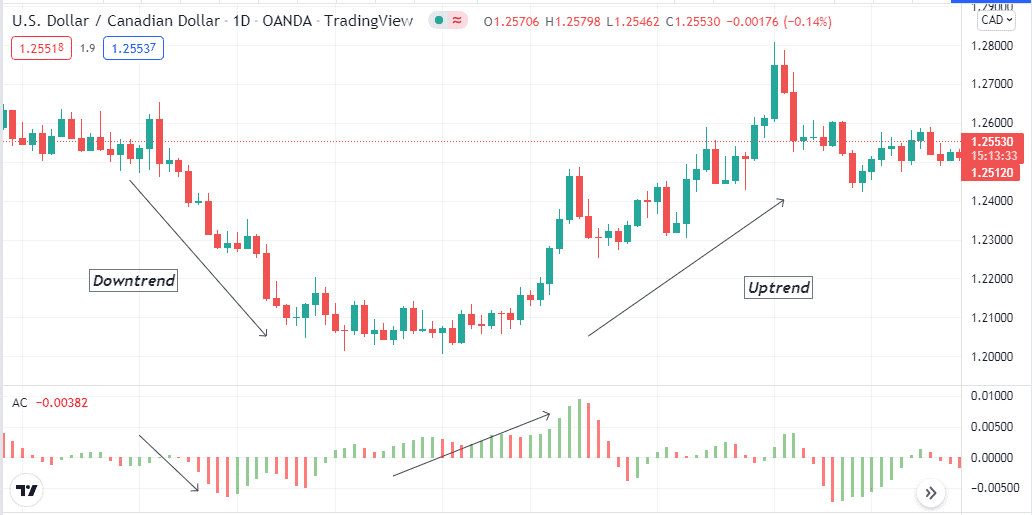
AC indicator on the daily chart of USD/CAD
This indicator results in an independent window containing histogram bars of different colors above and below a central line. The AC indicator changes directions even before the price of the underlying asset switches force in any direction.
The calculation formulas
MedianPrice=(High+Low)/2, (for TypicalPrice = (High+Low+Close)/3);
AO=SMA (MedianPrice; 5) −SMA (MedianPrice; 34),
AC=AO−SMA(AO; 5).
How to use the AC indicator in trading strategy?
It is a unique indicator that you can use as an early warning before the market turns. It usually has blue and red bars that declare bullish and bearish pressure on the asset price. All bars change in size according to the force of price change.
For a bullish trend, histogram bars take place above the central line. Conversely, histogram bars switch below the zero line when bearish pressure initiates. Professional traders usually check two/three bars while making trade decisions.
For example, the price movement turns bullish, and the histogram bar switches above the central line. Two blue bars in a row declare sufficient bullish pressure and signals to open buy positions. You can combine this indicator reading with other technical tools and indicators for more accuracy.
A short-term trading strategy
This method involves another popular technical indicator, the Parabolic SAR, alongside the AC indicator. The concept is quite simple: when both indicators declare bullish momentum, traders open a buy position, and inversely, traders open a sell position when both indicators declare bearish momentum. This trading strategy suits any timeframe chart; we recommend using a 15-min or hourly chart to catch the best short-term trades. Additionally, choose trading assets with sufficient volatility to execute trades frequently.
Bullish trade scenario
Apply those indicators and observe when:
- Histogram bars take place above the central (0) line of the AC indicator window.
- Two green bars occur in a row above the central (zero) line.
- Parabolic dots take place below price candles.
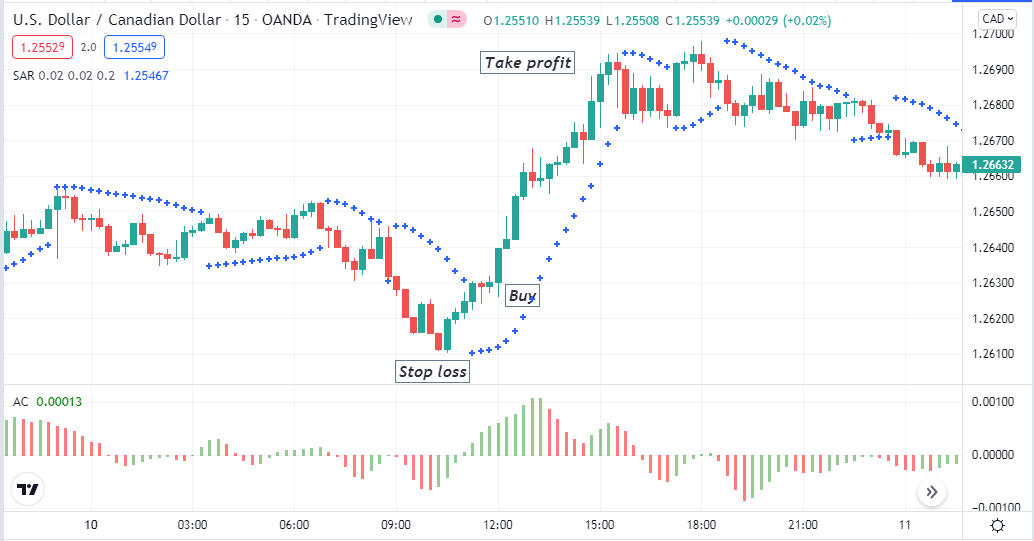
Bullish setup
Entry
When these conditions above match your target asset chart, it declares sufficient bullish pressure on the asset price. Open a buy position here.
Stop loss
Place an initial SL below the recent swing low with a buffer of 5-10pips.
Take profit
Close the buy position when:
- Parabolic dots switch above price candles.
- Histogram bars switch below the central line of the AC indicator window.
Bearish trade scenario
Apply those indicators and observe when:
- Histogram bars take place below the central (0) line of the AC indicator window.
- Two red bars occur in a row below the central (zero) line.
- Parabolic dots take place above price candles.
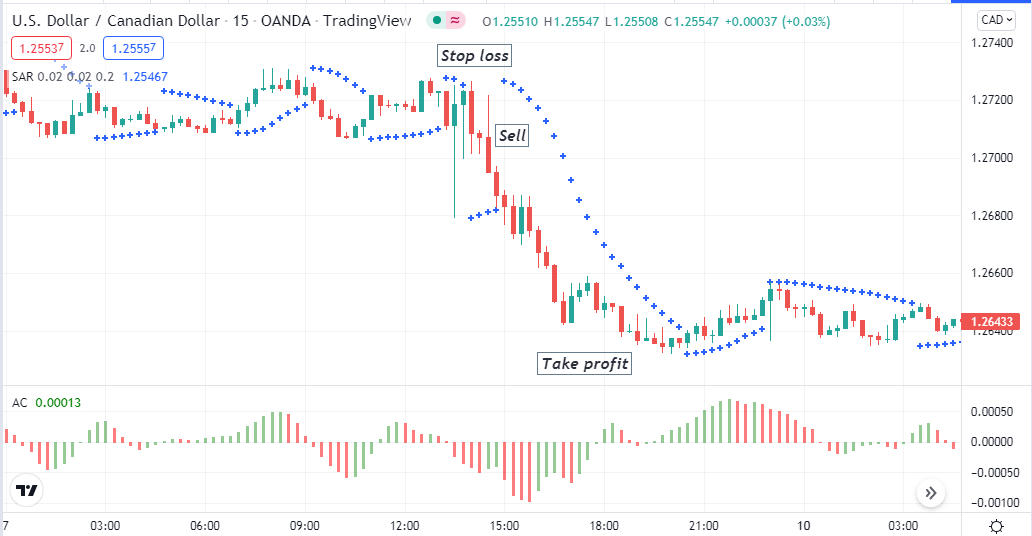
Bearish setup
Entry
When these conditions above match your target asset chart, it declares sufficient bearish pressure on the asset price. Open a sell position here.
Stop loss
Place an initial SL above the recent swing high with a buffer of 5-10pips.
Take profit
Close the sell position when:
- Parabolic dots switch below price candles.
- Histogram bars switch above the central line of the AC indicator window.
A long-term trading strategy
Besides the AC indicator, we use the MA crossover concept in our long-term trading technique. The crossover contains HMA 15 (red) and HMA 30 (blue).
When the red HMA line reaches above the blue HMA, that indicates the initiation of a bullish trend, and the exact opposite crossover suggests bearish momentum. This trading method you can apply on any timeframe chart. We prefer using this technique above the H4 chart to catch the most potential long-term trades.
Bullish trade scenario
Seek to open buy positions when:
- The red HMA crosses above the blue HMA line.
- Check both HMA lines are sloping on the upside.
- Histogram bars of the AC indicator window appears above the central line.
- Two green bars occur in a row above the midline of the AC indicator window.
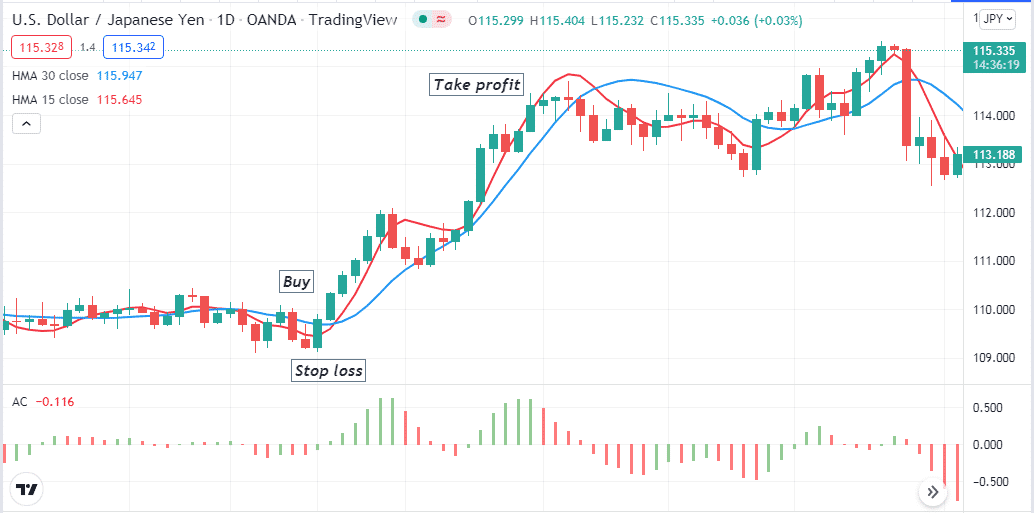
Bullish setup
Entry
These conditions above declare that the price is turning to an uptrend. Place a buy trade when the current bullish candle closes.
Stop loss
Place a reasonable SL below the current bullish momentum.
Take profit
Close the buy position when:
- The red HMA line comes below the blue HMA line.
- Histogram bars switch below the central line.
Bearish trade scenario
Seek to open sell positions when:
- The red HMA crosses below the blue HMA line.
- Check both HMA lines are sloping on the downside.
- Histogram bars of the AC indicator window appears below the central line.
- Two red bars occur in a row below the midline of the AC indicator window.
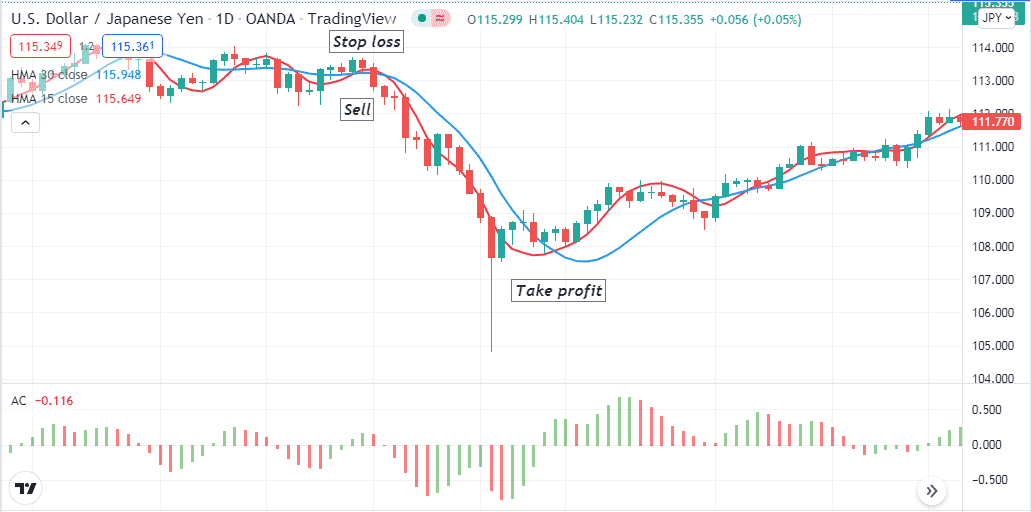
Bearish setup
Entry
These conditions above declare that the price is turning to a downtrend. Place a sell trade when the current bearish candle closes.
Stop loss
Place a reasonable SL above the current bearish momentum.
Take profit
Close the sell position when:
- The red HMA line reaches above the blue HMA line.
- Histogram bars switch above the central line.
Pros and cons
| 👍 Pros | 👎 Cons |
|
|
|
|
|
|
Final thought
Finally, the AC indicator is a straightforward indicator that any trader can execute constant successful trading positions. We suggest checking on fundamental events before making any trade decisions using this indicator and avoiding executing trades with any of these strategies during any major fundamental news releases as the market remains volatile during that period.


Comments