
Market participants check on a lot of info while making trade decisions. Obtaining volume info is typical practice to determine trading positions as measuring volume info enables increasing success rate on winning trades. Financial traders use many technical indicators to determine the volume of trading instruments, and the volume oscillator is one of the best among them.
However, the volume oscillator uses unique calculations to show the market context. So it requires having an adequate understanding to know the components and functionality of this indicator while using it to execute trades. This article will reveal the VO indicator besides explaining appropriate trading strategies using this indicator.
What is the volume oscillator indicator?
It is a unique technical indicator that determines the volume of any trading instrument by using different moving averages. It uses two different MAs for calculating the market context. One of them is a fast moving average, and the other is a slow-moving average. The default setting this indicator uses is the value of 14. In that case, the fast-moving average volume uses a value of 14, and the slow-moving average volume uses 28.
The formula the VO indicator use is:
Volume Oscillator = [(Shorter Period SMA of Volume – Longer Period SMA of Volume) / Longer Period SMA of Volume ] * 100.
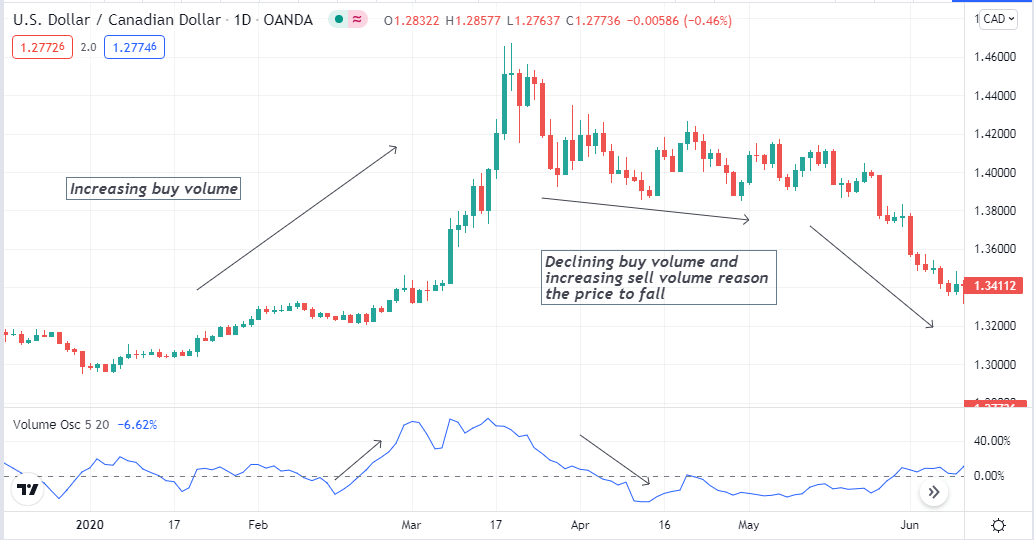
The volume oscillator in a daily chart of USD/CAD
This indicator has an insight into the strengths, weaknesses, and current trends of trading instruments through this calculation. There is an argument among the technical analysts who use the VO indicator to make trade decisions.
Some think that these slow and fast-moving average values this indicator uses are sufficiently conservative. Meanwhile, others don’t agree. However, you can customize the settings or change the values if you want to.
How to trade using the volume oscillator indicator
The VO indicator shows readings on an independent window that contains a dynamic line that changes positions according to calculations, above or below a central line. According to the measure, the indicator has a simple concept. When the fast moving average crosses the slow moving average on the upside, it declares a positive strength on the asset price or signals a possible bullish pressure on the asset price.
On the other hand, if the fast moving average crosses the slow moving average on the downside, it signals a possible bearish pressure on the asset price. In both cases, it calculates percentages by multiplying values with a 100. Professionals don’t recommend using this indicator as a standalone tool while making trade decisions. Additionally, using it in conjunction with other technical indicators enables identifying more accurate entry/exit positions.
A short-term trading strategy
We use the VO indicator beside the support resistance levels in this short-term trading method. This trading method is suitable for any time frame chart. Meanwhile, when catching short-term trades, a preferable time frame is a 15-min chart and try to select trading instruments with sufficient volatility to make frequent trades.
While using a 15-min chart, draw the support resistance lines from upper time frame charts. Additionally, prioritize other essential levels, such as weekly/monthly high-low-open-close, historical levels, etc.
Entry
Seek opening buy positions when the price breaks above any levels you draw. Check the VO indicator if the dynamic line is above the central line. Both these conditions indicate sufficient bullish pressure. So math these to your chart and place a buy order.
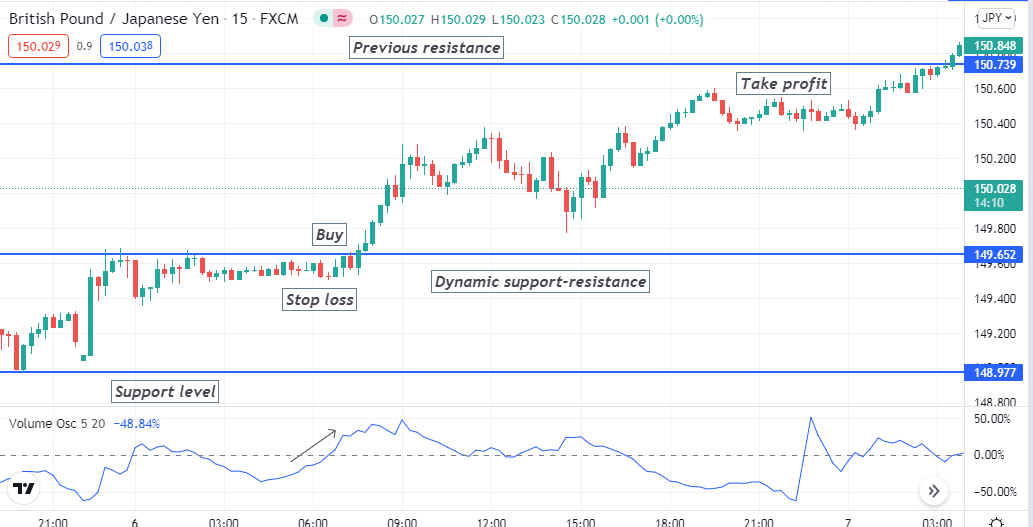
Bullish setup
Meanwhile, check the VO indicator window when the price breaks below any level you draw. Place a sell order if the dynamic line is below the central line.
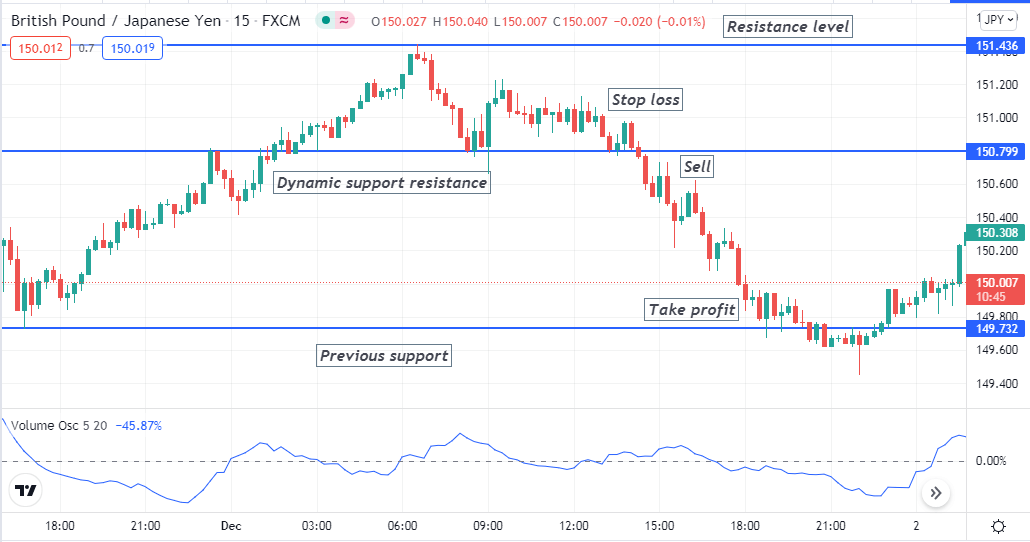
Bearish setup
Stop loss
Determining stop loss levels is manageable through this trading method. Place the stop loss below the breakout level when opening a buy order. Meanwhile, the stop loss level will be above the breakout level when opening a sell order.
Take profit
The initial profit target will be near, above, or below the previous support resistance levels that break. For buy order profit target will be below the previous resistance level, and the profit target will be above the previous support level when triggering a sell order. You can continue your trades if a further breakout occurs.
A long-term trading strategy
We use a popular momentum indicator, the RSI, beside the volume oscillator indicator for accuracy in this long-term trading method. The RSI determines trend-changing levels.
Meanwhile, the VO indicator confirms the current trend has sufficient volatility to enter the market. Both indicators show readings on independent windows, and you can generate potential entry/exit points by combining both indicator readings. This indicator suits more extended time frames such as daily or weekly charts. Note that the VO indicator generates the best signals on upper time frame charts.
Entry
First, apply those indicators to your target asset chart. Observe the indicator windows when a bearish trend ends and the price starts to bounce on the upside. Open a buy position when the dynamic RSI is at the central (50) line or above it heads on the upside, and the VO value increases above the zero level.
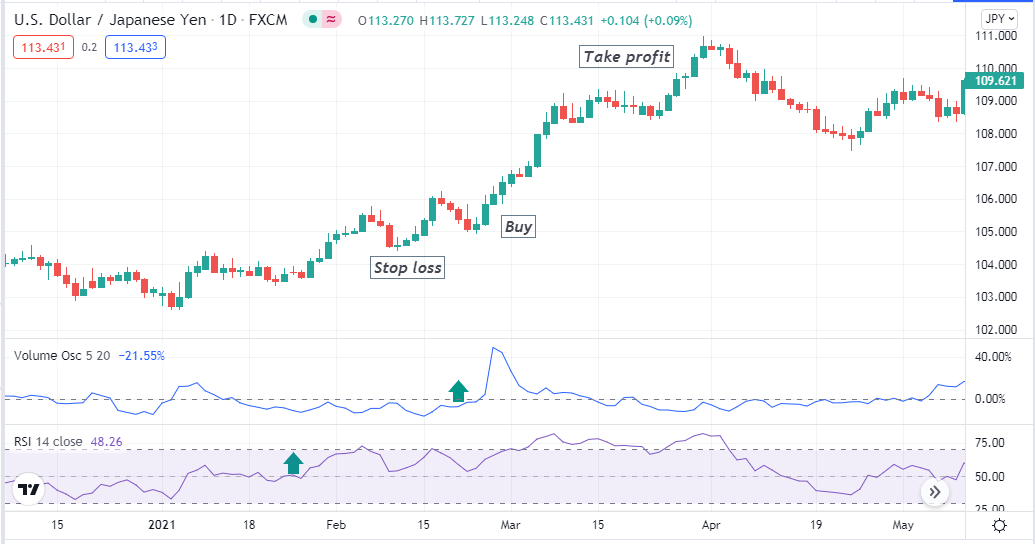
Bullish setup
On the other hand, open a sell position when the VO line declines below the zero level, and the dynamic RSI line is at the central (50) line or below it heading more downside.
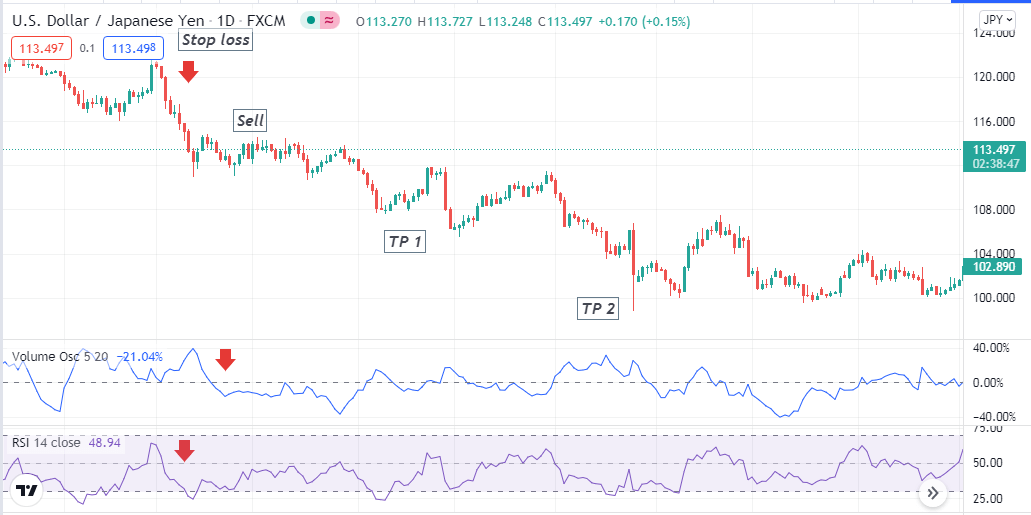
Bearish setup
Stop loss
Use a reasonable stop loss for your executing trades. Place an initial stop loss below/above the current swing low/high for your buy/sell orders. Depending on your capital size and risk tolerance, you can use an aggressive or a conservative stop loss for your trades.
Take profit
Continue your trades according to the market context until trends remain in your order’s direction — close positions when the indicator windows detect opposite momentums against your order type.
Pros and cons
| 👍 Pros | 👎 Cons |
|
|
|
|
|
|
Final thought
Financial traders use many sustainable methods as their trading approaches that involve the volume info of trading instruments. A study says it enables a 77% winning rate for traders who use volume info accurately when making trade decisions.
However, the volume has nothing to do with the price in most cases, but the price movement relates to the volume info. Combining many other indicators, such as MA crossover, Parabolic SAR, MACD, etc., will increase the potentiality of trading methods using the VO indicator.


Comments