
A commodity channel index is a technical tool that indicates the future price direction by observing whether it is overbought/oversold. Although this indicator has a long story of providing profits for commodity and FX markets, it is comparatively new for cryptos. Therefore, investors wonder how this element would work to find the price direction of a crypto token.
Based on our findings and research, CCI is profitable in the crypto market, and it is easy to build a good trading strategy using this indicator. The following section will uncover everything a trader should know about the CCI trading strategy in the crypto market with exact buying and selling methods.
What is the CCI?
Donald Lambert introduced the indicator in a financial magazine in 1980, where he claimed this indicator as a tool to define the price trend of commodities. Although this tool aimed to find the overbought/oversold position, market participants acquired it to find the price direction of indices, commodities, stocks, and cryptos.
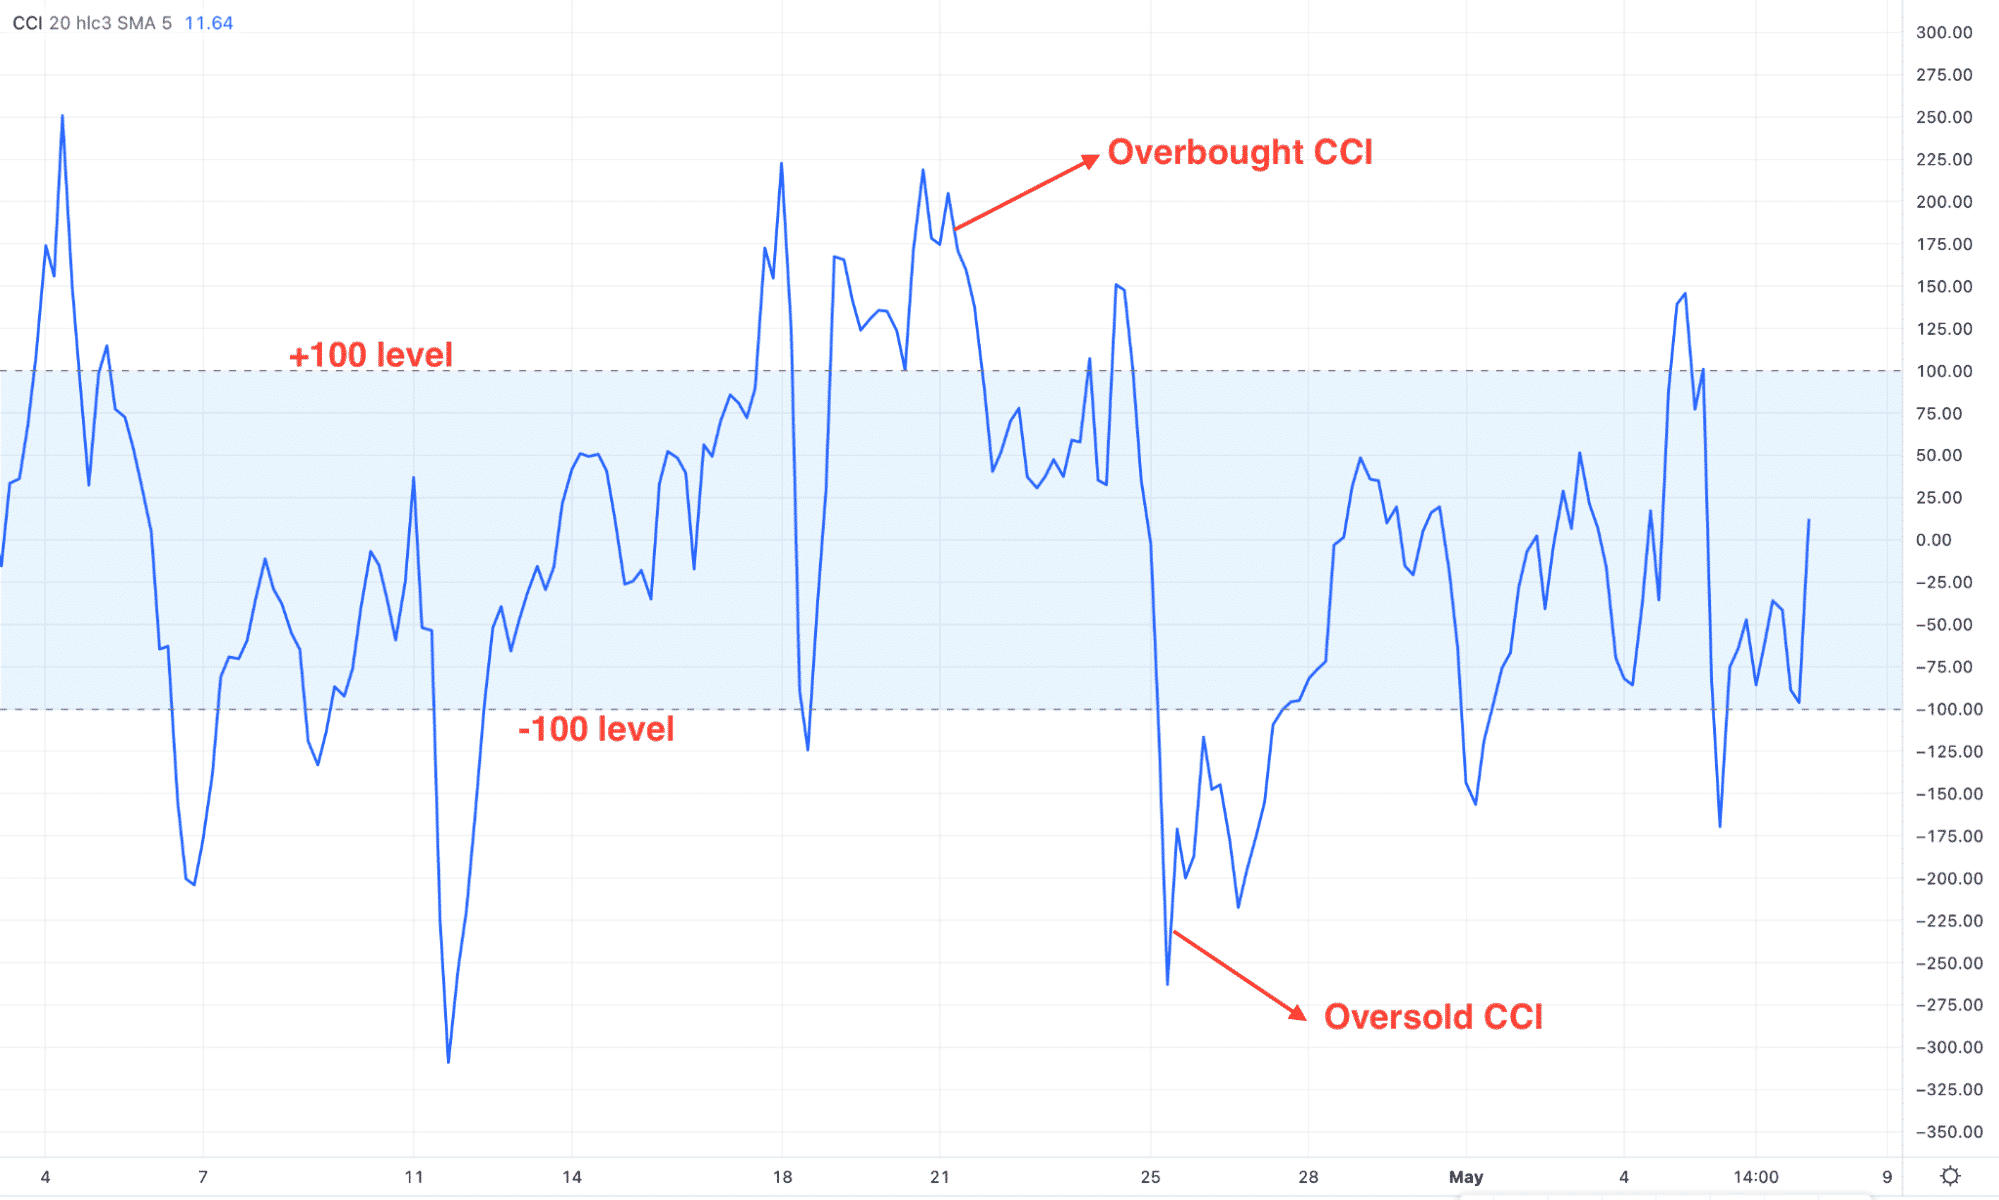
The tool measures the current price of a trading instrument and compares it with the average price for a particular time.
- CCI level will be higher when the current price is extended from the average level.
- On the other hand, CCI will be down when the current price is down from the average level.
In this way, investors predict the future price direction by identifying potential reversal areas.
CCI indicator
How to trade using CCI in trading strategy?
Trading with the indicator needs sound knowledge of technical analysis, whereas the trader needs how to combine other indicators with this one to find the possible price direction.
However, in the trading method, investors should have the basic knowledge of CCI calculation in four steps. Let’s see the calculation method for 20 periods.
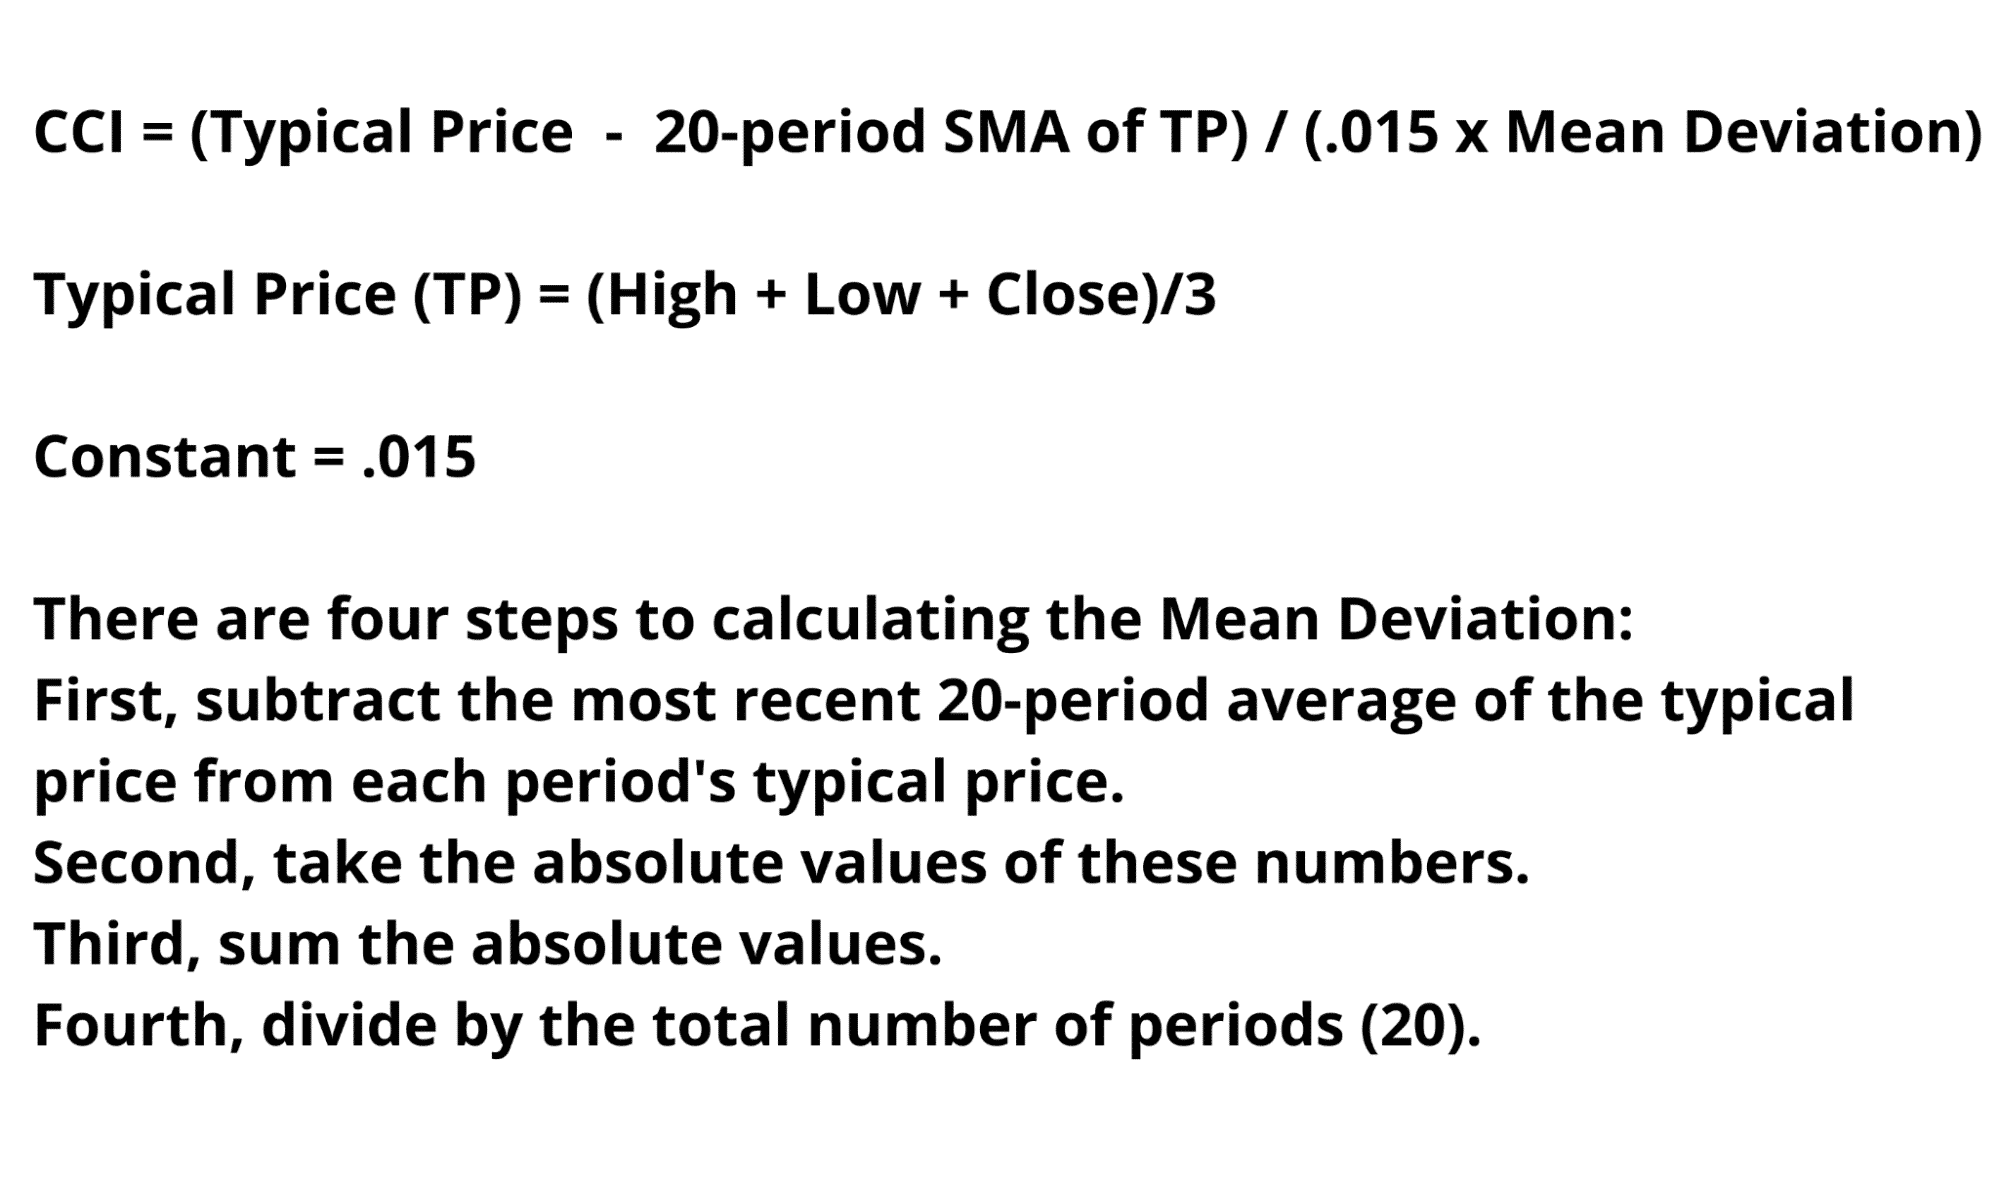
CCI calculation
While taking a trade using the indicator, it should work as a confirmation to other trading tools like moving average, Bollinger Bands, Parabolic SAR, etc. All indicators should show the same direction before opening a trade under an affordable trade management system.
A short-term trading strategy
This method is an intraday approach to buying or selling a crypto asset. Here, investors should understand where the long-term price is heading, and the ultimate result comes when both time frames match the direction.
Bullish trade scenario
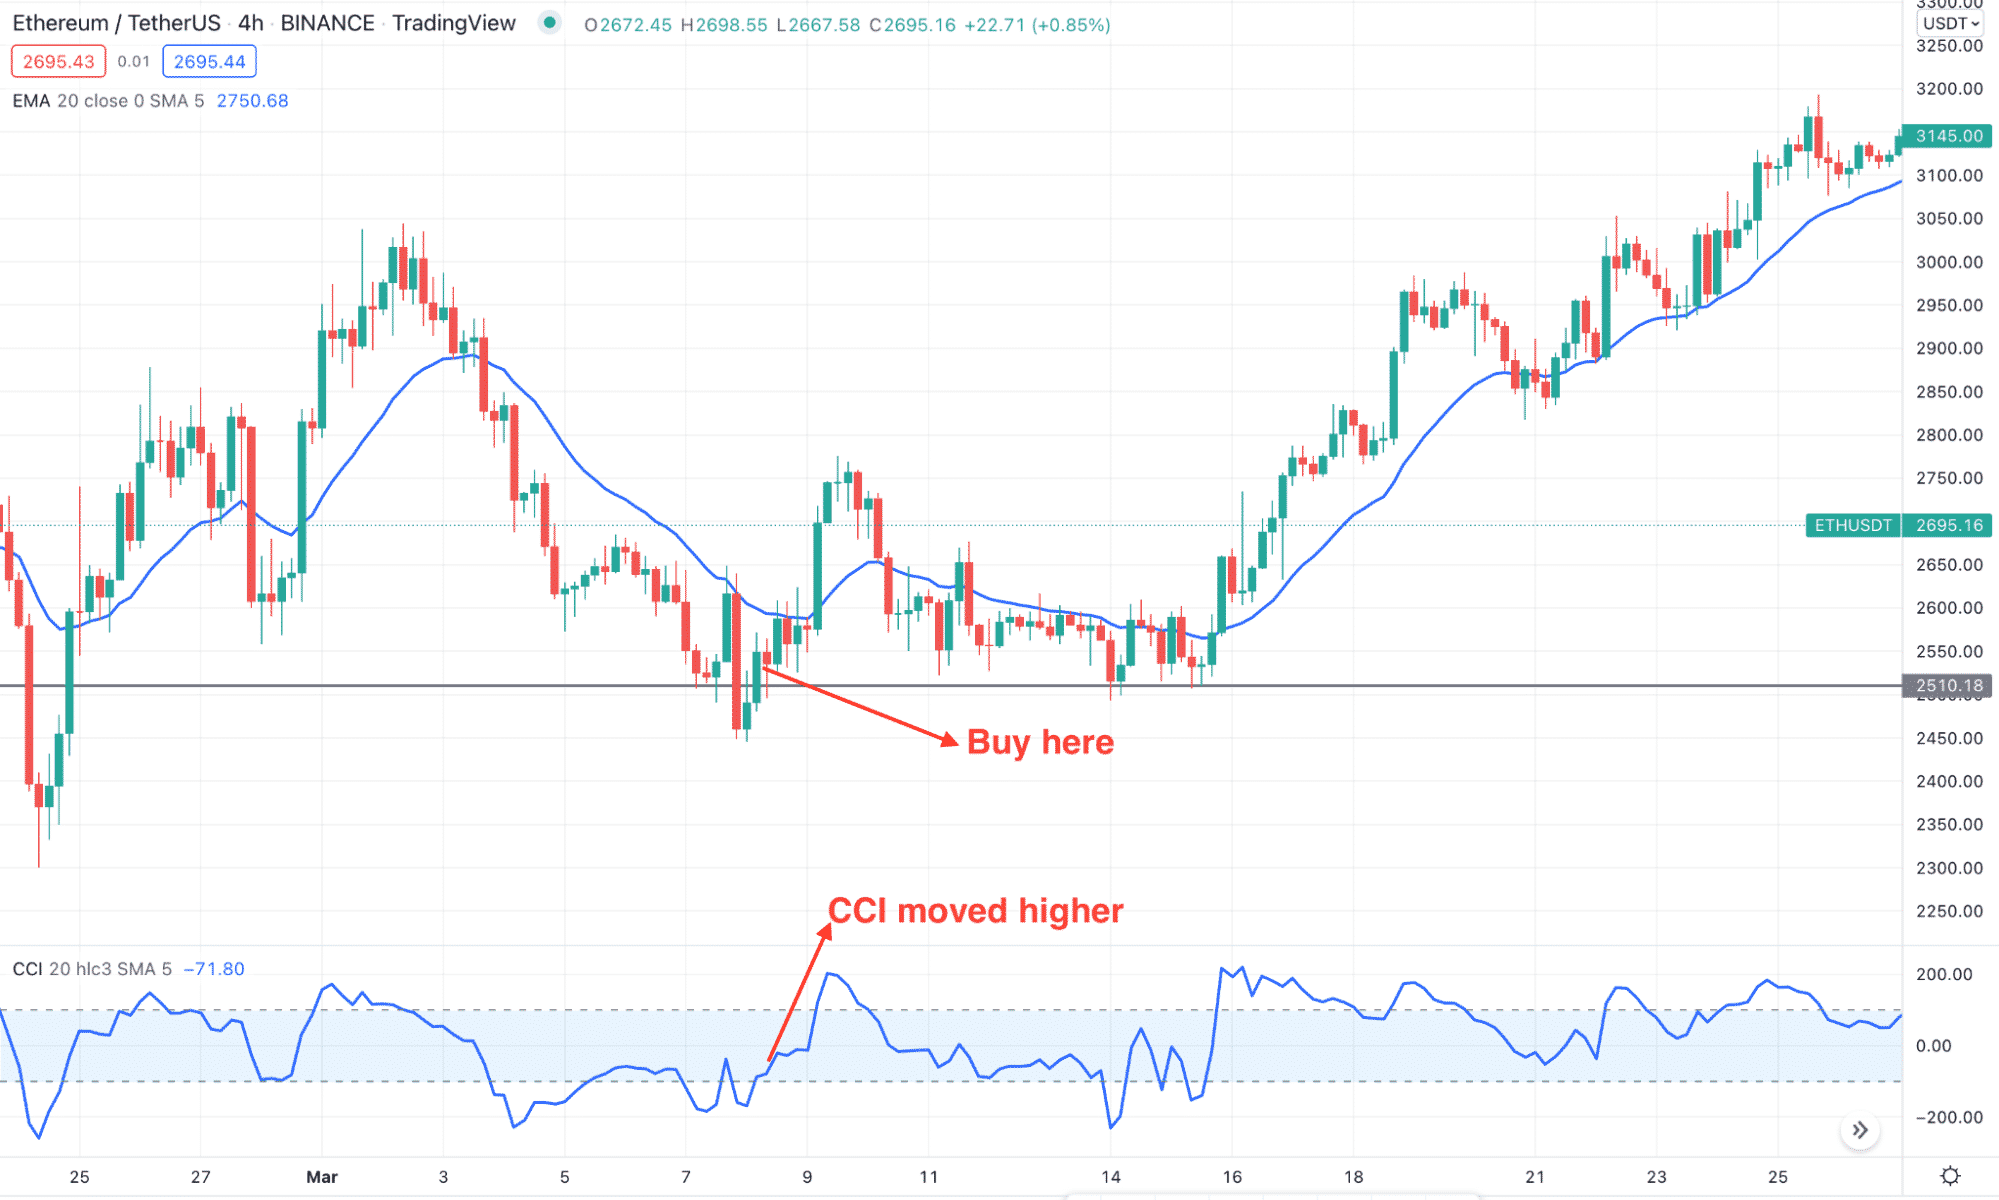
Short-term buy trade
We will look for a divergent movement between short and long-term time frames in the bullish trade. If the long-term price is bullish, but the short-term is bearish, there is a higher possibility that the price will reverse its direction to follow the higher timeframe bullish trend.
Entry
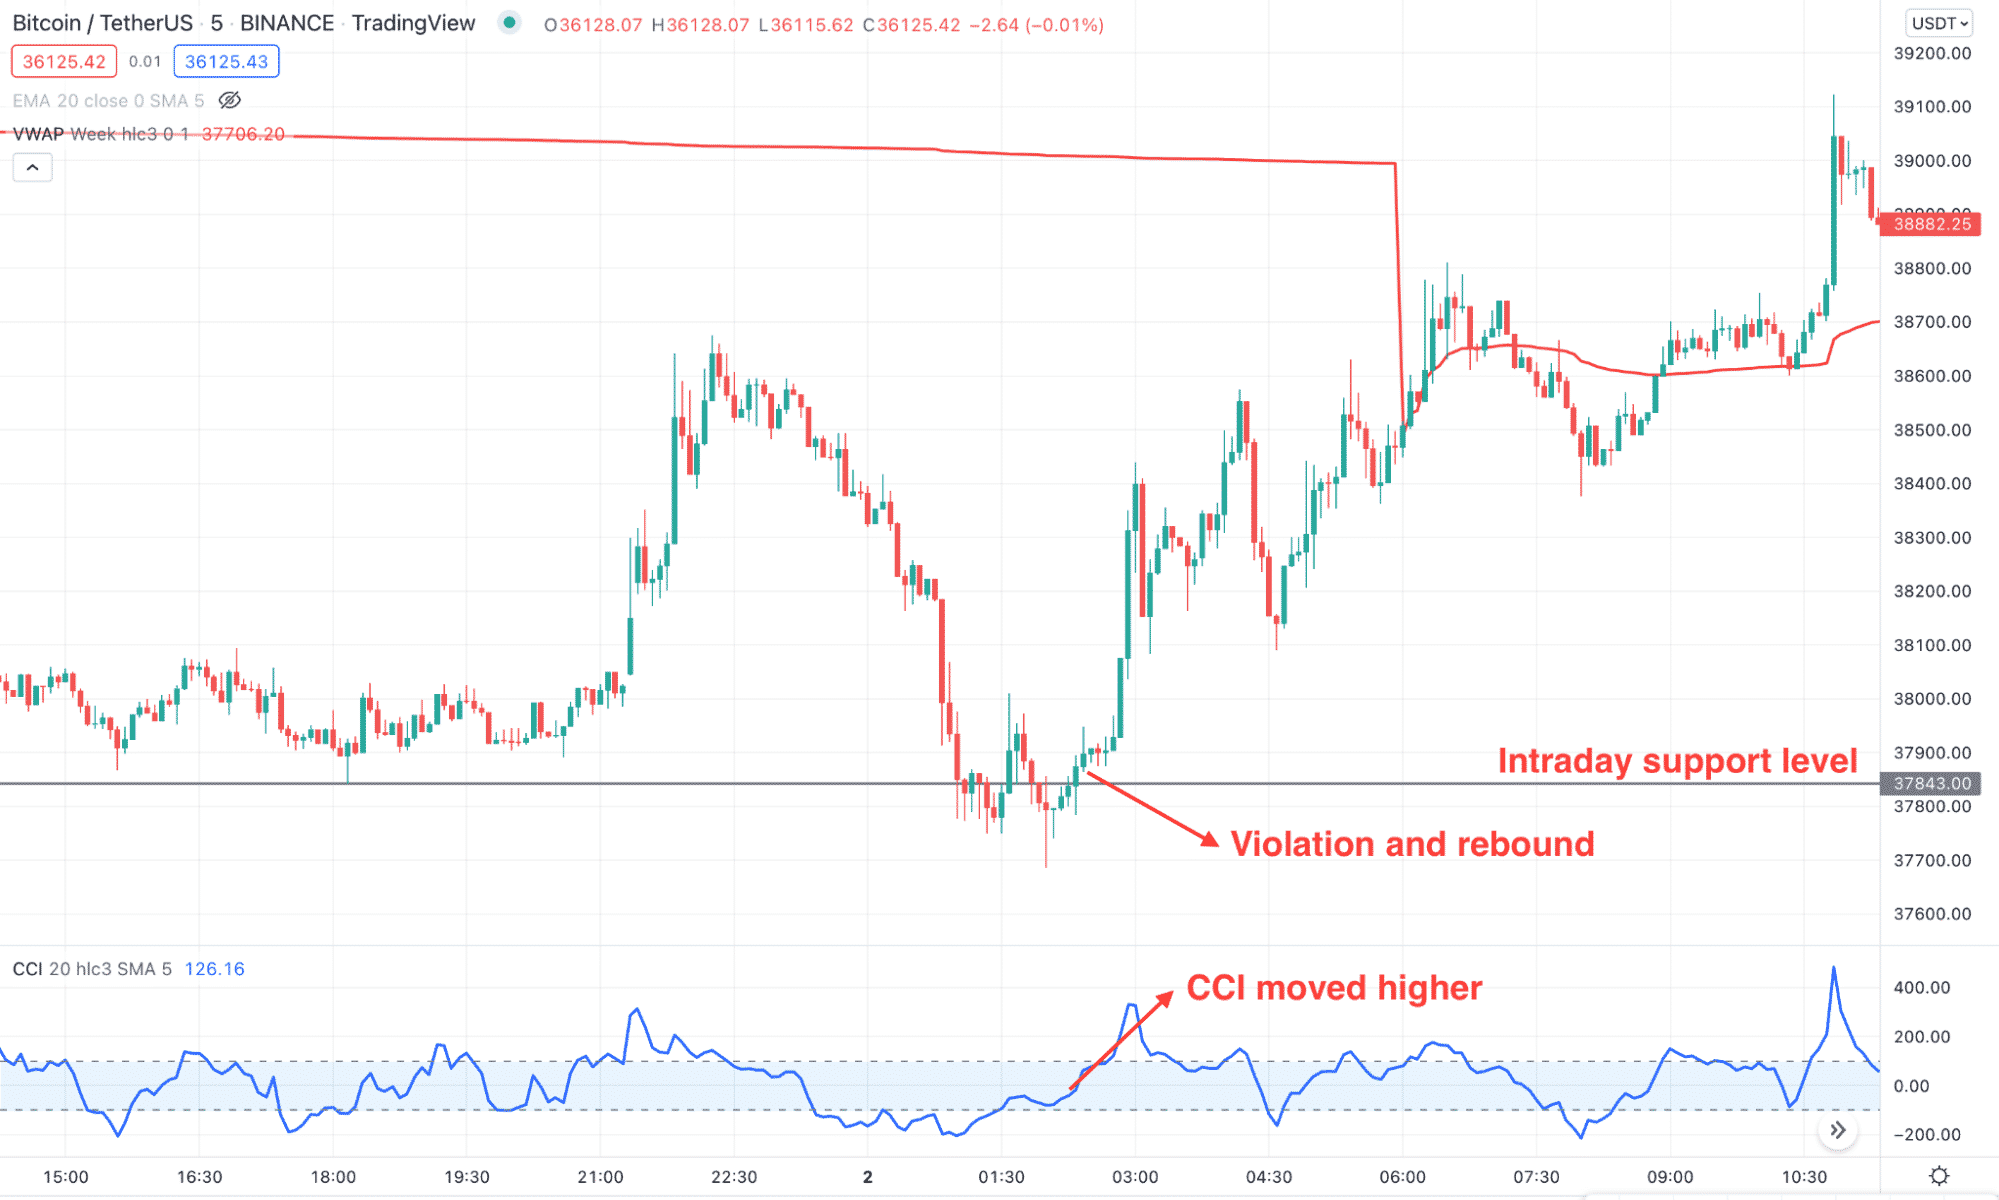
The buy trade is valid once these conditions are present in the five minutes chart:
- The long-term trend from H1 or H4 is bullish by showing an upside pressure from critical support areas.
- In the five minutes time frame, the price came lower and reached any near-term support level.
- The gap between the price and dynamic weekly VWAP is extended.
- CCI moved to the oversold area and started rebounding.
- The price formed a bullish rejection candle where the closing of the candle indicates the buy trade as valid.
Stop loss
The stop loss is below the candle from where the trading entry appeared.
Take profit
The first take profit is the rapid swing high, but traders can extend it following the long-term market direction.
Bearish trade scenario
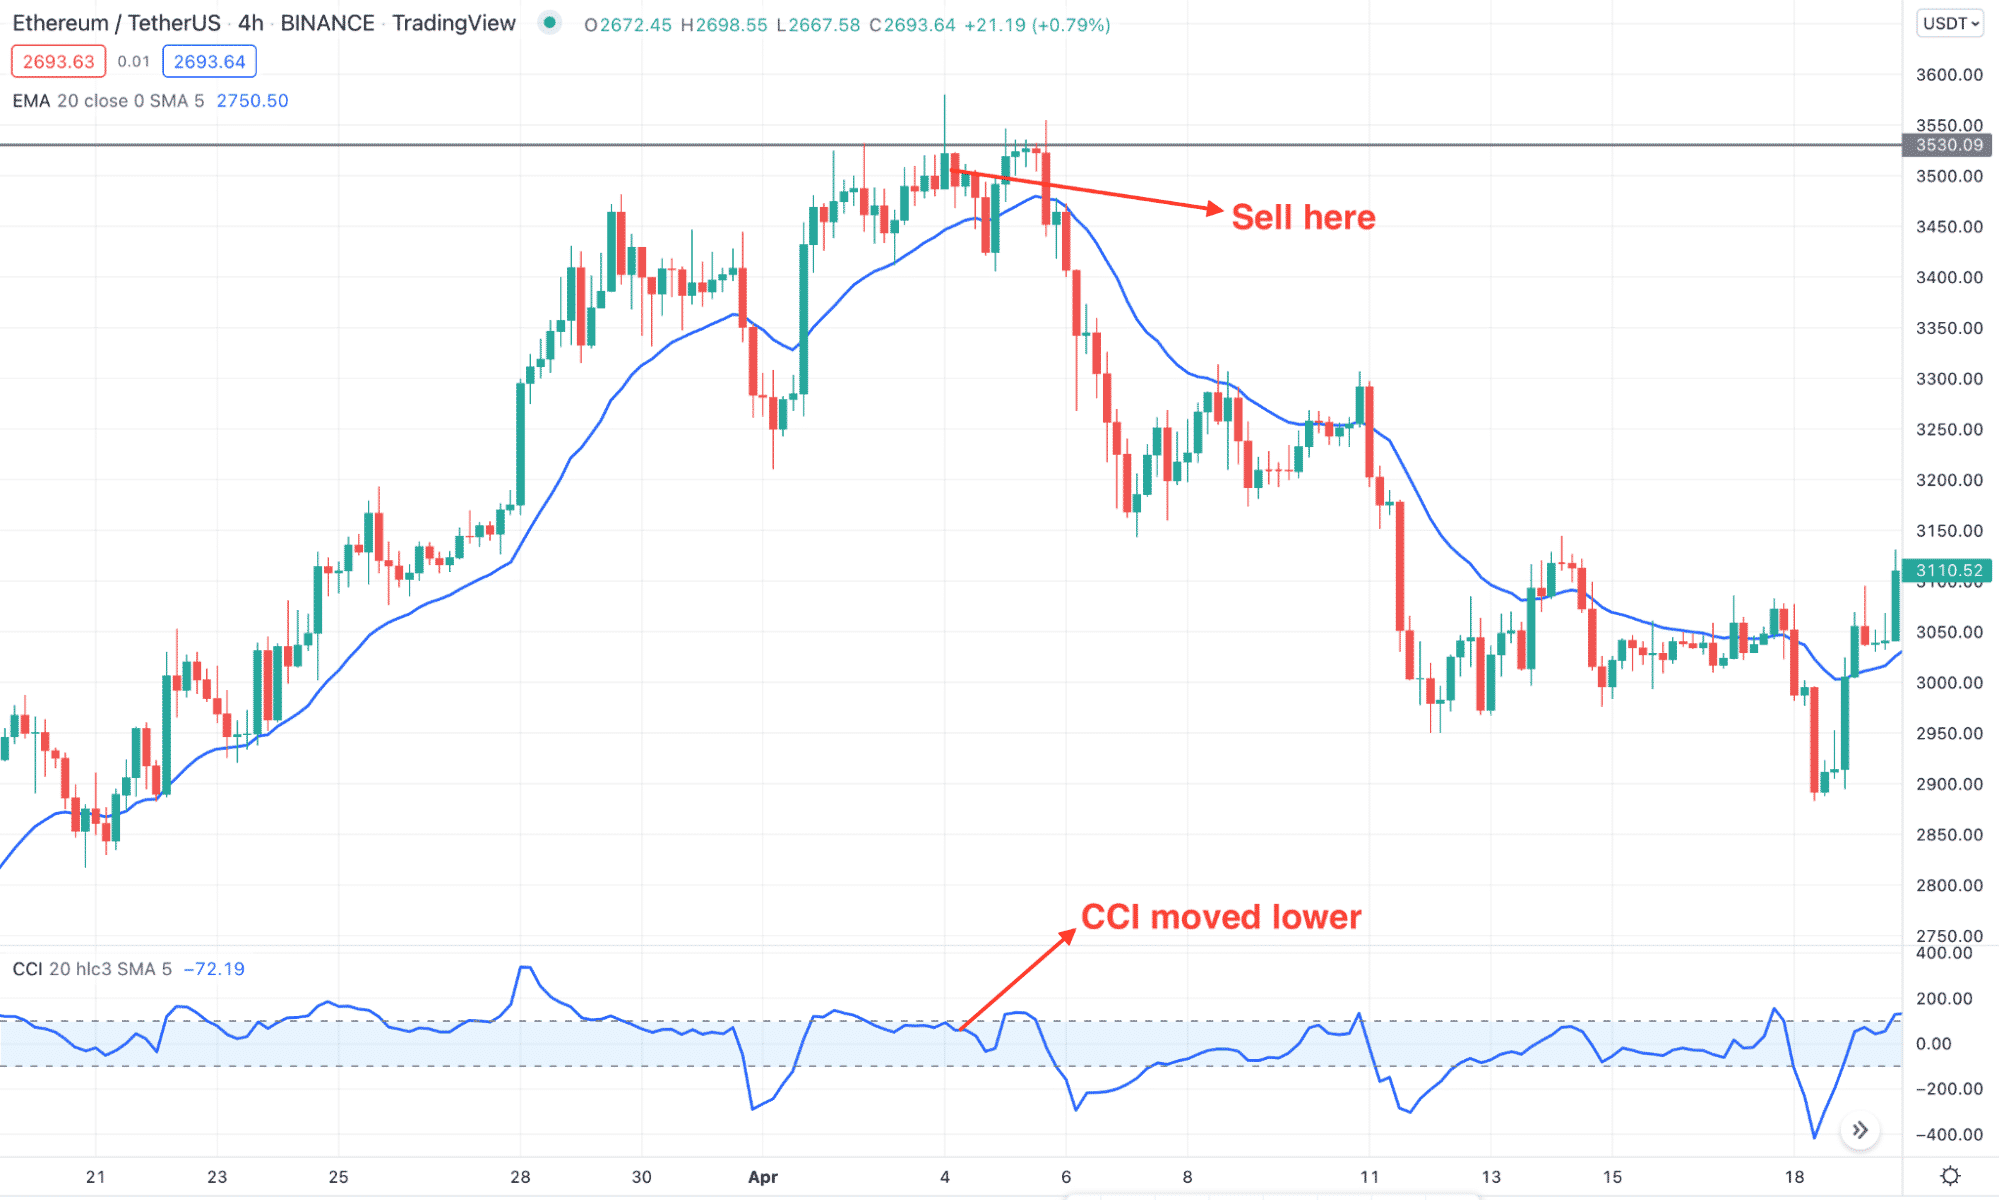
Short-term sell trade
You can apply the short-term bearish approach when the crypto market remains under pressure. In that case, the main aim is to find a minor bullish correction to join the major bearish rally.
Entry
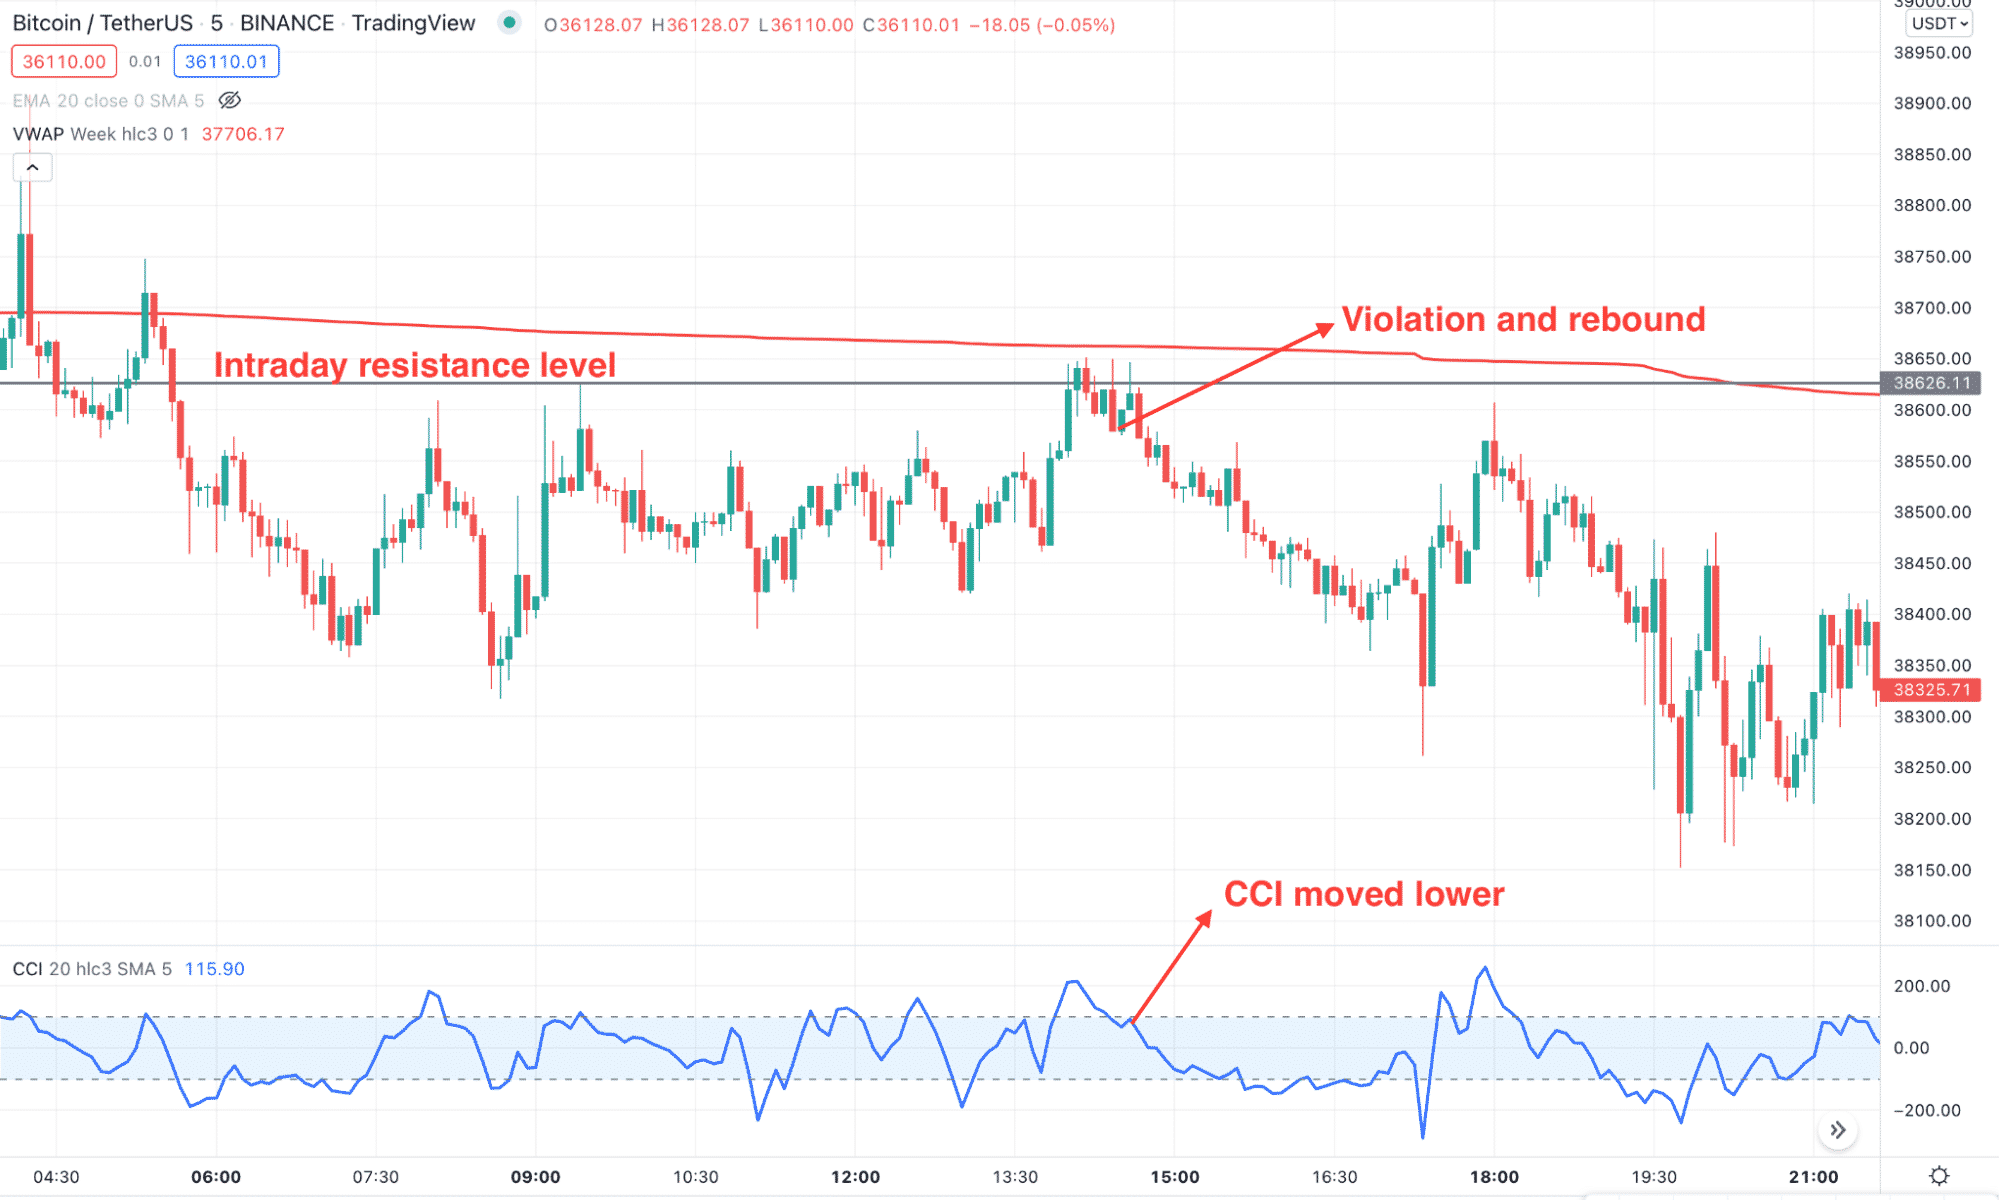
The bearish trade on crypto CFD is valid once these conditions are present in the 5 minutes chart:
- The broader market trend is bearish in the H1 or H4 chart.
- In the 5 minutes time frame, the price moved higher and reached any intraday resistance level.
- The gap between the price and dynamic weekly VWAP is extended.
- CCI moved to the overbought zone and showed a rebound with a bearish rejection candle.
Stop loss
The ideal stop loss is above the rejection candle with some buffer.
Take profit
The first take profit is the rapid swing low, but traders can extend it following the long-term market direction.
A long-term trading strategy
In the long-term trade, traders can find the perfect zone from where the reversal may happen.
Bullish trade scenario
Long-term buy trade
In the buy trade, this method will say when the bearish pressure has been completed and bulls are ready to take the price up.
Entry
Before taking a buy trade using the strategy, make sure to find these conditions in that daily chart:
- The price has moved lower in the higher time frame and reached a significant support level.
- After reaching the support level, wait for the violation. It might happen by immediately taking out the liquidity below the support level with a wick and rebound.
- The index should rebound higher from the oversold level.
- The price moved higher with a bullish rejection from the support level, while the dynamic 20 EMA is above the price.
Stop loss
The bullish sentiment is valid as long as the price trades above the critical support level. Therefore, you should wait until the price moves below the rejection candle to consider it invalid.
Take profit
As it is a long-term trend, you can hold the buy trade for the long run. If the price action allows, you can hold it for years.
Bearish trade scenario
Long-term sell trade
The bearish trade is valid for grabbing the opportunity, while the long-term trend is bearish. However, this trade is suitable for margin trading, where taking sell trades is possible.
Entry
Find these conditions in the daily chart before taking a sell trade in the daily chart:
- The price is trending higher by creating higher highs but reaching an important resistance level.
- A strong bearish rejection appeared from the resistance that closed with a daily candle.
- CCI turned lower from the overbought position and the dynamic 20 EMA is below the price.
- The trading entry is valid when the bearish candle closes.
Stop loss
The ideal stop loss is above the rejection candle with some buffer.
Take profit
As it is a long-term trend, you can hold it until the price reaches any significant support level.
Pros & cons
| 👍 Pros | 👎 Cons |
|
|
|
|
|
|
Final thoughts
In today’s lesson, we have seen the detailed use of CCI in cryptoanalysis which is very practical based on our experience. However, investors should use this method under a robust risk management system to get the outcome.


Comments