
Traders are always occupied with foraging for the most appropriate trading tool to apply to their strategies. The best tool must consist of two features. One can help gain a good amount of profits, and another is capable of protecting the dedicatedly earned funds.
Therefore, traders must find the tool able to give a substantial performance in their favor of them to be gainful. And, here comes the wave trend oscillator since it is well developed, accompanying a great extent of accomplishment simultaneously with its capability to couple up with both the function of a trend tool and oscillator.
The following section will see a crypto trading guide comprising trading systems for buying and selling.
What is a wave trend oscillator?
It is the most worthwhile indicator when it comes to spotting the swings. It is also known as the WT oscillator. The WT oscillator is an acute tool that may be executed in a volatile market. It focuses on the opening and closing movements of a new wave trend accompanying the areas of overbought and oversold. Also, the oscillator offers the utility of the two technical indicators.
However, the oscillator is quite the same as the RSI, yet WT can provide the precise outcome on the 12-hours and daily charts even though slower than RSI. While going below the 12-hour timespan may comprise more noise, you might be able to achieve reasonable outcomes. Also, the WT indicator depicts key levels in the middle of -50 to 50. A WT emerges as a dot between -50 and -60 when it activates for purchasing. Reciprocally, when the WT appears as a dot between 50 to 60, it is showing up for the sell signal.
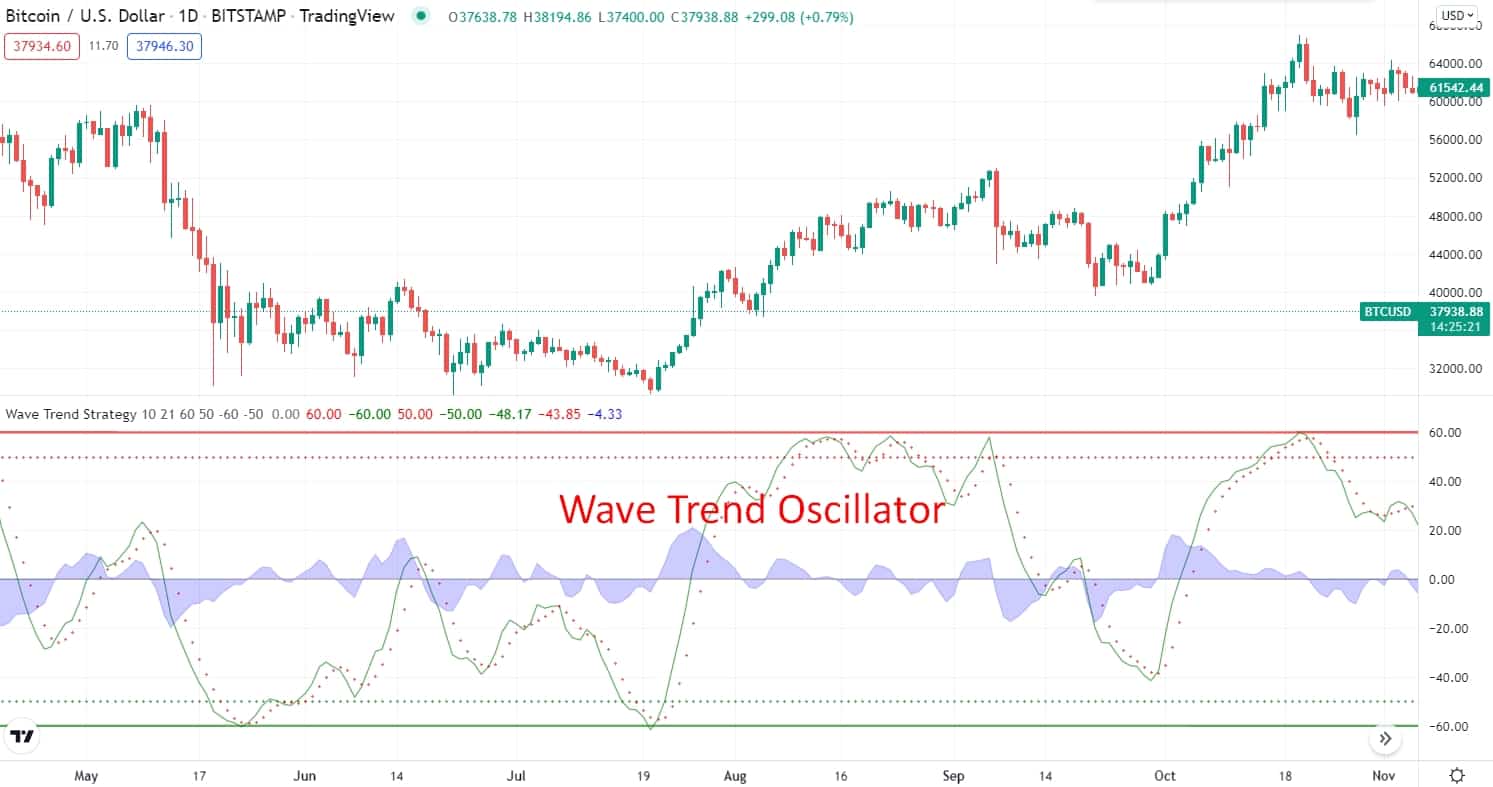
WT on the chart
How to trade using wave trend oscillator in trading strategy?
Oscillators move from one extreme to the other based on a standard definition which means they move from one range to another range. The dynamic of the oscillators makes us advantageous in analyzing whether the prices are high or low. However, the WT oscillator is a relatively new indicator available. Still, traders accepted it since the WT oscillator may provide reversal signals. So, traders may effortlessly decode the present price points.
Moreover, the reversal will change the price directions, and you may wish to understand whether there is any potential for the price shift. A robust downtrend becomes rapidly inversed upward. And, the concept here is to enter into these rallies aforehand they take place. Therefore, the wave trend comes in to help by creating a trendline and the color code before they portray the reversal signals. Afterward, you may have better insights and the potential to enter into robust trades.
A short-term trading strategy
This trading method has been built based on the WT lines crossover. Moreover, this strategy will apply to the M5 and M15 time frames. Also, we will add the 50 EMA trading indicator to the chart to identify the entry and exit points.
Bullish trade scenario
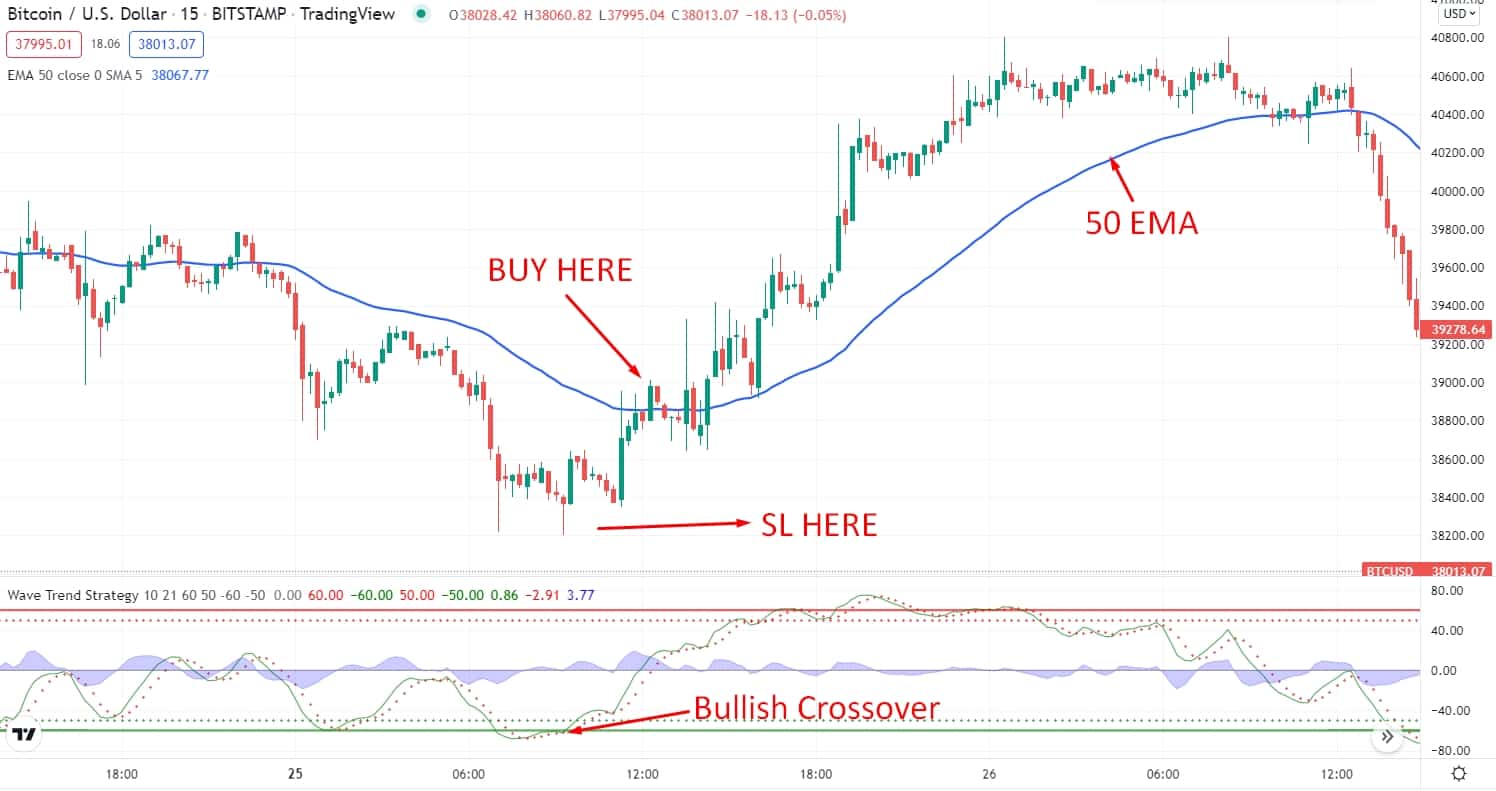
Short-term bullish trade scenario
Entry
Look for the wave trend oscillator’s green line crosses the red dot line from the downside to the upside between -50 to -60 levels. Open a buy trade with an impulsive bullish candle when the price breaks above the 50-period EMA indicator.
Stop-loss
Place the stop loss order below the last swing level with at least a 5-10 pips buffer.
Take profit
Take the profit by calculating at least a 1:3 risk/reward ratio. Or else, you can take the profit when the price breaks below the 50-period EMA.
Bearish trade scenario
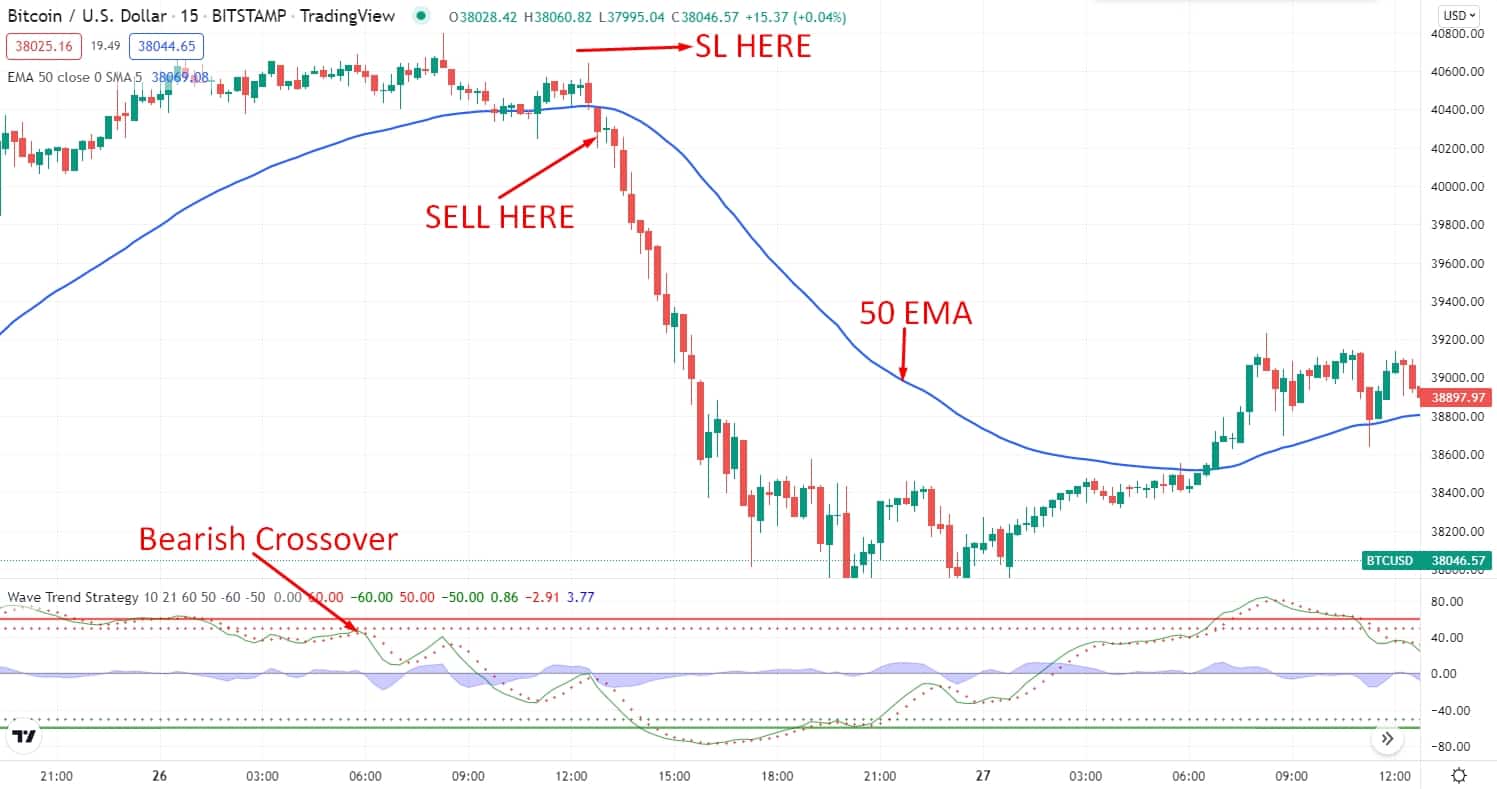
Short-term bearish trade scenario
Entry
Look for the wave trend oscillator’s green line to cross the red dot line from the upside to the downside between 60 to 50 levels. Open a sell trade when the price breaks below the 50-period EMA indicator with an impulsive bearish candle.
Stop-loss
Place the stop-loss order above the last swing level with at least a 5-10 pips buffer.
Take profit
Take the profit by calculating at least a 1:3 risk/reward ratio. Or else, you can take the profit when the price breaks above the 50-period EMA.
A long-term trading strategy
This trading strategy has developed based on the divergence of the market. In this trading strategy, we will use WT indicator lines to identify the divergence of the market in the higher time frames. Moreover, this strategy will apply to the H4 and D1 time frames.
Bullish trade scenario
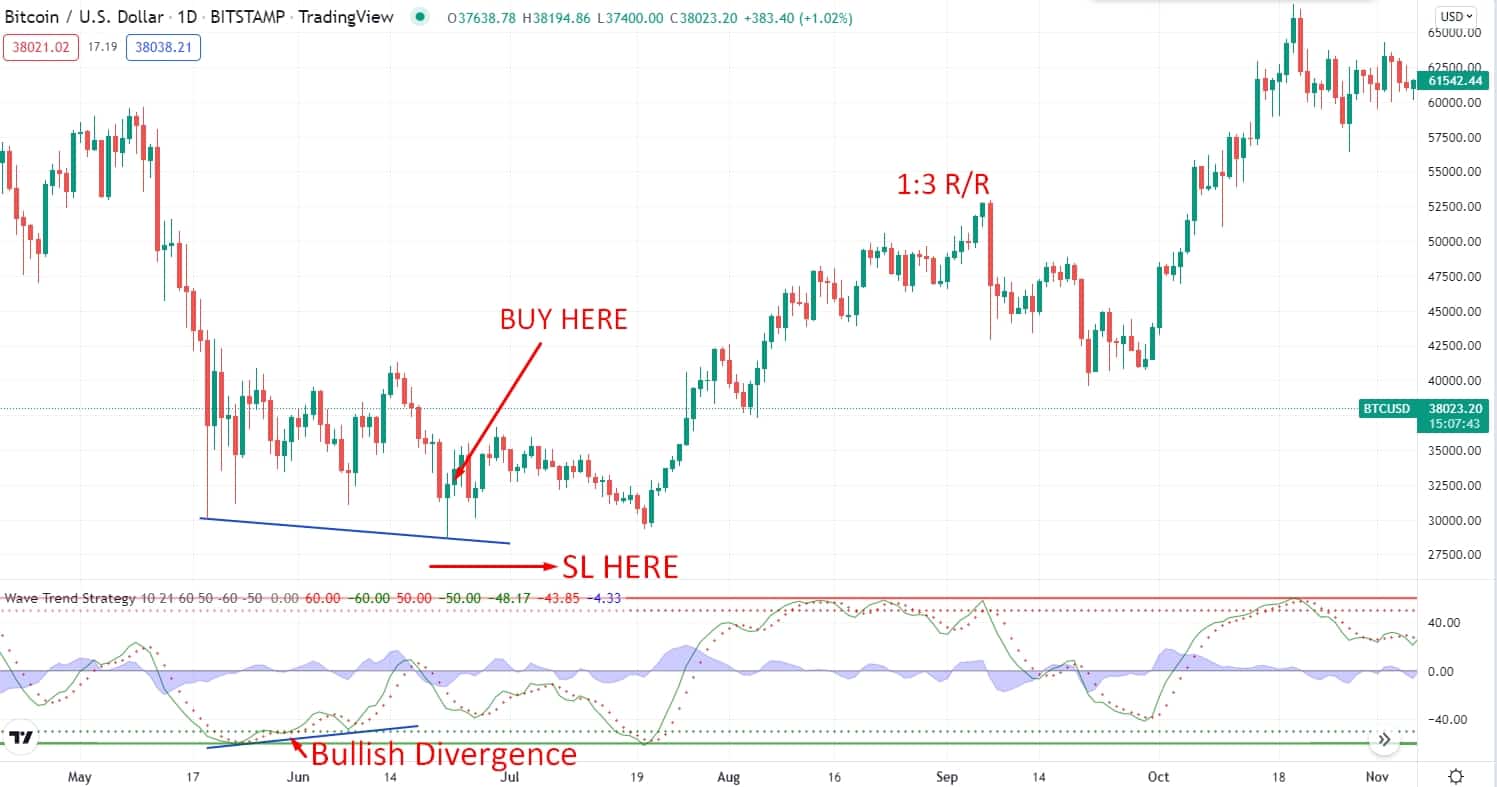
Long-term bullish trade scenario
Entry
Open a buy trade when the price had an impulsive bullish candle close after creating a bullish divergence at the bottom of the chart.
Stop-loss
Put the stop loss order below the entry candle with at least a 10-15 pips buffer.
Take profit
You can take the profit by calculating at least a 1:3 risk/reward ratio. Otherwise, you can take the profit by targeting the upcoming resistance level.
Bearish trade scenario
Long-term bearish trade scenario
Entry
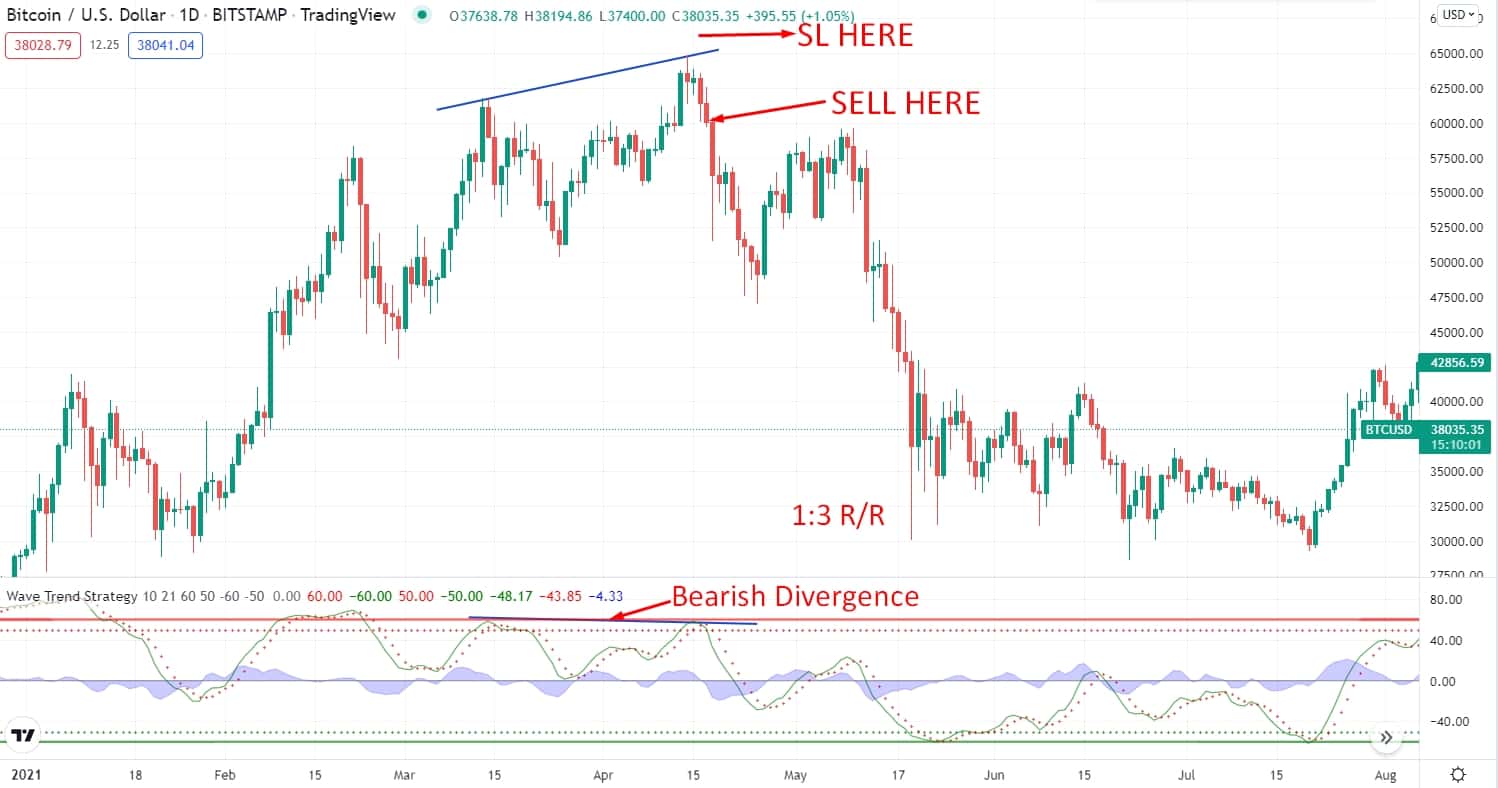
Open a sell trade when the price had an impulsive bearish candle close after creating a bearish divergence at the top of the chart.
Stop-loss
Put the stop loss order above the entry candle with at least a 10-15 pips buffer.
Take profit
You can take the profit by calculating at least a 1:3 risk/reward ratio. Otherwise, you can take the profit by targeting the upcoming support level.
Pros and cons
| 👍 Pros | 👎 Cons |
|
|
|
|
|
|
Final thoughts
To conclude, applying the indicator may contain risks depending on your strategy. You may go for the most avant-garde technical indicators regardless of extra filters. You might do that because the application extent of those indicators is quite limited. Hence, make sure to execute a robust system in the first place. It is better not to attempt to fix it without making sure of what you require.
Therefore, make sure to apply the WT oscillator in combination with the other indicators. Trend indicators may be the best match to combine with the wave trend indicator.


Comments