The Sacred Geometry trading system for MT4 is a profitable trend trading method with an impressive history of providing profits. This trading system is so simple that a novice market participant also makes a profit from it. This method uses several conditions that reduce pressure from the trader and make the strategy effective.
The strategy has mainly focused on market momentum, which has been illustrated as a channel line. Moreover, this method uses multiple time frames to identify the definite momentum of the market. In this strategy, we can observe the market from different angles, which will help to better understand with higher accuracy.
As this trading method is built on many tools, we will always search for confirmation from those indicators. Furthermore, we will utilize the Awesome oscillator and X-Forecaster to increase trading probabilities.
What is the sacred geometry trading system for MT4?
It is a more straightforward trading method that seems complex at first sight. However, the complexity in the trading chart may reduce the effort from traders as these indicators do most of the calculations.
Besides multi-time frame channels, it has other indicators like Awesome oscillator and price direction like MACD indicators. However, there are always some risks in the financial market, and no trading system can guarantee profit.
The sacred geometry elements
In this trading method, we will be utilizing multiple indicators to identify the price bias with higher accuracy. However, in the world of trading, there is no 100 percent guarantee trading system. So, as we see in this method, you have to build a good trading strategy with higher accuracy.
Let’s see what indicators we will use in this trading system:
- Awesome oscillator
- X-Forecaster
Awesome oscillator
AO is a technical indicator that Bill Williams, a famous technical analyst, has developed. It is mainly a non-limiting oscillator, which provides market strength and weakness. This indicator utilizes understanding the market’s momentum and confirming bias or foresee possible reversal levels. With the overall momentum across a more extensive reference edge, it adequately looks at the ongoing market momentum.
X-Forecaster
A technical indicator calculates the market’s momentum and gives a trend continuation or reversal signal. If the X-Forecaster indicator is green, it means the trend is bullish. On the contrary, if the X-Forester indicator is red, it means the trend is bearish. It is a very easy-to-understand indicator and provides highly accurate trades.
Let’s look at the trading indicator for this strategy.
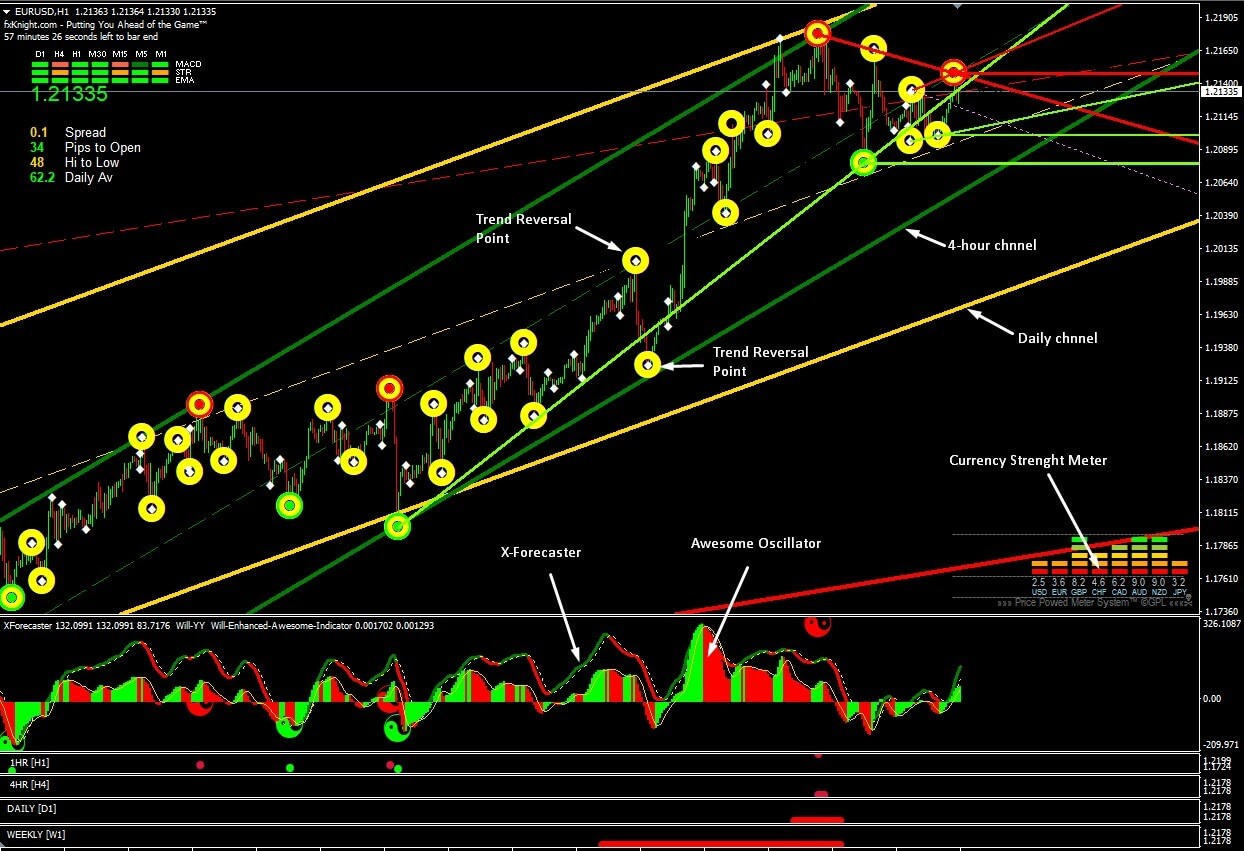
EUR\USD
Bullish trading strategy
Sacred Geometry is suitable for all time frames from five minutes to daily. However, you can get highly accurate trades on H1 and H4 time frames as it extracts the short-term impacts of the economic events.
Furthermore, you can trade with any currency pairs, such as EUR/USD, GBP/USD, AUD/USD, USD/JPY, USD/ZAR, USD/CAD, GBP/JPY, EUR/CAD, EUR/NZD, etc.
Bullish trading conditions
- The price is near any channel support
- X-Forecaster became green in color
- The awesome oscillator is green
- The time frame channel’s green dot appeared
- Yinyan is green
EUR\USD
Entry
After confirming conditions, you should wait for the running candle to close and open a buy position as soon as the candle closes. Otherwise, you can place a buy-stop order a few pips above the running candle.
Stop loss
As it is a trend following trading method, the current bias is hoped to sustain as long as the price presides over the most recent swing low. So, place your stop loss underneath the recent swing low with a 10 to 15 pips buffer.
Take profit
Take the profit by calculating the 1:5 to 1:2 risk-reward ratio. So, if your stop-loss is 20 pips, you should target at least 40 pips. Alternatively, you can target the dash-line to take your profit.
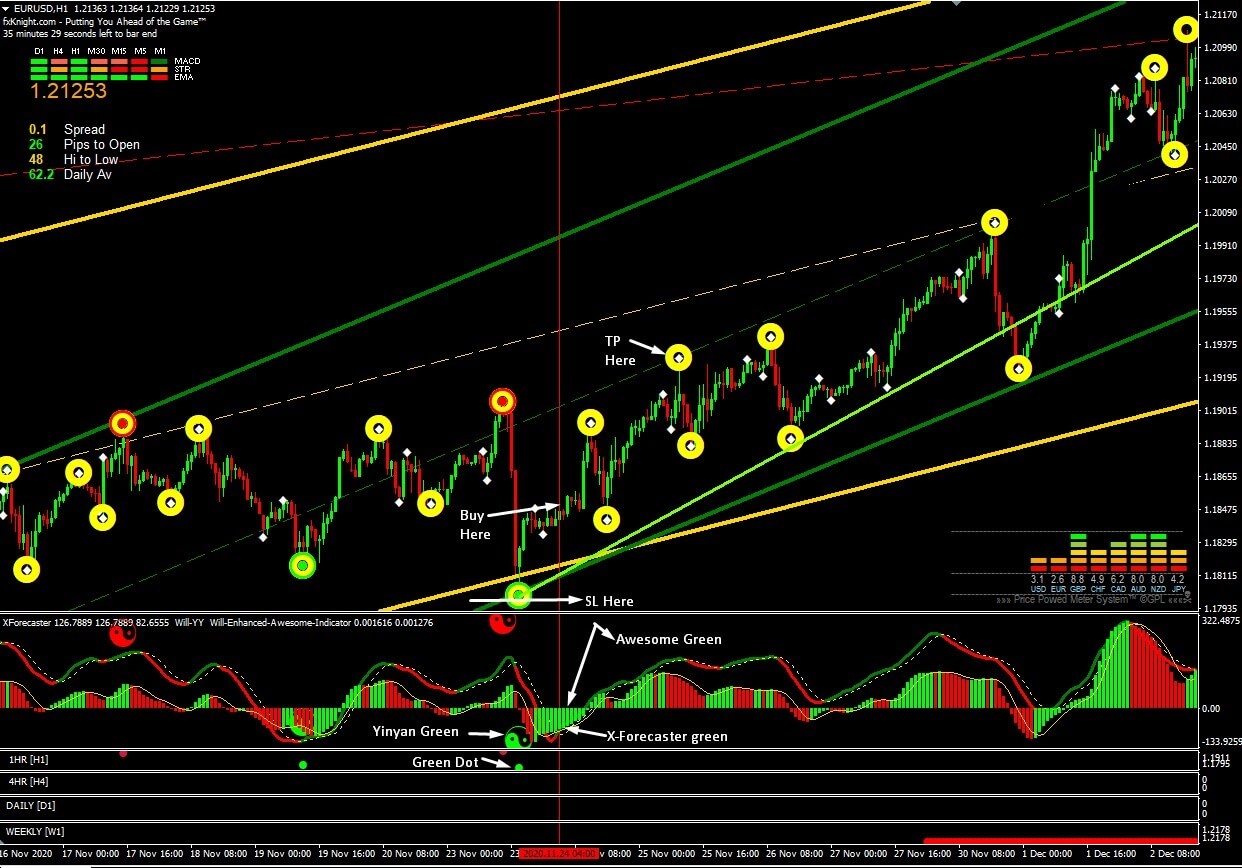
Bearish trading strategy
It is also suitable for all time frames from five minutes to daily. However, you can get highly accurate trades on H1 and H4 time frames as it extracts the short-term impacts of the economic events.
Furthermore, you can trade with any currency pairs, such as EUR/USD, GBP/USD, AUD/USD, USD/JPY, USD/ZAR, USD/CAD, GBP/JPY, EUR/CAD, EUR/NZD, etc.
Bullish trading conditions
- The price is near any channel resistance
- X-Forecaster turned red
- The awesome oscillator turned red
- Time frame channel’s red dot appeared
- Yinyan is red
EUR\USD
Entry
Confirm all conditions and wait for the running candle to close and open a buy position as soon as the candle closes. Otherwise, you can place a sell-stop order a few pips below the running candle.
Stop loss
As it is a trend following trading method, the current bias is hoped to sustain as long as the price resides below the most recent swing high. So, place your stop loss above the recent high with a 10 to 15 pips buffer.
Take profit
Take the profit by calculating 1:5 to 1:2 risk-reward ratio. So, if your stop-loss is 20 pips, you should target at least 40 pips. Alternatively, you can target the dash-line to take your profit.
Final thoughts
This trading method can give you higher returns than traditional systems built on highly accurate indicators. It has been tested several times successfully, and the results are excellent. So, if you practice this method on the demo account, you will realize the power of this trading system.
However, in the world of forex trading, there is nothing like a hundred percent guaranteed profit in every trade. So, in every trading method, success depends on trader psychology and the money management system.
Therefore, to get better results from this trading system, you should use proper lot sizes depending on your capital. Do not risk more than two percent of your money on each trade.


Comments