
The price pattern represents what bulls and bears have done with the price in the past chart in forex trading. Therefore, as intelligent traders, we should understand the future price direction by reading their footprint. In this way, the rectangle pattern has become popular due to its higher success rates in any trading method.
You cannot open a trade just by finding a pattern in the chart. It needs additional attention to the recent price actions and market context to find the most reliable way to make money. In the following section, we will cover the best use of the rectangle pattern with an exact buying and selling condition.
What is the rectangle pattern?
It is a price behavior that repeatedly tests the same high and lows after an impulsive solid pressure. It signifies that investors have become calm and quiet after a strong buying/selling pressure, and they are resting before making another surge.
The primary condition for the rectangle pattern is that it should appear after a strong movement. Therefore, the consolidation and the formation of the rectangle pattern will indicate that the price wants to extend the previous position. Thus, the rectangle pattern is perfect for a trend continuation strategy, applicable to bullish and bearish markets.
The bullish rectangle
It comes after a solid bullish trend where the price remained corrective within a range. The price should move within a horizontal support and resistance level with an equal gap in this pattern. Once the price breaks the range, it creates a trading opportunity.
Let’s see how the bullish rectangle pattern looks like.
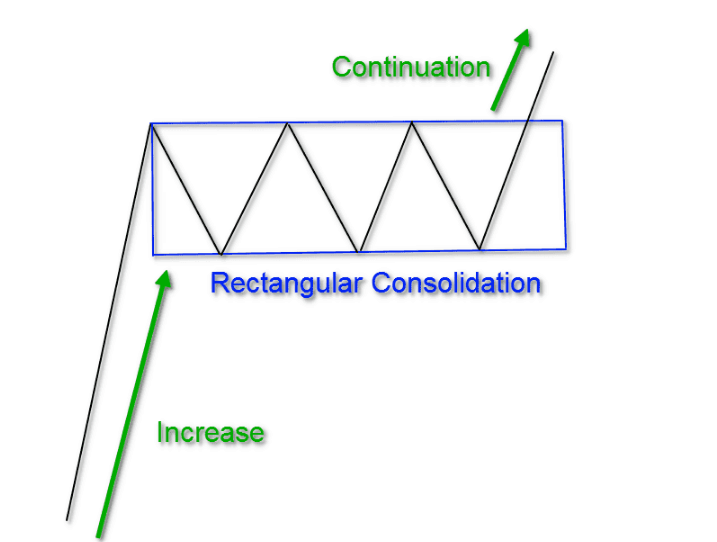
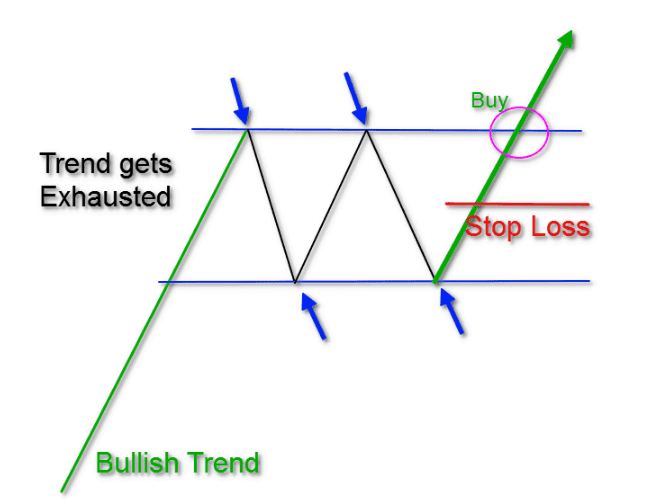
Bullish rectangle formation
In the above image, the increase represents a bullish impulsive pressure from the rectangle pattern, shown in the box.
The bearish rectangle
It comes after a strong bearish trend and shows that bears are interested in taking rests before continuing the bearish pressure.
Let’s see the visual formation of the bearish pattern:
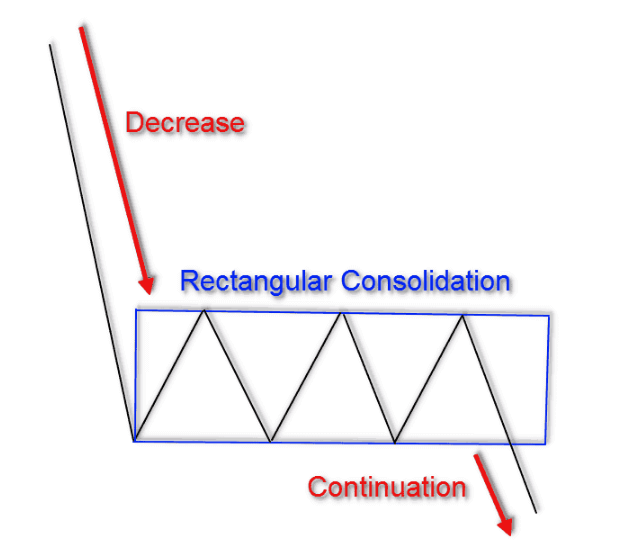
A bearish rectangle formation
The trading strategy becomes valid in this pattern once the price breaks below the rectangle low with a candle.
How to use rectangle patterns in trading strategy?
Rectangle trading is easy for beginner traders. You can find it in the chart by drawing horizontal lines and opening a trade by following some candlestick patterns.
Find the location
In this step, investors should find the rectangle pattern after an aggressive movement with an equally high and low. You can consider the rectangle pattern valid once the price touches the high and low at least two times.
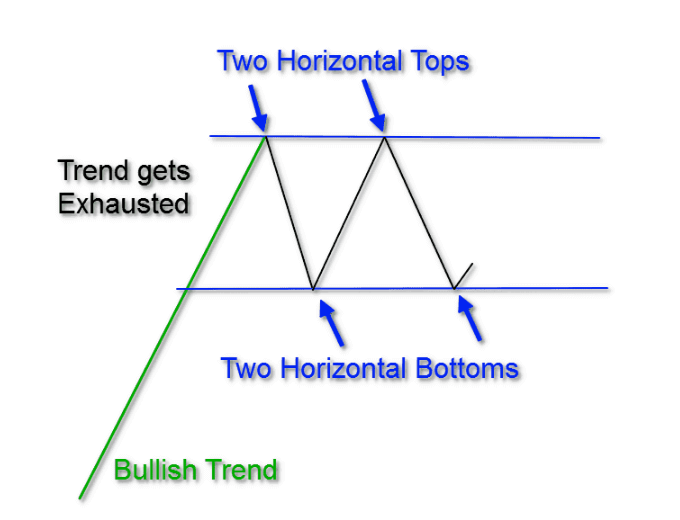
First step
The figure above shows the formation of a bullish rectangle.
Validation
Once the price forms a rectangle pattern, it is not ready to take a trade. Therefore, after completing the pattern, investors should wait for a breakout. The probability of the trade depends on how strong the breakout was. Moreover, make sure that the breakout is towards the major trend. For a better understanding, look at the image below.
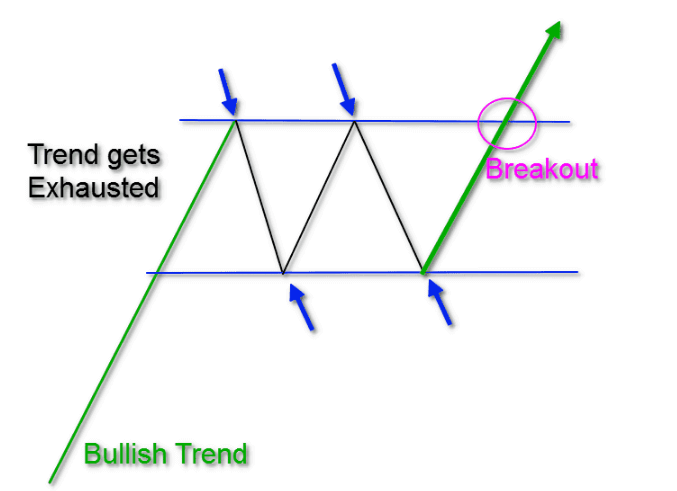
Step two: breakout
Find invalidation
After opening a trade, it is time to find a level to consider the trade invalid. The primary invalidation level is at the 50% of range. If the price reaches this level, it will invalidate the setup. While setting the SL level, make sure to use an appropriate buffer.
Step three: stop loss level of the bullish rectangle
Set the target
The final step is to set how long you should hold the trade. As it is a trend continuation method, you can hold the trade as long as possible. However, booking some profit is always crucial as the global financial market is volatile, and any uncertain market condition can wipe out all gain.
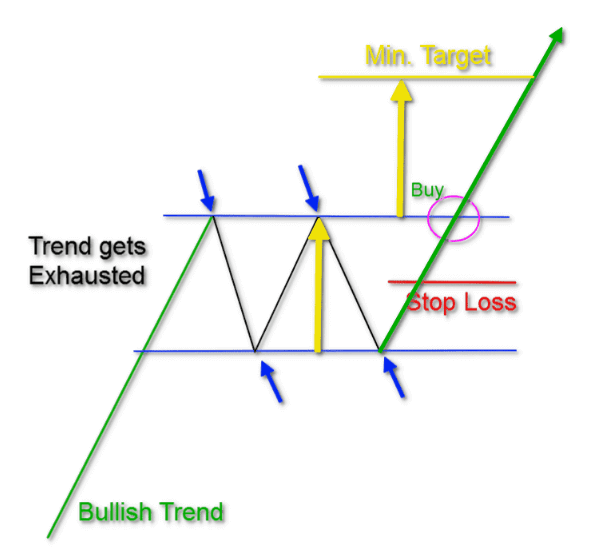
Step four: profit suggestion of a bullish rectangle
This trading technique suggests trades with a 1:2 risk ratio.
A short-term strategy
The rectangle system works well in any time frame from one minute to a weekly chart. Therefore, you can quickly build a short-term trading strategy using this method. In that case, matching the short-term trend with a higher time frame’s direction is essential.
Best time frames to use
As it is a short-term method, sticking to one minute to 15 minutes chart is profitable.
Entry
This pattern is valid once the price makes a solid bullish or bearish movement with an equally high and low formation. During the correction, the price should test the support and resistance level at least two times.
Later on, find the price to break out with an impulsive pressure towards the previous trend. Open a buy position as soon as the price corrects after the breakout. Make sure to see the last one rejection candlestick after the breakout.
Stop loss
The aggressive approach is to set the stop loss at 50% of the range. However, you can set it below or above the range with some buffer to play safe.
Take profit
The ideal take profit level is based on a 1:2 risk: reward ratio. However, as it is a continuation trade, you can hold the gain as long as possible, based on the market structure and strength of the breakout.
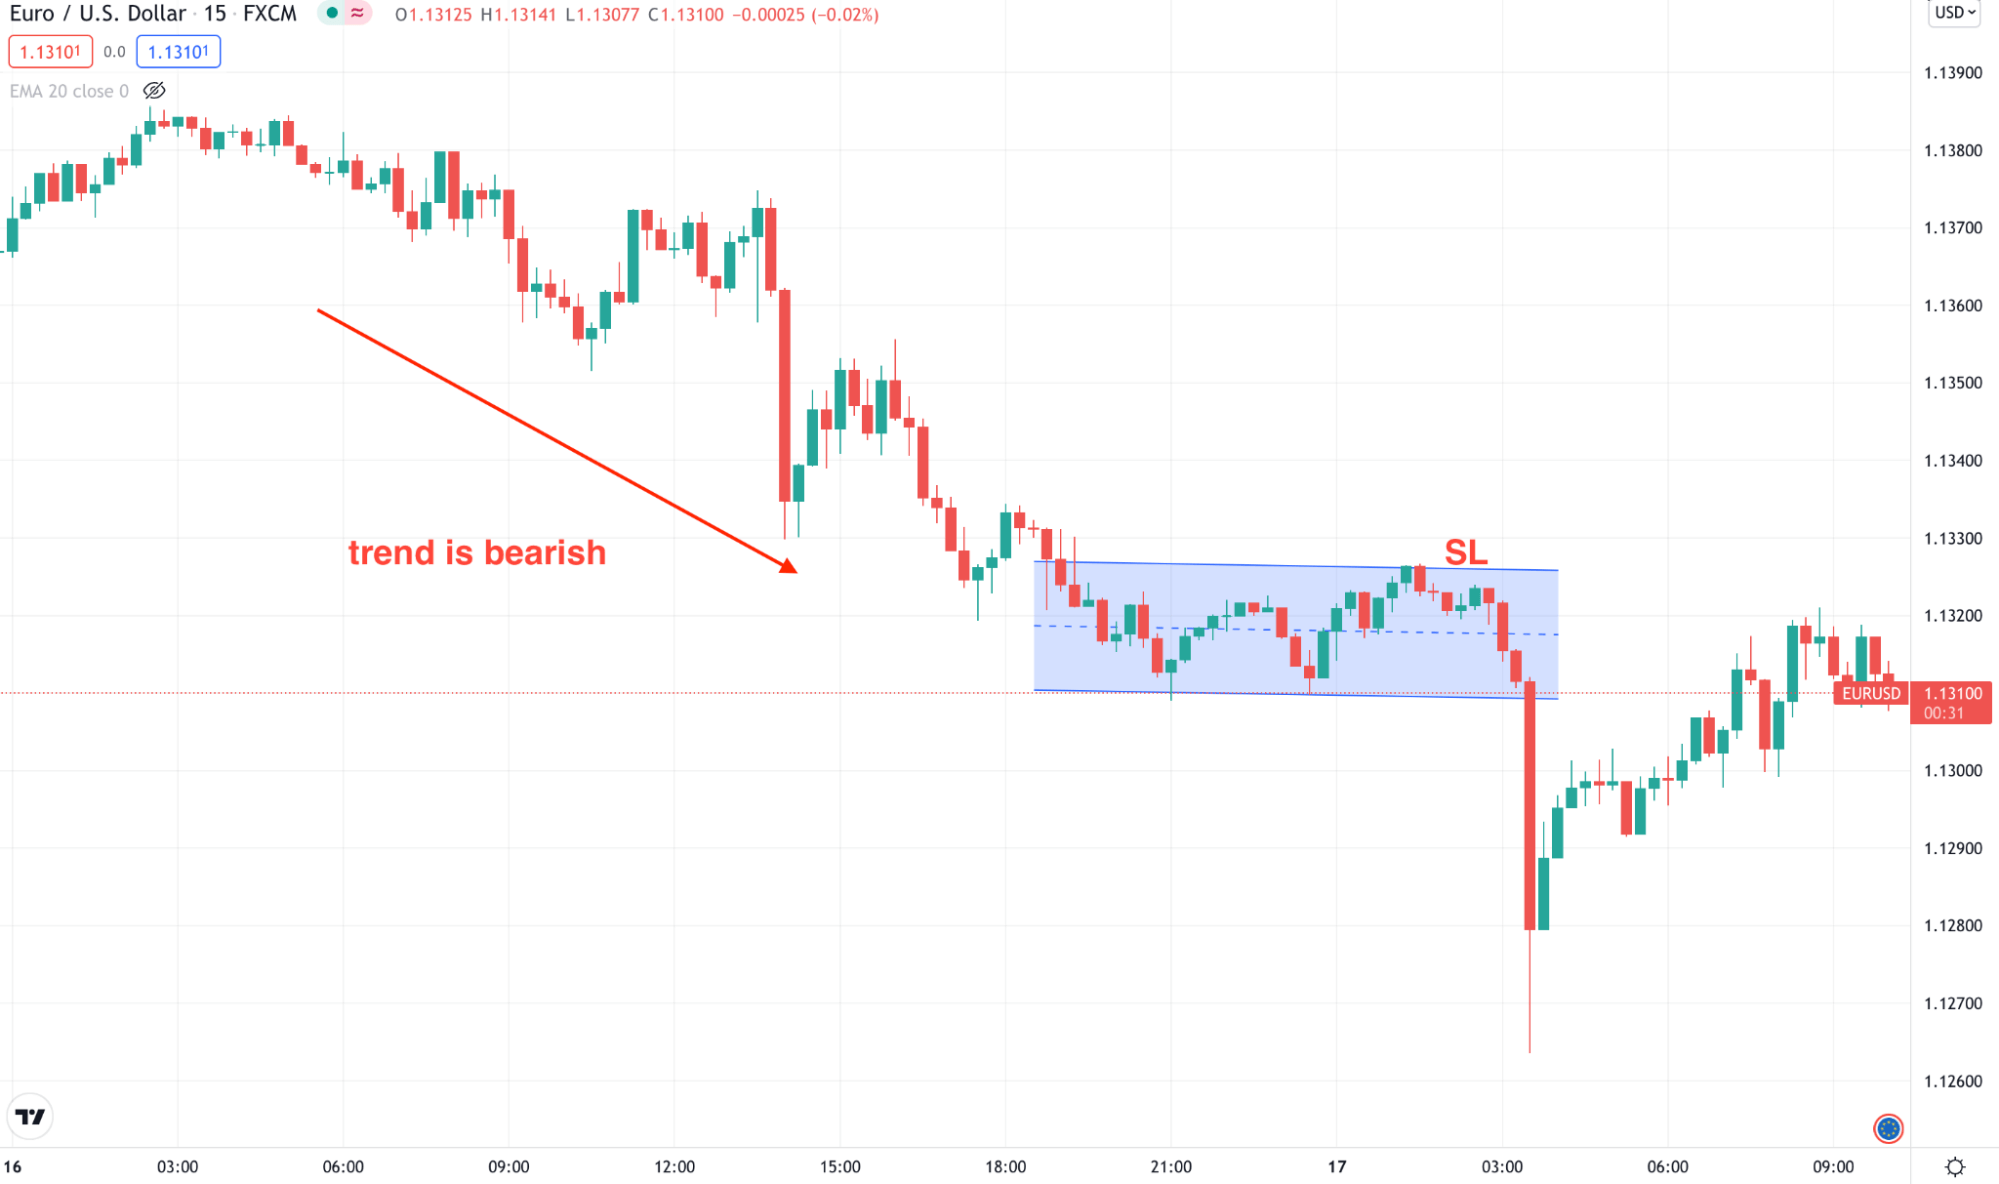
Short-term rectangle trading
A long-term strategy
The rectangle pattern is available in any time frame. However, for higher time frame trading, it is wise to stick to the daily chart. You can build a decent long-term investment or swing trading strategy to gain from the broader market in this method.
Best time frames to use
The long-term strategy is applicable on any time frames from 4 hours to the weekly charts.
Entry
The trading entry is valid when the price breaks from the rectangle pattern with solid buying or selling pressure. Make sure that the breakout happens towards the significant trend. After that, the price should come back to the breakout level and show some candlestick reversal. Open the trade after finding the rejection candlestick.
Stop loss
The aggressive approach is to set the stop loss at 50% of the range. However, you can set it below or above the range with some buffer to play safe.
Take profit
The ideal take profit level is based on a 1:2 risk: reward ratio. However, as it is a continuation trade, you can hold the gain as long as possible, based on the market structure and strength of the breakout.
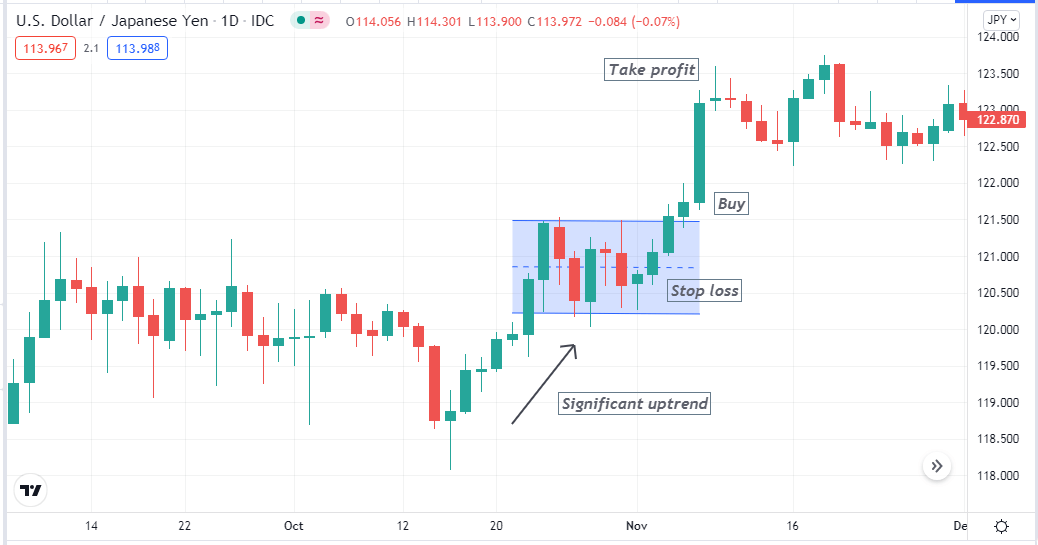
Long-term strategy
Pros and cons
| 👍 Pros | 👎 Cons |
| This is a profitable trend-following method that can provide more profits in the trending market. | This tool needs additional attention to the trade management. |
| The risk and reward ratio in this strategy is affordable. | The method might not work well in uncertain market conditions. |
| The method has no boundary of trading instruments and time frames. | It does consider the fundamental effect of the market. |
Final thought
In any rectangle trading method, investors can make it more profitable by applying the market context. However, it is essential to know where significant traders are taking the price. Therefore, understanding and following the market context is suitable for market participants.


Comments