
In terms of accuracy, the Vortex indicator has picked up steam as a trend-following indicator since 2010 in the January edition of ‘Technical Analysis of Stocks and Commodities’. It can generate buy and sell remarkably precise signals.
Yet, to measure the potential of a tool, it might need a couple of years more of both market testing and experience. In the following section, we will see the complete Vortex trading guide, including taking trades with proper risk management.
What is the Vortex indicator?
It is utilized to define trend reversals; it also confirms ongoing trends. Also, traders can use this tool as an additional confirmation to trade to anticipate the price trends in both manners based on current data.
The indicator is formulated with two lines:
- One shows an uptrend in green color
- Other one shows a downtrend in red
The two lines make a vortex shape while intersecting as a part of the indicator, and the intersection activates signals of buy and sell to crack the highest and lowest ongoing trend actions. There is no categorial indicator setting; hence, it does not produce a bullish or bearish trend.
Generally, the indicator rotates near the highs and lows in a separate window. The positive trend movement is defined by the current high to the previous low gap.
On the contrary, the gap from the current low to the previous high shows the negative sentiment. If the trend moves are robustly positive or firmly negative, it will depict a prolonged length amidst the two numbers; besides, a shorter length will be rendered if the trend moves are infirmly positive or negative.
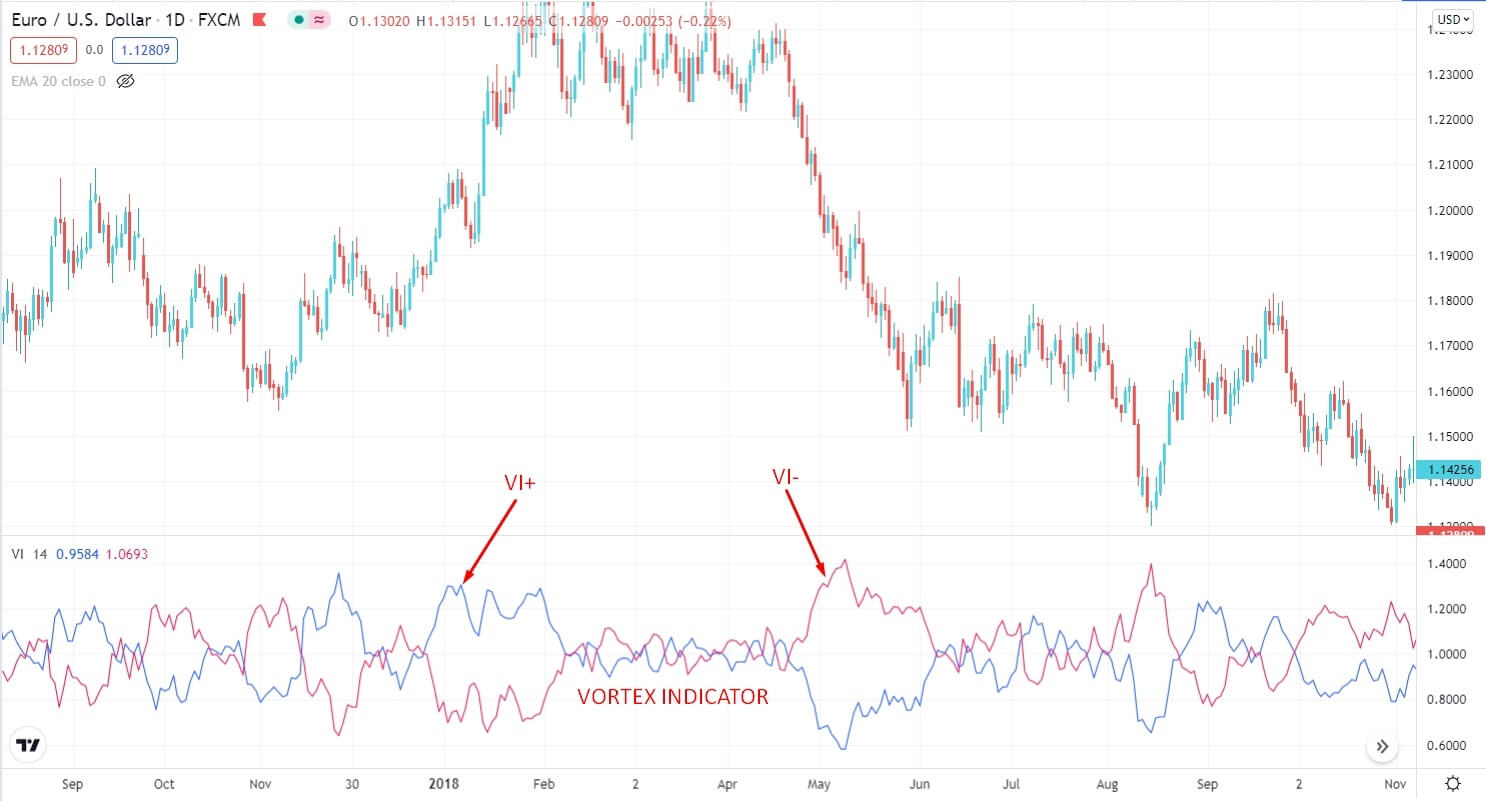
Vortex indicator on chart
How does the Vortex indicator work?
The indicator utilizes previous price data. It is a component of momentum class and defines the price trends. The price bar portrays the highest and lowest price of the asset in different periods, and VI is based on the uses of the price bars.
As mentioned earlier, the indicator comprises two lines that define uptrends and downtrends.
- Uptrend is also shown as the green line called positive Vortex or VI+. Besides, the downtrends are depicted in a red line known as VI- or negative Vortex.
- However, a potential uptrend is manifested if the VI+ cuts through the VI- also, if VI+ presides over the VI- then it confirms a positive price trend. On the contrary, the whole thing can be reversed if the VI- intersects VI+ commencing a potential downtrend. Moreover, it can confirm a negative price trend if the VI- resides over VI+.
A short-term trading strategy
The short-term trading technique using the tool is the most profitable trading system. This strategy has been built based on swing trading. The indicator helps short-term traders find out the shorter swings on the chart and make profits.
However, to better use the Vortex indicator and to add more confirmation, you can use other technical indicators like moving average, MACD, stochastic oscillators, etc.
In this short-term trading strategy, we will use EMA to identify the market direction and breakout points for high accuracy entries.
Bullish trade setup
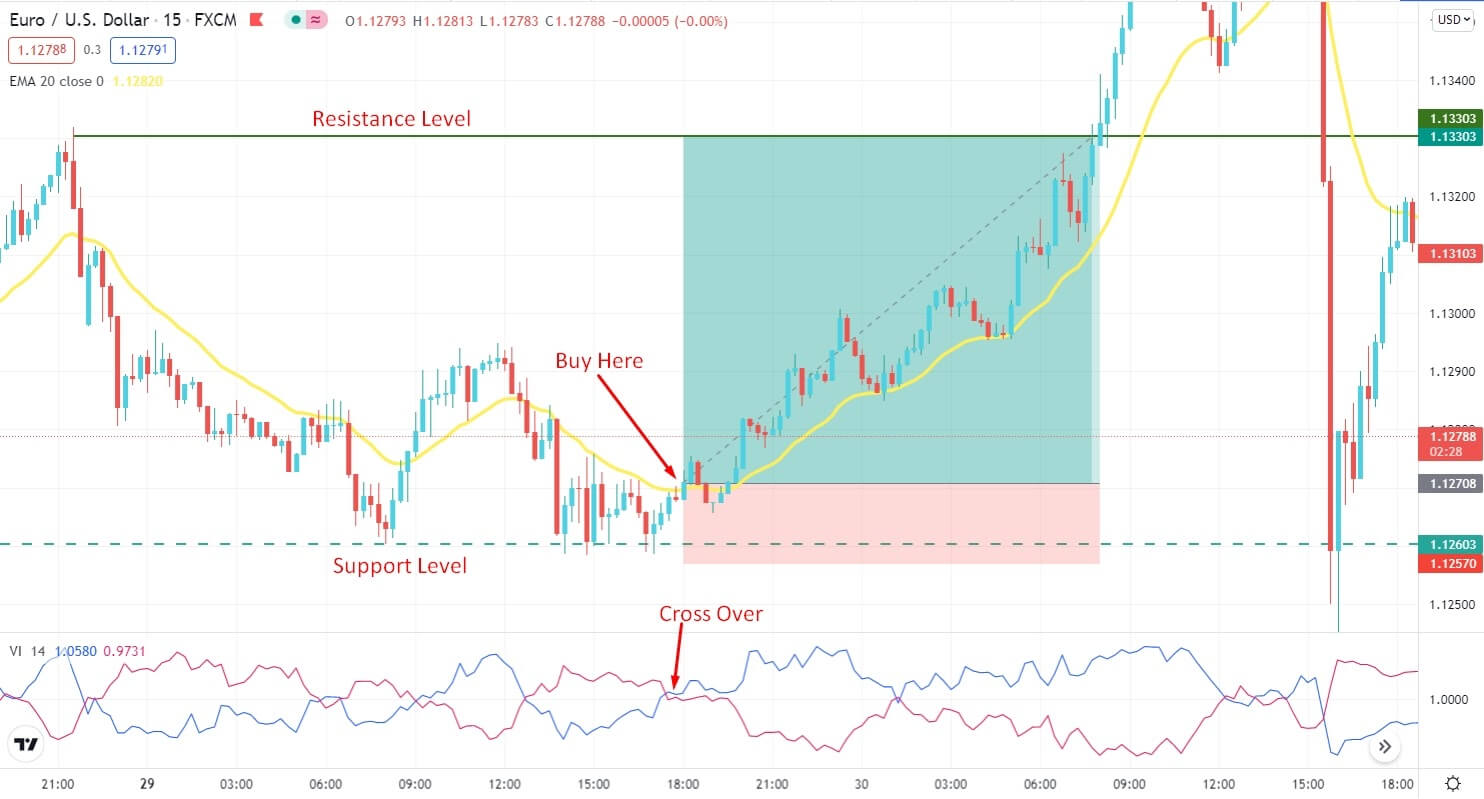
Bullish short-term strategy
Entry
Place a buy order when the price has a bullish candle close above the dynamic level of 20 EMA, and the VI+ crosses over the VI- from downside to upside.
Stop-loss
Place your SL order below the last swing level with a 4-5 pips buffer. Or else, you can put stop loss below the last support level.
Take profit
Take the profit when the price reaches the next resistance level. Otherwise, you can take the profit by targeting a 1:3 risk/reward ratio.
Bearish trade setup
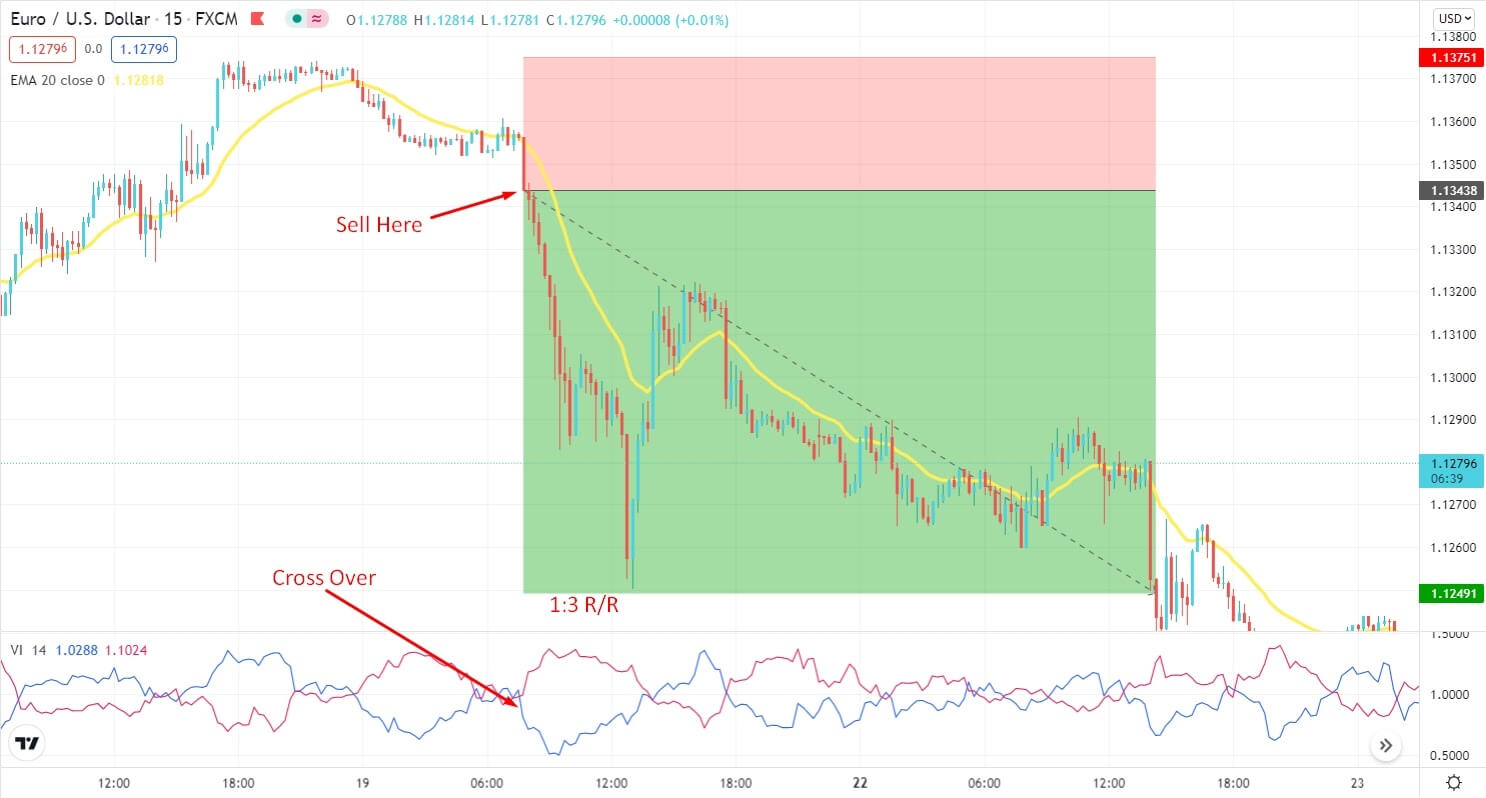
Bearish short-term strategy
Entry
Place a sell order when the price has a bearish candle close below the dynamic level of 20 EMA, and the VI+ crosses below the VI- from upside to downside.
Stop-loss
Place your SL order above the last swing level with a 4-5 pips buffer. Or else, you can put stop loss above the last resistance level.
Take profit
Take the profit when the price reaches the next support level. Otherwise, you can take the profit by targeting a 1:3 risk/reward ratio.
A long-term trading strategy
As we all know, that market structure breakout/support-resistance breakout indicates the future market direction in the long run. We have built a long-term trading strategy using the Vortex indicator by keeping this in mind. Additionally, we are going to use the MACD indicator for better confirmation.
Bullish trade setup
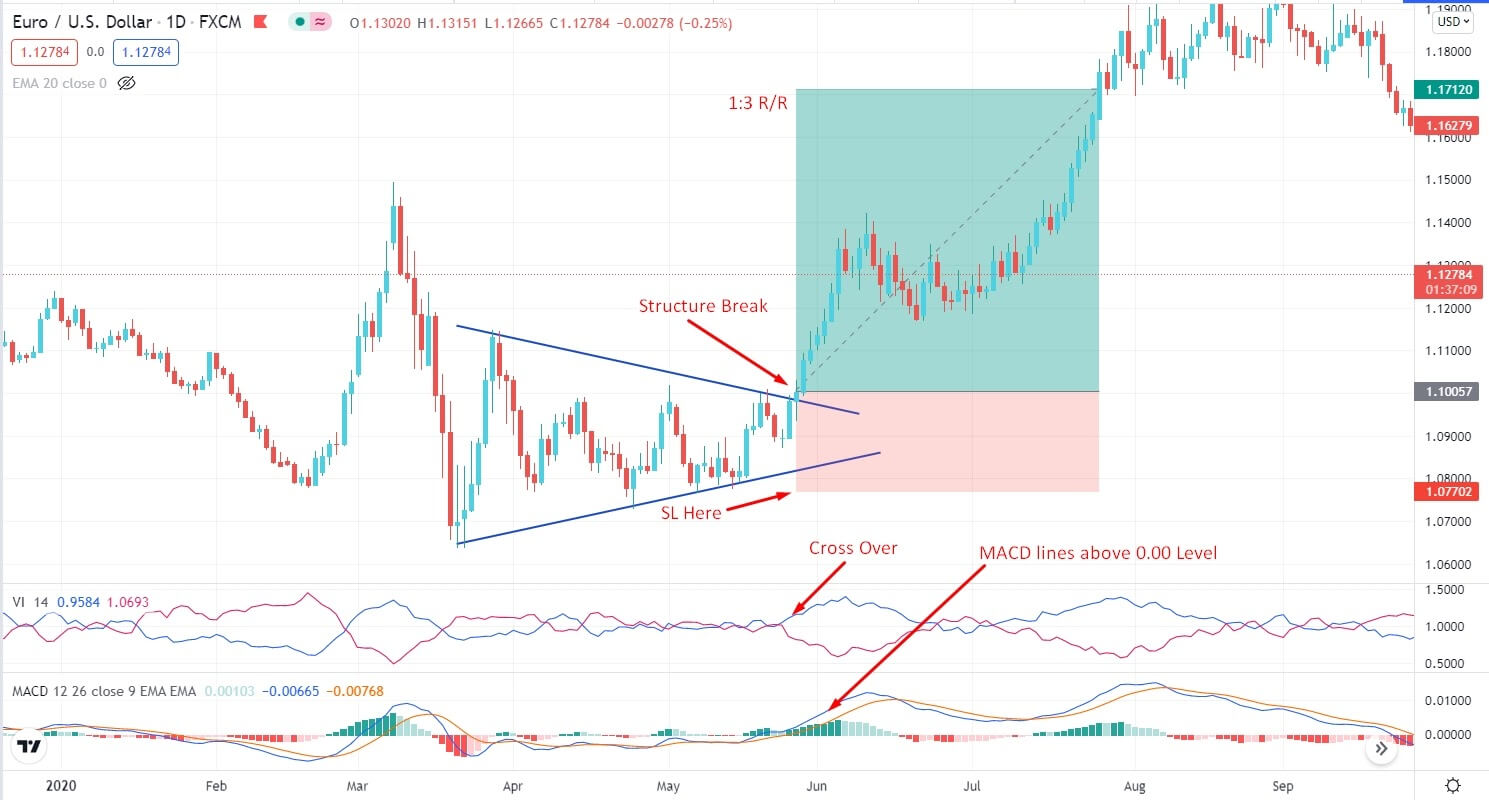
Bullish long-term strategy
Entry
Enter a buy trade when the price breaks above the resistance level and has a daily bullish candle close.
Stop-loss
Put your SL order below the last swing level or the recent support level.
Take profit
Take the profit when the price hits the next resistance level. Otherwise, take the profit when the trade archives a 1:3 risk/reward ratio.
Bearish trade setup
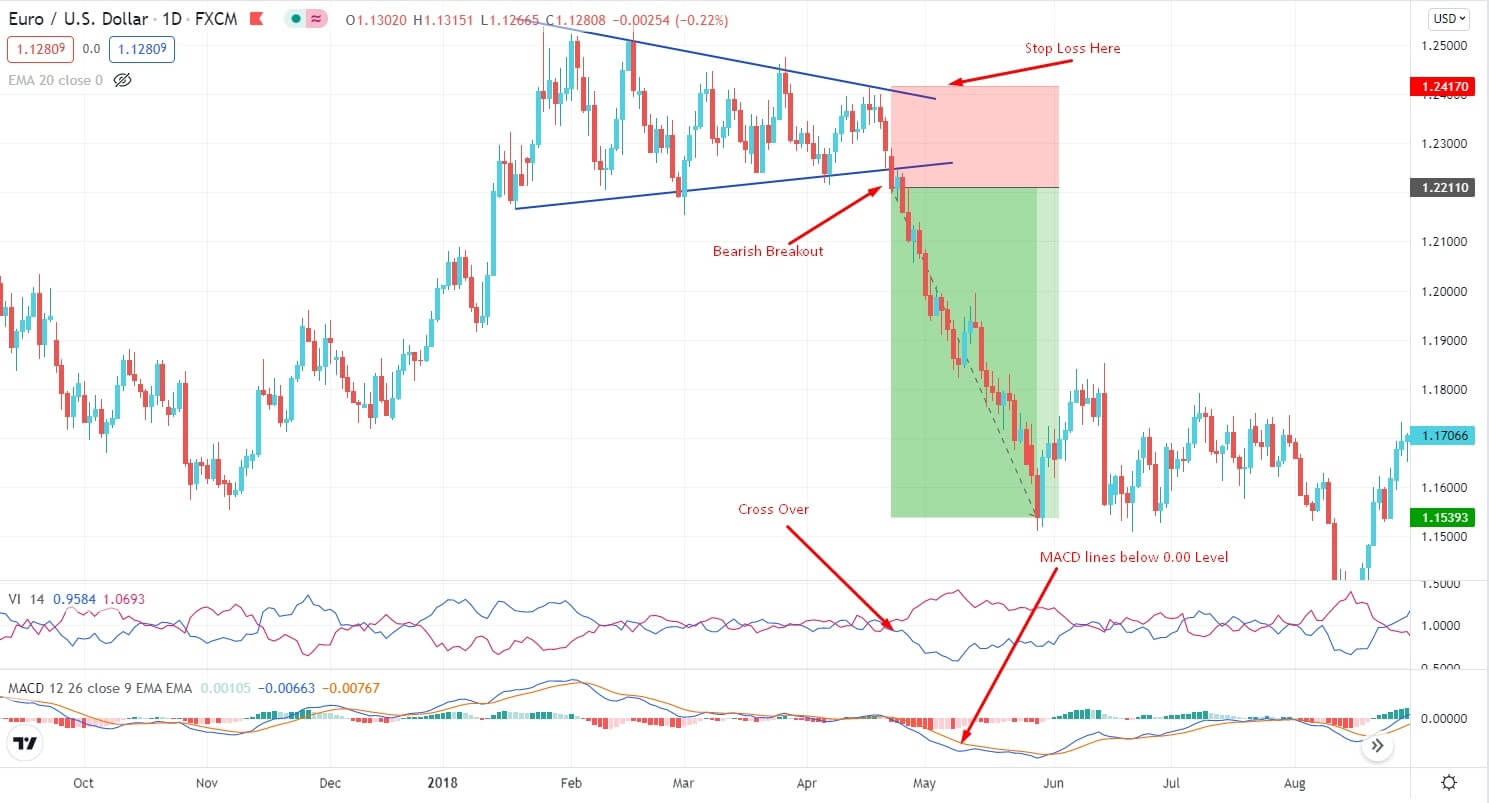
Bearish long-term strategy
Entry
Enter a sell trade when the price breaks below the support level and has a daily bearish candle close.
Stop-loss
Put your SL order above the last swing level or the recent resistance level.
Take profit
Take the profit when the price hits the next support level. Otherwise, take the profit when the trade archives a 1:3 risk/reward ratio.
Pros and cons
| 👍 Pros | 👎 Cons |
|
|
|
|
|
|
Final thoughts
In a nutshell, the Vortex is a remarkable momentum indicator. It aids in defining and confirming the new and accelerating trends, including buy and sell signals. Also, the indicator can be used in all periods and can be combined with other technical figures to generate a better outcome.


Comments