
Let’s talk about the most preferred and widely chosen option from a continuous trading setup or a reversal. You will notice the reversal trading option will be the winner — traders and investors of all kinds like opting for reversal.
One of the reasons this happens is the more significant risk to reward they gain if they get a correct position. Now, this might sound interesting but getting that early, and the right position is pretty challenging for any trader, for that matter.
Choosing your strategy right and using the correct time frame is the key to finding the reversal. But at the same time, it is way too tough to identify the right one. So, in this article, we have bought you one of the most famous candlestick patterns called the pin bar candle, which works almost all the time. Let’s look into the article to know more about utilizing it using the multi time frame analysis.
What is multi time frame analysis?
It is a forex trading strategy in which a trader uses different time frames to look for trend direction followed by rejection and trade execution.
In recent times, the multi time frame is the talk of the town, surpassing many other strategies in the trading world. Many traders also use the word “top-down approach” trading strategy for multi time frame strategy.
The best part of using this analysis is that you do not necessarily need to use price action. You can use indicators, Elliott waves, or any technique in addition to it. If you know candlesticks analysis, it will be an added advantage for you. Talking about the candlestick, we have one such candlestick formation that goes well with multi time frame analysis, called the pin bar.
What is a pin bar candle?
A pin bar is a single candle representation of price action. Pin bar represents a reversal or a significant rejection due to buyer or seller pressure.
A pin bar candle has two major parts:
- Body
- Wick
The area between the open and the closing price is called the body. The high and the low that the price makes due to rejection is the ‘wick’.
The main significance of this candle is the buyer and seller’s pressure representation. When there is good buying pressure, you will find the pin bar’s body facing up with a wick from its back, while when there is a good selling pressure, the body is formed facing down and the wick on the top.
Trading using pin bar candle using multi time frame analysis
Pin bar candles can be confusing as they occur at very short intervals in lower time frames. If you have to master the pin bar strategy, you must use a higher time frame, say 4hr or daily.
A pin bar is both bullish and bearish. In addition to using pin bar with multi time frame usage created a solid trading setup when carried out correctly. Over said this, let us see how you can trade pin bar using multi time frame analysis.
Bullish
A bullish reversal pin candle occurs when the market is bearish trend-making lower high and lower lows. When the market is heading down, and near support or sudden market behavior forms a pin bar candle rejecting the price from not making it move further down. This shows the price does not want to go down, and buyers are stepping into the market.
You can see this from the below GBP/USD example. Here the price was moving down, making lower highs and lower lows. This phase allows more sellers to participate as very traders want to place their trades in the direction of the trend. Moving forward, you can see a pin bar candle forming at the swing low, stating the entry of buyers in the market.
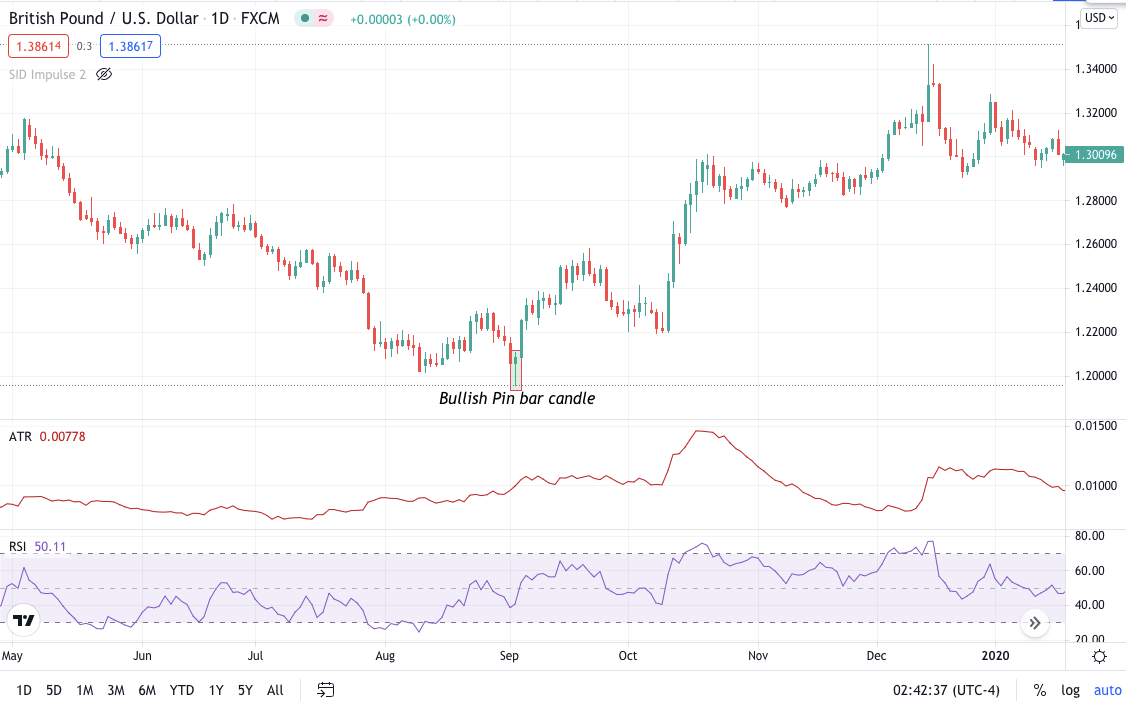
GBP/USD bullish pin bar chart-Daily
Moving down to the 4hr time frame, you can see the market was moving down, and from the point of pin bar formation, you can see the market shooting straight up. The pin bar formation here shows the buyer stepping in.
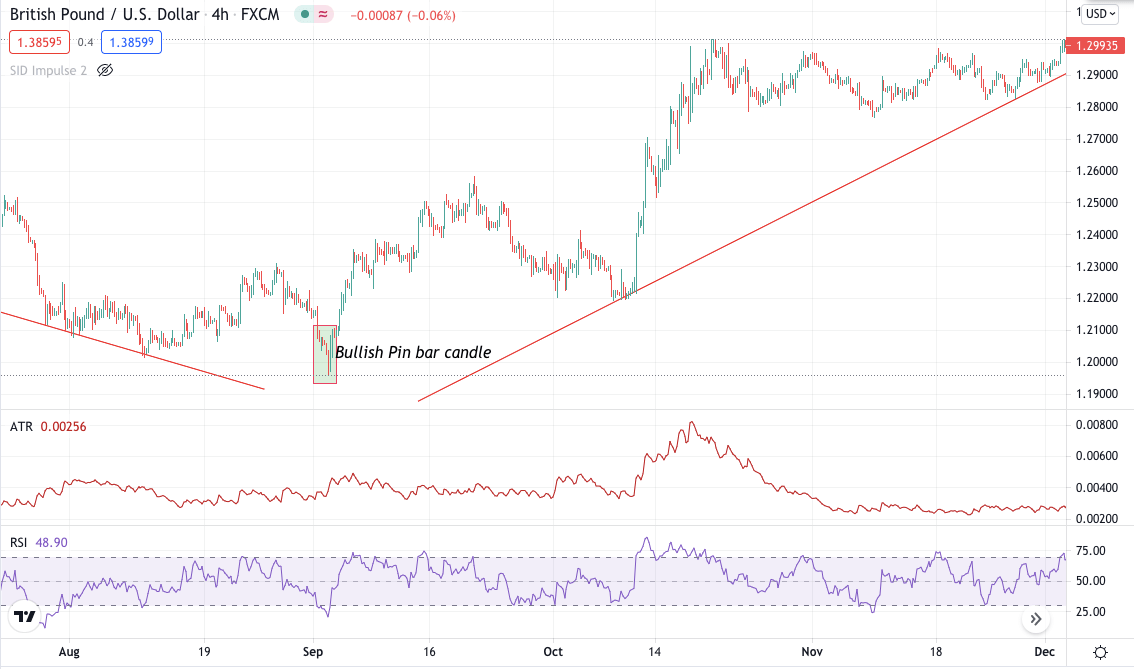
GBP/USD bullish pin bar chart-4hr
Bearish
A bearish pin bar candle works opposite a bullish pin bar. This candle will occur when and is effective when the price moves up and shows an uptrend. When the market is heading up, near resistance or sudden market behavior forms a pin bar candle rejecting the price from not making it move further up. This shows the price does not want to go up, and sellers are stepping into the market.
You can see this from the below GBP/USD example. Here the price was moving up, making higher highs and higher lows. Moving forward, you can see a pin bar candle forming at the swing high, showing the entry of sellers in the market.
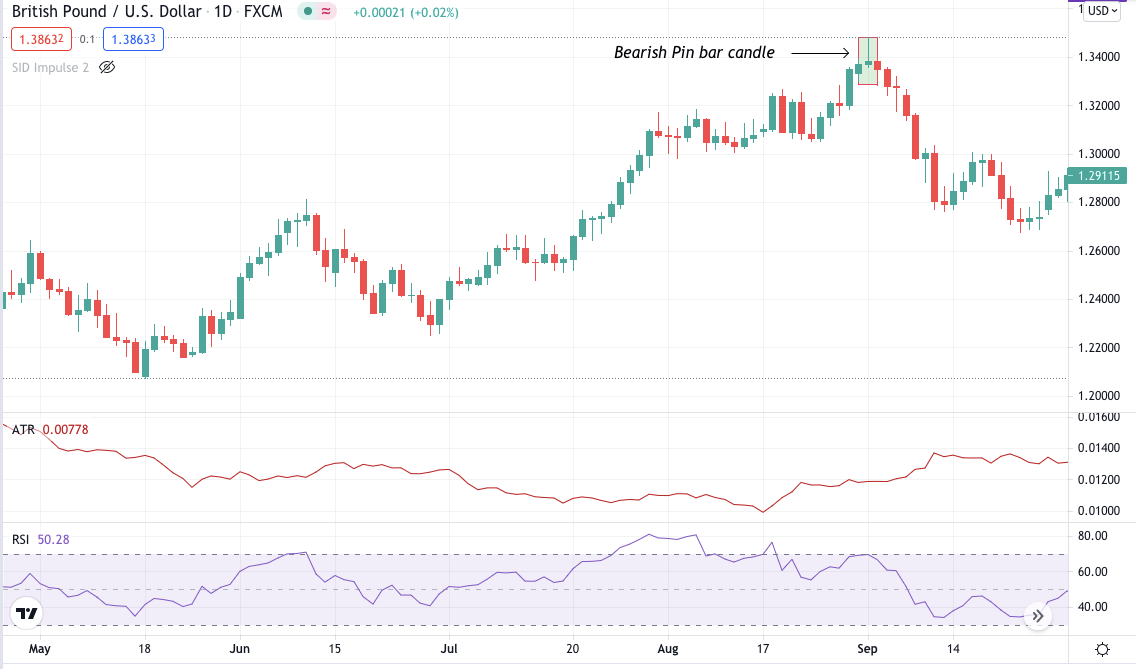
GBP/USD bearish pin bar chart-daily
Moving to the lower time frame 4hr. In the below chart, you can see a dynamic resistance, and the candles were testing it repeatedly. This price structure here is called a multiple rejection setup. When you notice a pin bar in a daily time frame and numerous candle rejections near resistance or support, you can be sure of price reversal.
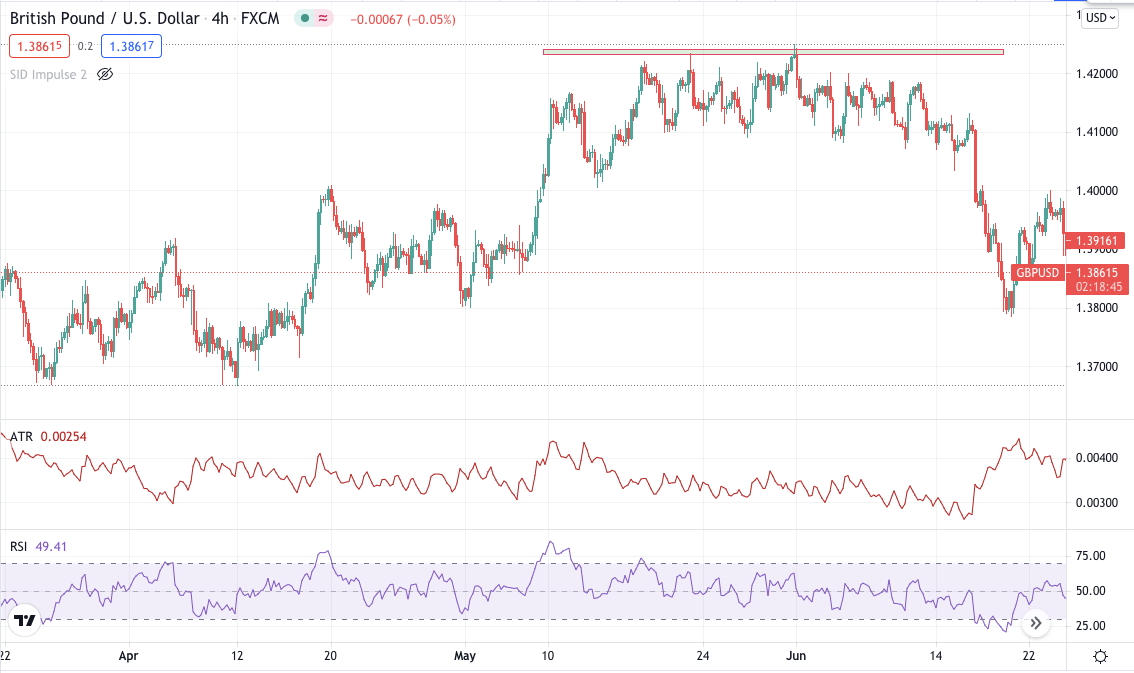
GBP/USD bearish pin bar chart-4hr
Entry
The traders should enter the market at market price because a pin bar candle occurrence at a daily time frame near dynamic support or resistance is rare. You can enter the trade after a pin bar is formed and never in the running candle. After the pin bar is formed, enter the trade at the next candle after the break of the pin bar, high or low.
Stop loss
Stop loss is to be put 5-6 pips lower to the pin bar candle.
Take profit
It depends on where you want to place his TP, but typically, you can place it near the next support or resistance or exit when you find the profit worth taking.
Pros and cons
Nothing is 100% sure, and forex trading is no different. As you might feel and realize, the pin bar candle is worth it, but it also has some cons. Let’s look into the potential pros and cons of using the pin bar candle.
Pros
-
Easy to find on the char
Pin bar candles are easy to find on the chart but on higher time frames.
-
Higher accuracy
A good pin bar is rare, and so it is accurate. Suppose you use any strategy and find a pin bar with an area of confluence if it can be a rewarding trade setup.
Cons
-
Too many formations on lower time frames
Pin bar formations on lower time frames do not have much significance; because of this, you will find many of them on the lower time frames.
-
Can be confusing
All the pin bars are not the same, so you must not treat them equally. It would help if you noticed where the candle is forming and why the pin bar is forming.
Final thoughts
Indicators and price action are two very different things. As said, both can help you gain profits from the market. However, if you have a good knowledge of price action and candlestick patterns, you will be ahead of other traders in the market who are using indicators.
The pin bar is very famous and is widely used but not the same way; you can always have your strategy to trade this candle. In the following article, we will see how to trade pin bars with an indicator and area of confluence.


Comments