
There are many trading indicators available to use in financial trading. Many indicators use the same concept but calculate using different formulas to obtain more accurate results. You can consider the Smoothed moving average (SMMA) one of the remarkable among them.
However, learning the component and calculation pattern of any specific moving average is mandatory before comparing and declaring it the best. This article will introduce you to the SMMA alongside describing trading techniques with chart attachments for better understanding. Later, we will list the top pros and cons to learn potentiality.
What is the Smoothed moving average or SMMA?
It is a different version of the SMA indicator that reduces noise to obtain market data accurately. In the calculation process, this indicator reduces noise or price fluctuations by averaging price values of a particular period. It adds some extra value or weight to the average price as other weighted indicators such as LWMA or EMA. The calculation process is slightly different as SMMA takes all historical data into account but removes short-term market fluctuations and shows the prevailing trend to traders.
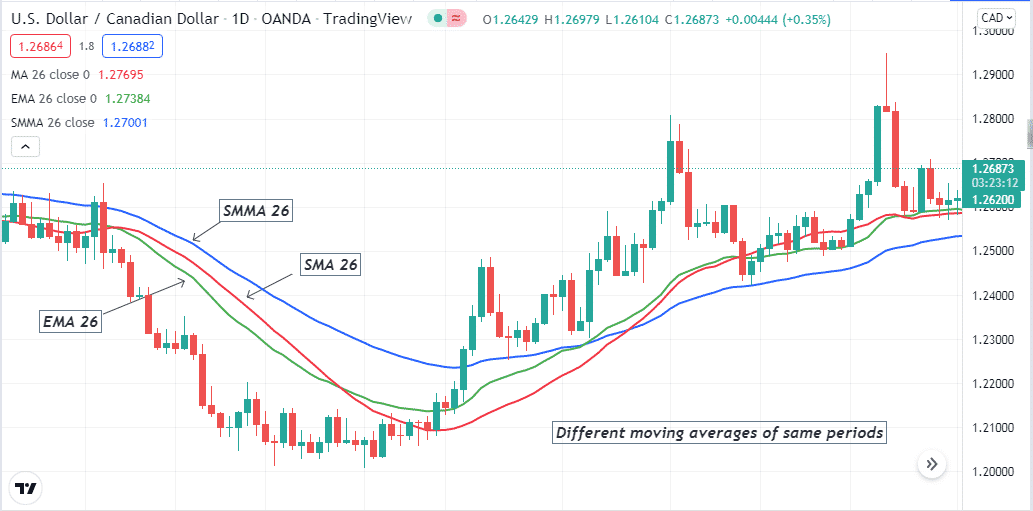
Different MAs of the same periods
The chart of USD/CAD above contains different moving averages of the same periods. The calculating formula may involve some complications; you don’t have to do it manually. Most trading platforms provide this indicator by default.
The formula SMMA use is:
SMMAi = (Sum – SMMAi-1) / N,
where N is the number of periods.
How to use SMMA in trading strategy?
The SMMA is a straightforward technical indicator. You can use it to trade any trading instrument, including currency pairs, stocks, commodities, indices, etc.
Like other MAs, you can use the SMMA indicator to determine support resistance levels, trends, bullish/bearish momentum, sideways, etc. You can make trend-following trading strategies using this indicator that suggests opening a buy position when the price rises or a sell position when the asset price is declining.
SMMA trading strategy
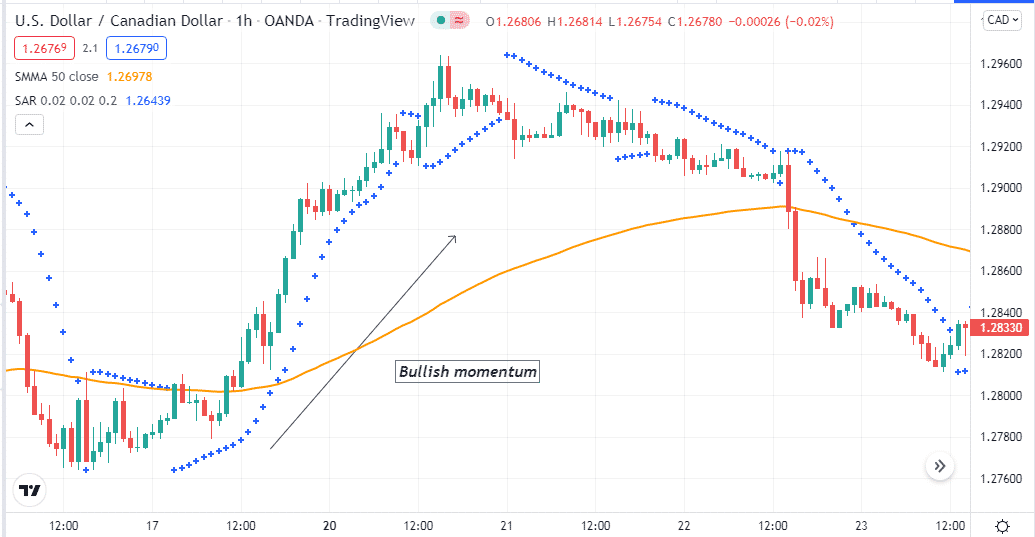
You can use SMMA as a standalone indicator to create a trading strategy or combine other technical tools and indicators to generate trade ideas. For example, you can use the parabolic SAR indicator as a supportive indicator besides SMMA 50. When the price gets above the SMMA line, the parabolic dots appear below price candles; it declares the price is on an uptrend.
A short-term trading strategy
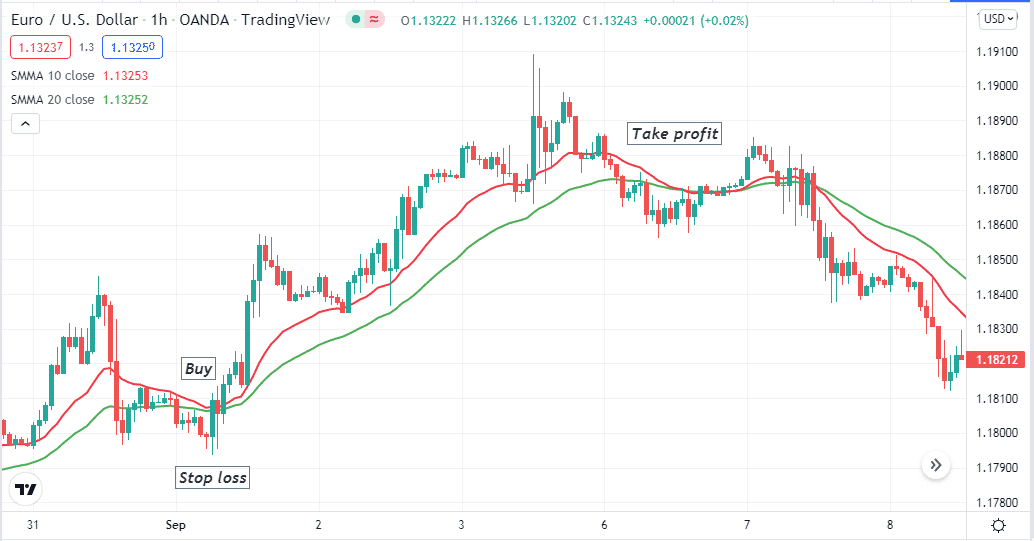
In this short-term trading method, we use SMMA crossover using two different periods. SMMA 10 is a red line, and SMMA 20 is a green line. It is a suitable trading method for any trading instrument that shows promising results on any time frame chart. We recommend using a 15-min or H1 chart to catch the most potential short-term trades.
Bullish trade scenario
When seeking to open a buy position, observe when:
- The red SMMA line crosses the green SMMA line on the upside.
- Both SMMA lines are heading toward the upside.
Bullish setup
Entry
When these conditions above match, your target asset chart declares the price entering is a bullish momentum. This method suggests opening a buy position here.
Stop loss
Place a reasonable SL below the bullish momentum with a buffer of 10-15pips.
Take profit
This strategy usually suggests trades with at least a risk ratio of 1:2 or above. Close the buy position when the bullish momentum ends, or the red SMMA line crosses the green SMMA line on the downside.
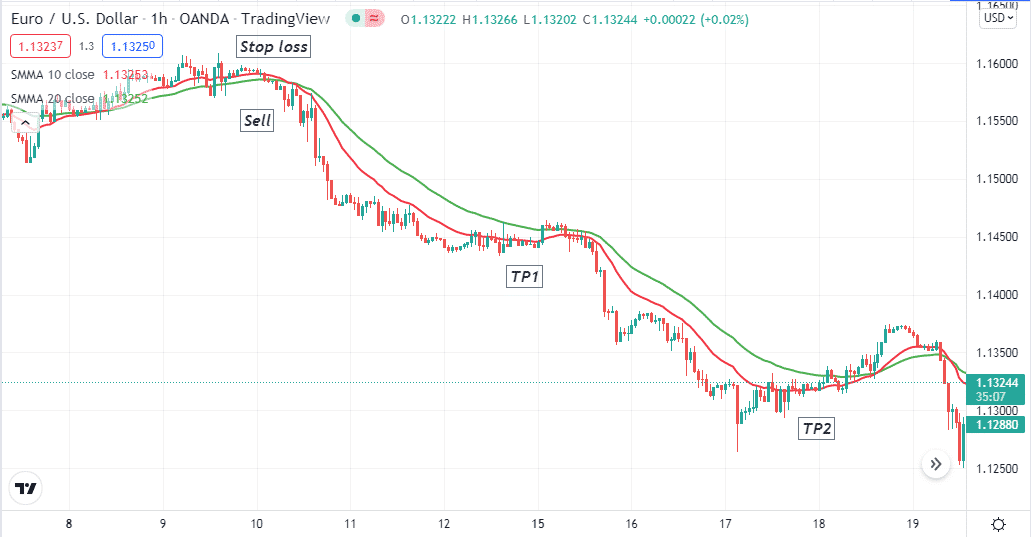
Bearish trade scenario
When seeking to open a sell position, observe when:
- The red SMMA line crosses the green SMMA line on the downside.
- Both SMMA lines are heading toward the downside.
Bearish setup
Entry
When these conditions above match, your target asset chart declares the price entering is a bearish momentum. This method suggests opening a sell position here.
Stop loss
Place a reasonable SL above the bearish momentum with a buffer of 10-15pips.
Take profit
This strategy usually suggests trades with at least a risk ratio of 1:2 or above. Close the sell position when the bearish momentum ends, or the red SMMA line crosses the green SMMA line on the upside.
A long-term trading strategy
We use the SMMA alongside the RSI indicator in this long-term trading method. This method uses an SMMA line of 21 periods, and it is suitable for any trading instrument and allows holding positions for days, even weeks. The recommendable time frame is the D1 chart for this trading technique to catch the best potential long-term trades.
Bullish trade scenario
Seek to open a buy position when:
- The price reaches above the SMMA line.
- The dynamic line of the RSI window is near or above the central (50) level heading on the upside.

Bullish setup
Entry
These conditions above match your target asset chart signal sufficient bullish pressure on the asset price; place a buy order here.
Stop loss
The initial SL level will be below the current swing low.
Take profit
Observe the price movement, close the buy position when:
- The price reaches below the SMMA line.
- The dynamic RSI line reaches the overbought level or starts to decline toward the central (50) line after reaching that level.
Bearish trade scenario
Seek to open a sell position when:
- The price reaches below the SMMA line.
- The dynamic line of the RSI window is near or below the central (50) level heading on the downside.
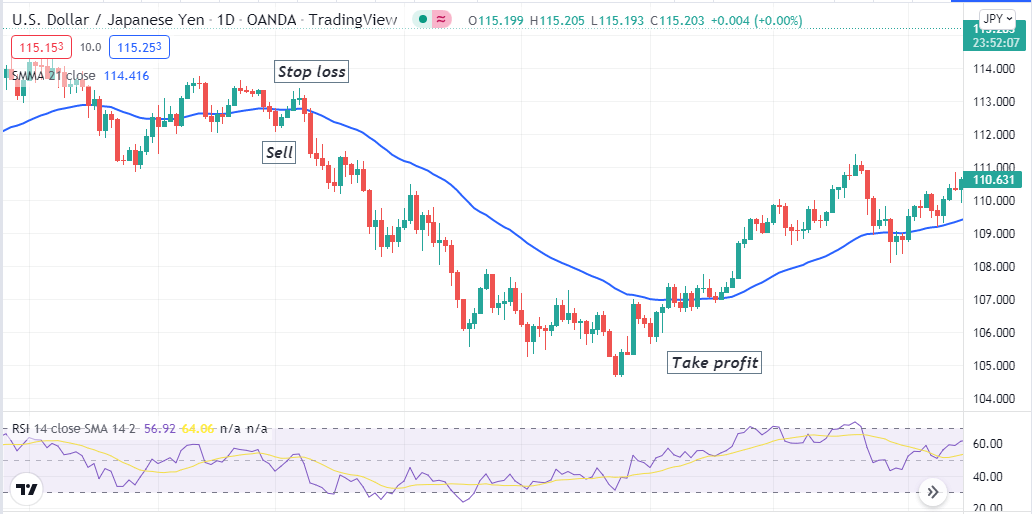
Bearish setup
Entry
These conditions above match your target asset chart signal sufficient bearish pressure on the asset price; place a sell order here.
Stop loss
The initial SL level will be above the current swing high.
Take profit
Observe the price movement, close the sell position when:
- The price reaches above the SMMA line.
- The dynamic RSI line reaches the oversold level or starts to decline toward the central (50) line after reaching that level.
Pros and cons
| 👍 Pros | 👎 Cons |
|
|
|
|
|
|
Final thought
The SMMA is a unique indicator that allows making constant profitable trading positions. We recommend practicing these trading strategies on demo trading to master the concept before applying it on live accounts.


Comments