
Net Unrealized Profit/Loss is a process to calculate the difference between the realized cap and the overall market cap. As a result, investors can determine whether the overall investors are in profit or loss.
Investors use various metrics to find the most profitable buying point in cryptocurrency trading. It is not wise to buy a crypto coin and hold it from a random place for future gain. Finding the most potential point from which the price may rebound immediately is the main aim of traders. In that case, using the profitable metric NUPL would increase your trades probability in the market.
The following section will see everything a trader should know about the NUPL method, including an exact way to take a buy and sell trade.
What is the Net Unrealized Profit/Loss crypto trading strategy?
When investors buy a crypto coin, NUPL shows the total amount of profit/ loss of the following instrument. It shows the sentiment with a + or – sign where 0 is the neutral point, where no profit or loss happens.

NUPL calculation method
In this method, the following market condition may appear:
- NUPL is 0, where investors are in a neutral position, with no profit or no loss.
- NUPL is +1, where the market cap is higher than the realized cap. It indicates that the number of profitable investors is higher than the number of losers.
- NUPL is -1, where the realized cap is higher than the market cap, indicating that traders with a running loss in their account are higher in numbers than profitable traders.
For example, if the NUPL reaches the 0.75 value, it indicates a market condition where the market cap is 4X higher than the realized cap. In this situation, most of the coins are in profit, creating a gap between the realized and market cap.
How to trade using Net Unrealized Profit/Loss?
NUPL represents the following story about the market:
Increasing selling pressure
In this stage, more investors start to remain in profits, and the aim to close positions from taking profits indicates that bears may regain the momentum with selling pressure in the price. Moreover, it suggests the market condition where the market cap is higher than the realized cap, pushing investors to profit by selling through the market.
Let’s see the graphical view of the market scenario.
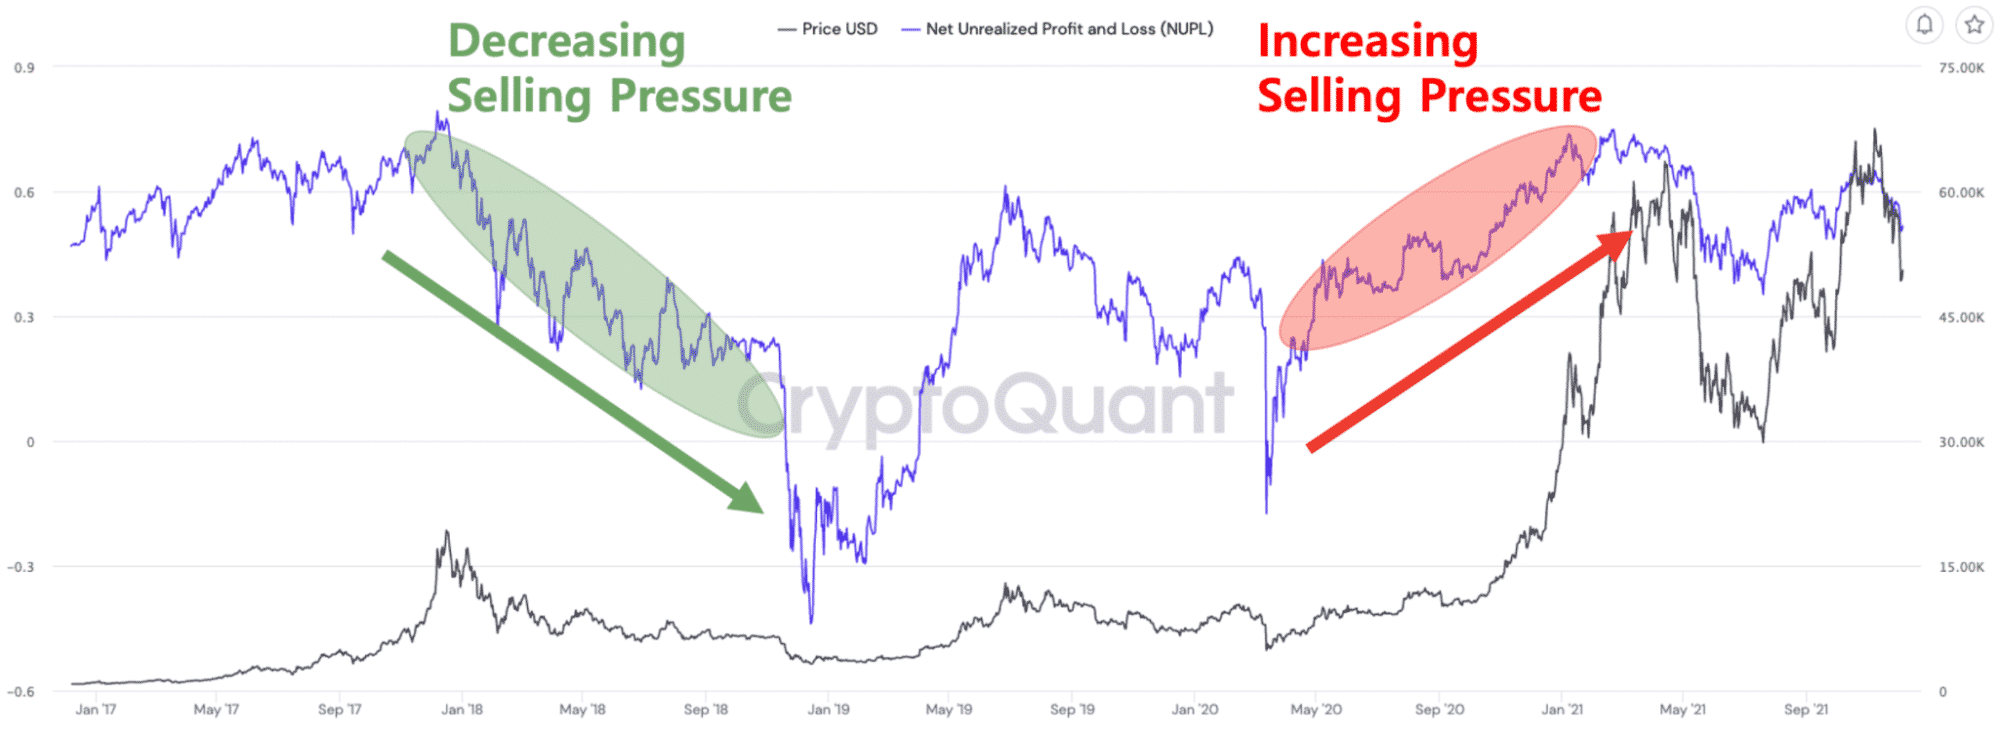
NUPL in Bitcoin price
Decreasing selling pressure
In this phase, traders start to make losses naturally, indicating a decreasing motive to realize loss with selling pressure in the price. Moreover, in this condition, the realized cap moves higher than the market cap by making investors make less money from the market by selling their assets.
A short-term trading strategy
In the short-term method, we will consider the market context using the NUPL and open trades up, confirming the entry from other technical tools. We will use the moving average and Relative Strength Index to find the buying or selling point, but you can choose other indicators as per your choice.
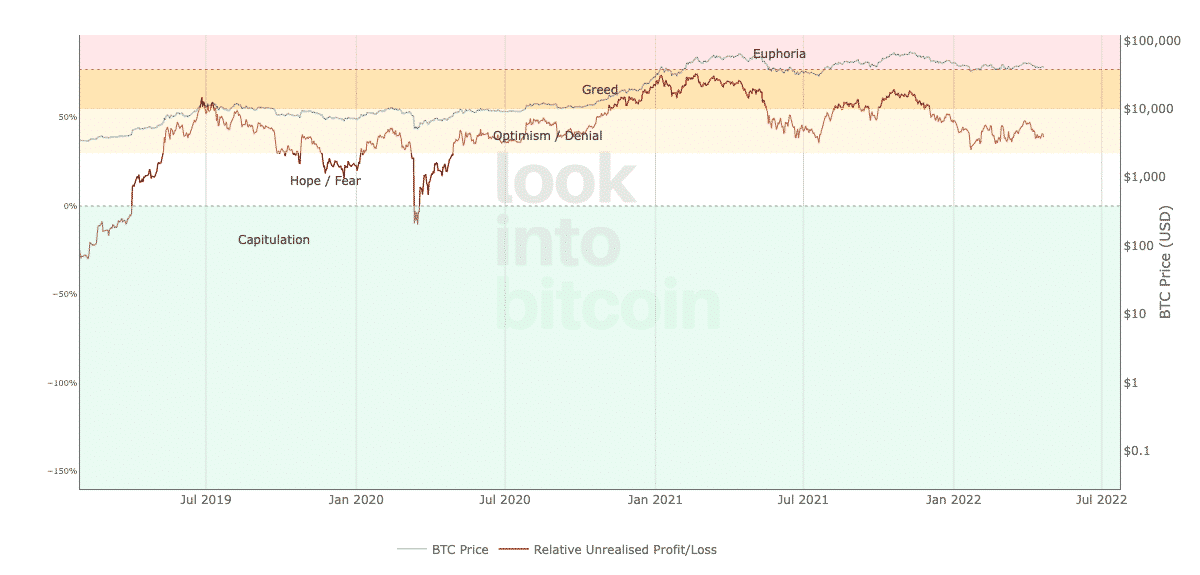
NUPL in Bitcoin price
The above image shows that the current BTC NUPL is at 39%, indicating that the overall investors are profit. Therefore, in the short-term bullish or bearish trade we will try finding buy trades to make more money.
Bullish trade scenario
In order to take a buy trade make sure to find the following conditions in the chart:
- Bitcoin NUPL is aiming higher above the 0 level but did not reach the overbought 75% level.
- Exponential moving average (EMA) 20 is above the Simple moving average (SMA) 50.
- Price corrected lower and formed a bullish rejection at the 20 EMA.
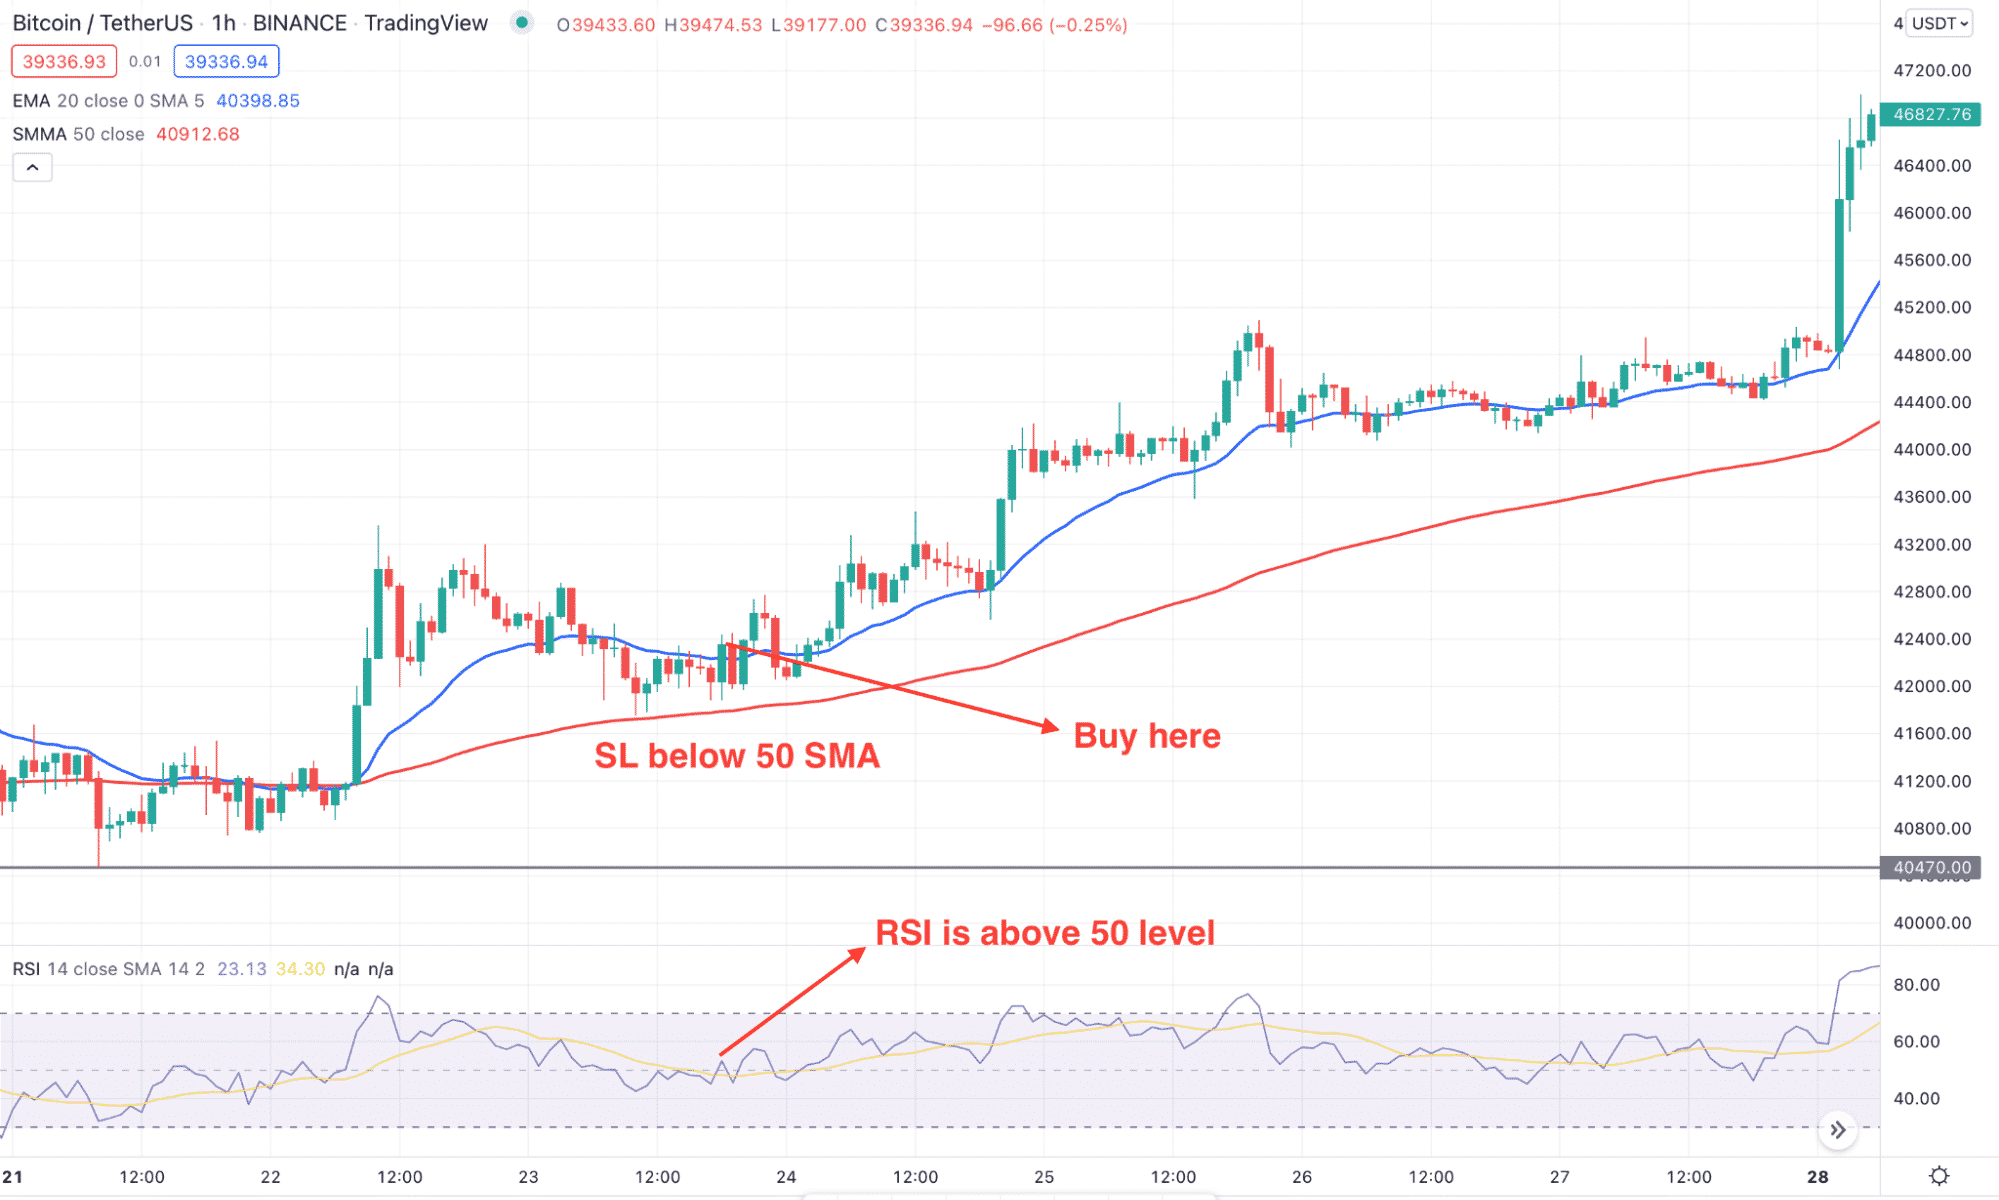
Short-term bullish trade example
Entry
The trading entry is valid once the price shows a bullish rejection candle in the H1 time frame. Open the buy trade to follow the higher timeframe direction after the candle closes.
Stop loss
Set stop loss below the 50 SMA with some buffer of 0.1% to 0.2% price gap.
Take profit
You can hold the trade until the NUPL reached the 75% level in the higher time frame. However, setting the stop loss at breakeven should be applied after getting a 1:5 RR profit.
Bearish trade scenario
It is the opposite version of the short-term bullish trade where the NUPL should be below the 0% level and aim lower.
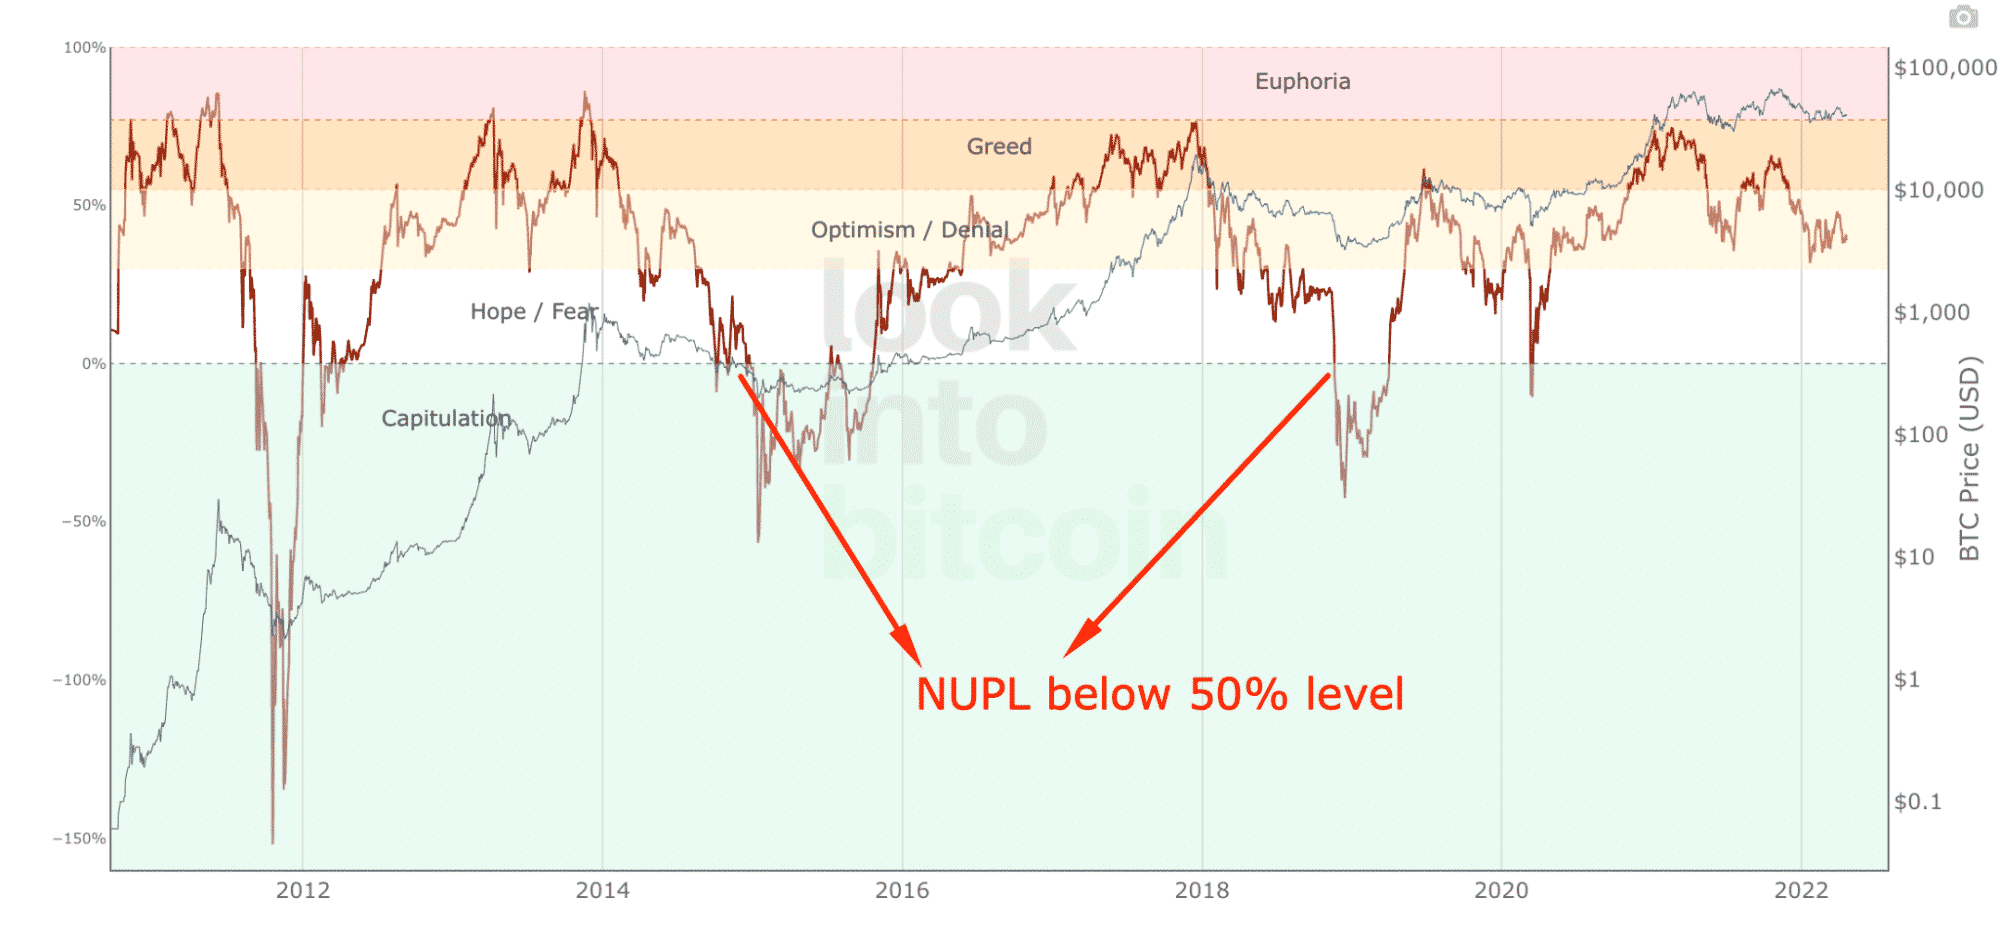
NUPL below the neutral level
The above image shows from where sellers should find their trade setups.
Entry
The sell trade is valid once the following conditions are present in the price chart:
- NUPL is below 0%
- 20 EMA is below the 50 SMA
- Price corrected higher but showed a bearish rejection from the 20 EMA with a bearish candle close.
Stop loss
Set stop loss above the 50 SMA with some buffer of 0.1% to 0.2% price gap.
Take profit
You can hold the trade until the NUPL reaches the -75% level in the higher time frame. However, setting the stop loss at breakeven should be applied after getting a 1:5 RR profit.
A long-term trading strategy
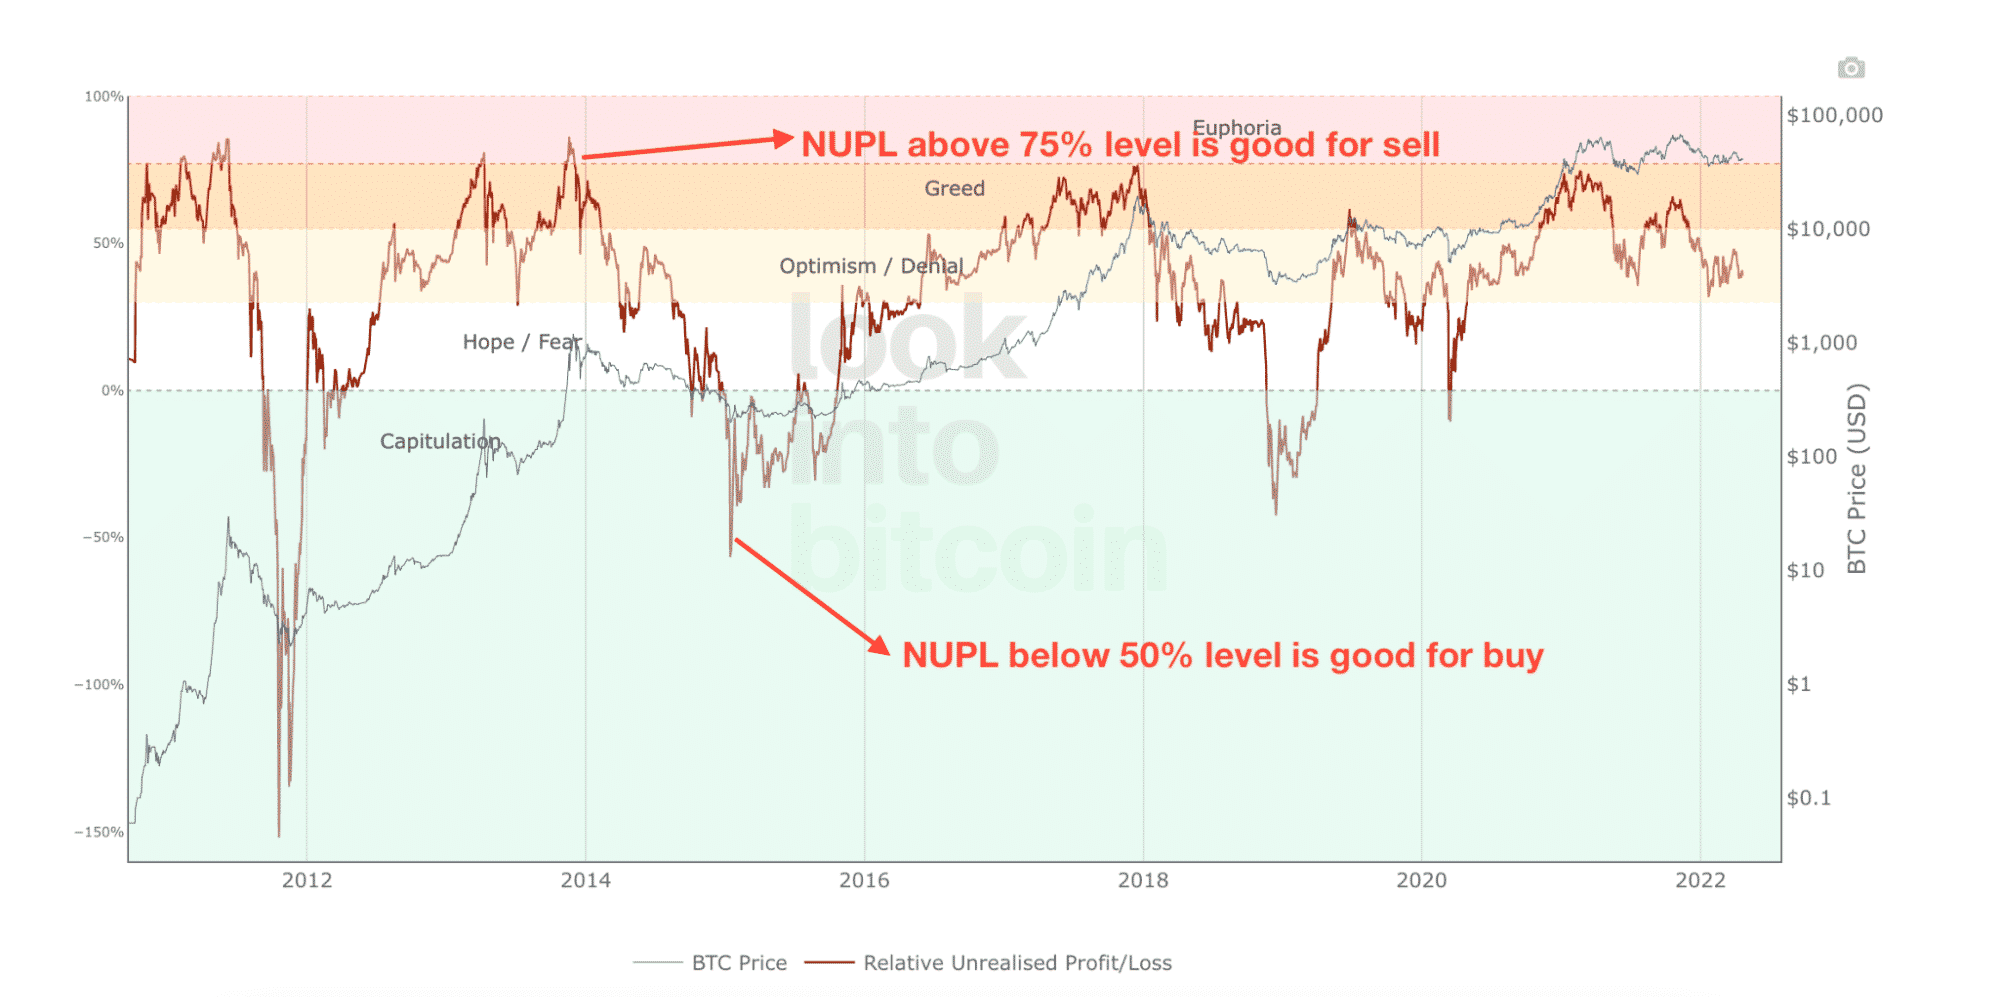
NUPL for long-term buy/sell
The long-term approach is perfect for finding the most accurate price levels to go long or short any crypto asset. In this method, investors should wait for the NUPL to reach the extreme level before opening the buy or sell trades.
Bullish trade scenario
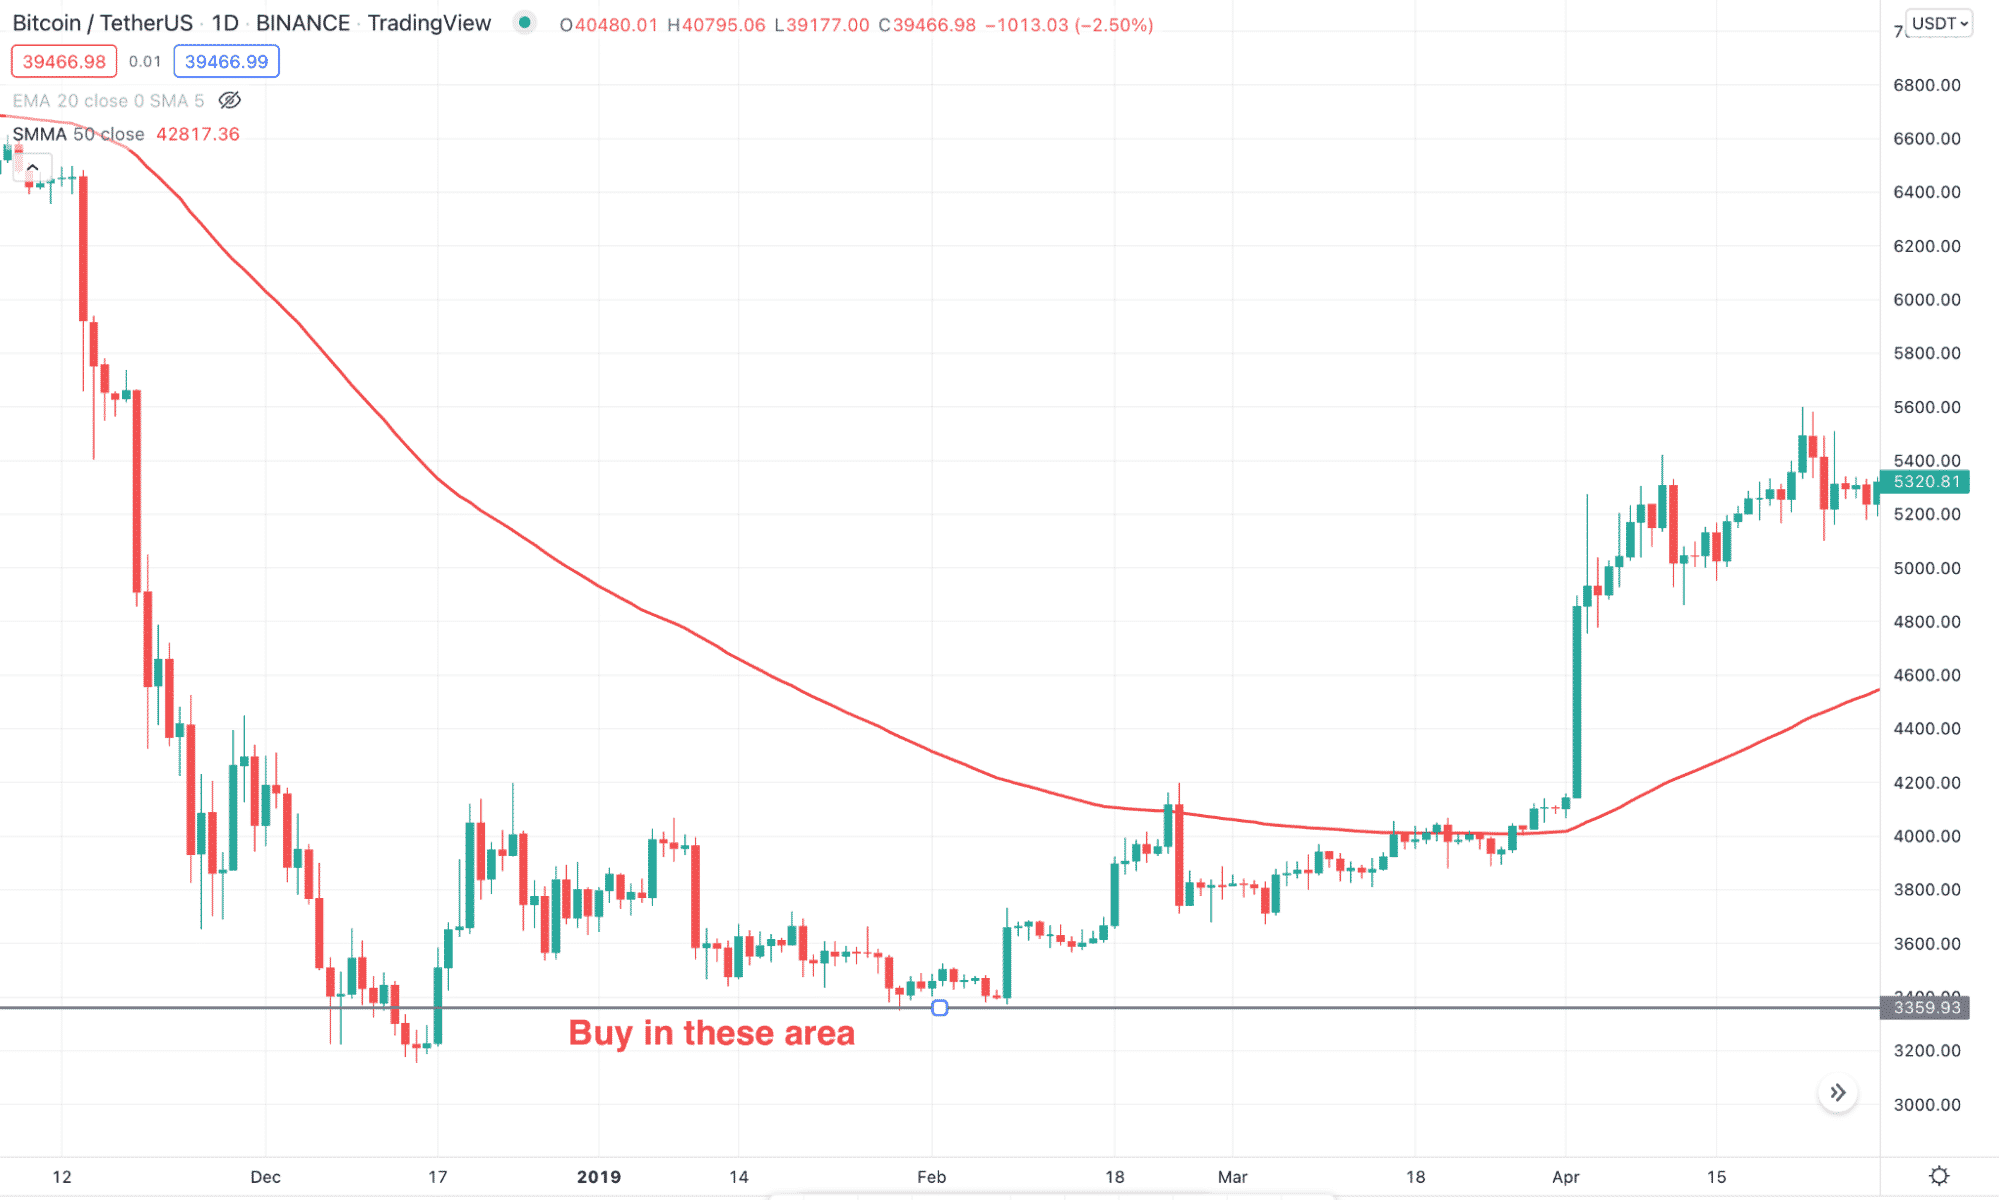
Long-term buy example
In the buy trade, the main aim is to find the NUPL at the -75% level from where an intense buying pressure may come.
Entry
Find the following condition in the daily chart before opening a buy trade:
- NUPL is at -75% level.
- The daily price reached an important support level where the gap between the price and the dynamic 50 EMA is expanded.
- Open the buy trade once the price forms a bullish rejection candle from the support level.
Stop loss
The stop loss should be below the support level or near-term swing low.
Take profit
As it is a long-term trade, you can HOLD for months to get higher returns. Moreover, you can add positions to boost your profit from the market.
Bearish trade scenario
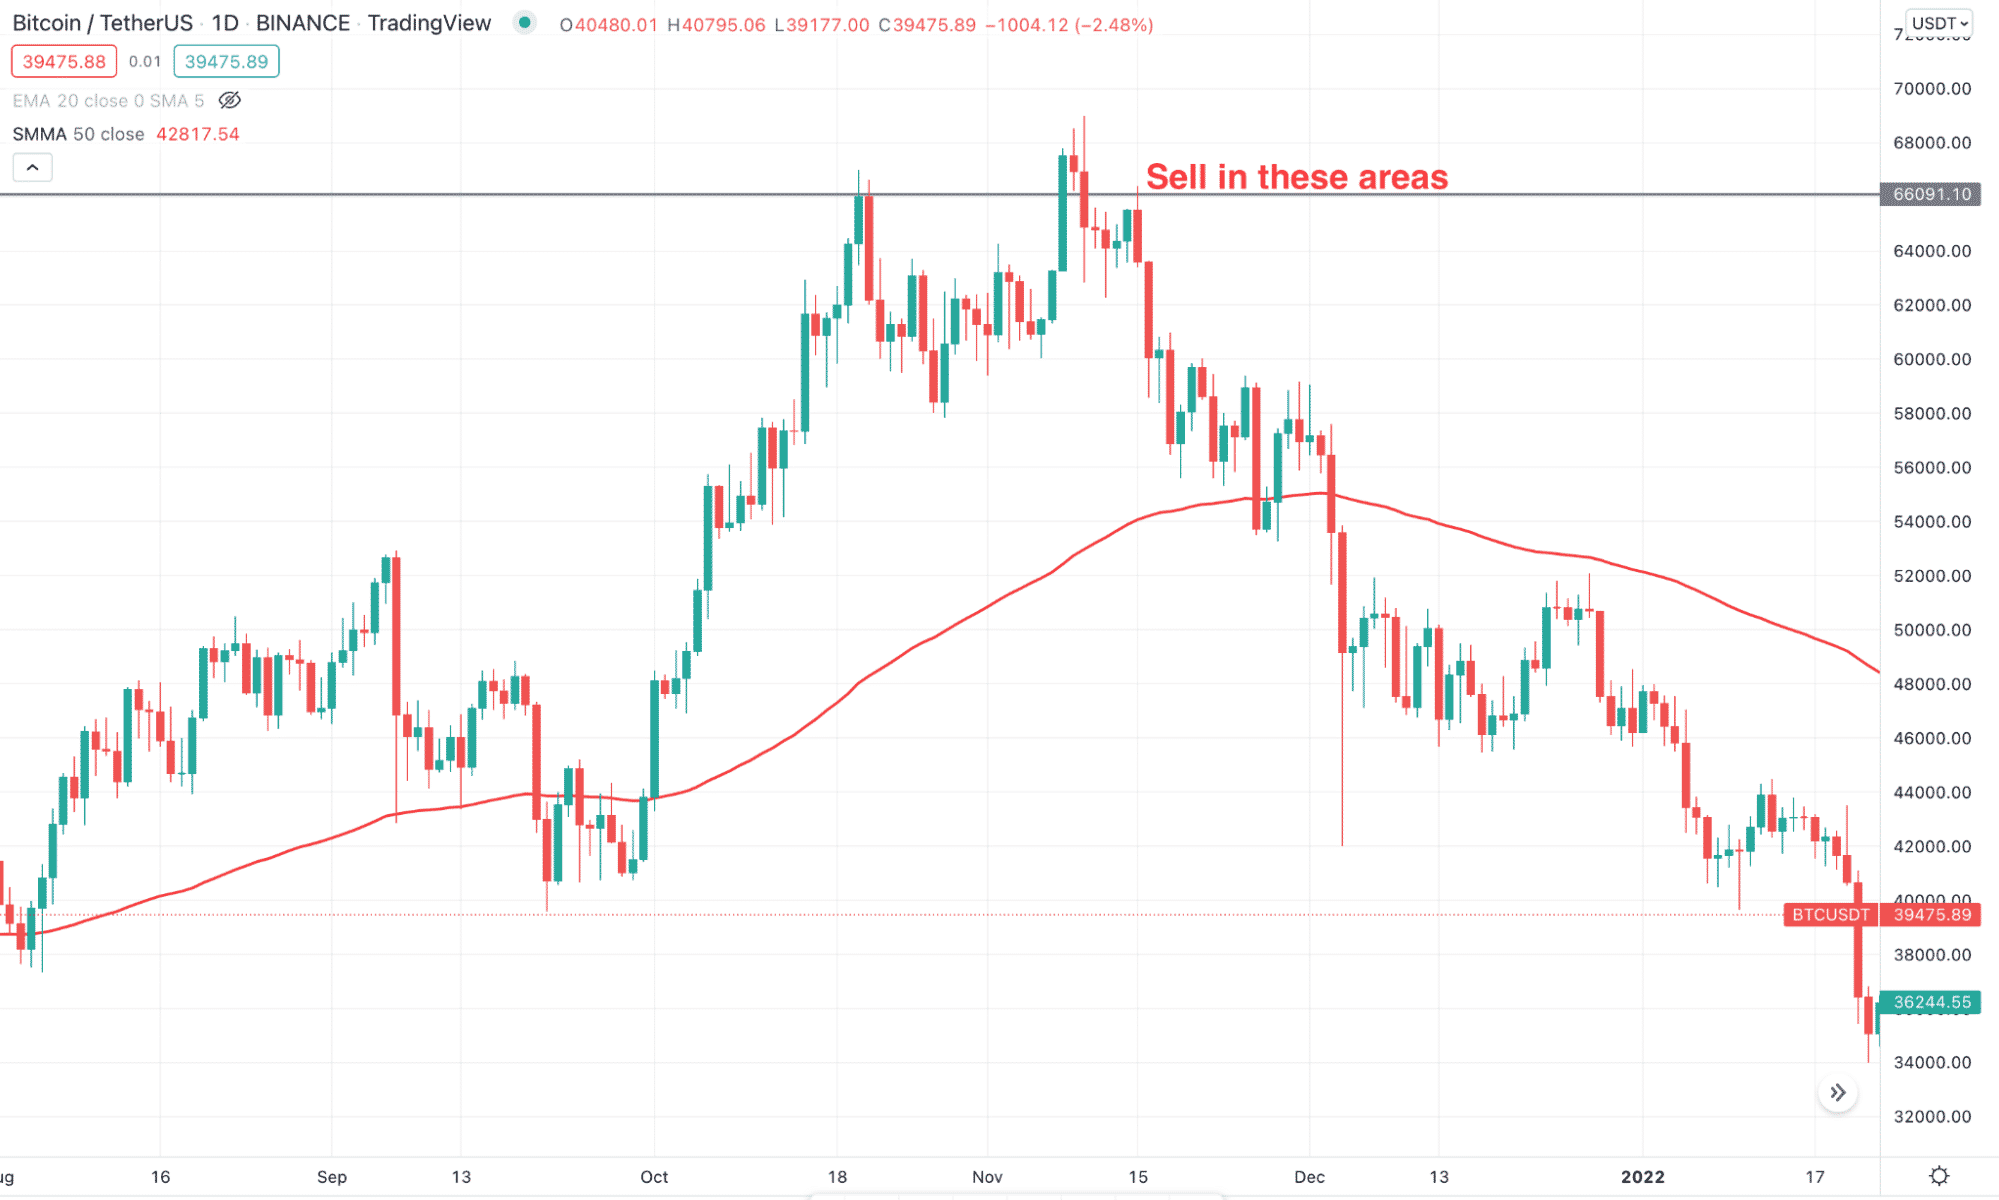
Long-term sell example
In the bearish trade, the NUPL should be at a +75% level from where sellers may join the market.
Entry
Find the following condition in the daily chart before opening a buy trade:
- NUPL is at a 75% level.
- The daily price reached an important resistance level where the gap between the price and the dynamic 50 EMA is expanded.
- Open the sell trade once the price forms a bearish rejection candle from the resistance level.
Stop loss
The stop loss should be above the resistance level or near-term swing high.
Take profit
As it is a long-term trade, you can HOLD for months to get higher returns. However, make sure to book some profit by partially closing trades.
Pros and cons
| 👍 Pros | 👎 Cons |
|
|
|
|
|
|
Final thoughts
In the above section, we have seen the complete trading guide using the NUPL indicator for the crypto market. In the last section, we can conclude the session by saying that the crypto market is the most volatile financial market globally, where indicators like NUPL could reduce traders’ stress by showing the most accurate price reversal points.


Comments