The availability of technology makes the financial market more accessible to individual traders, which enables many opportunities for retail market participants to make profits by following trading techniques. The Iceberg chart trading is a unique method that many professional market participants choose for its positive features.
However, this trading method is preferable when you have significant capital to invest. So any individual trader must understand the concept well besides mastering it when deciding to apply this system to trading.
Let’s reveal all primary info of the Iceberg trading method.
What is the Iceberg trading method?
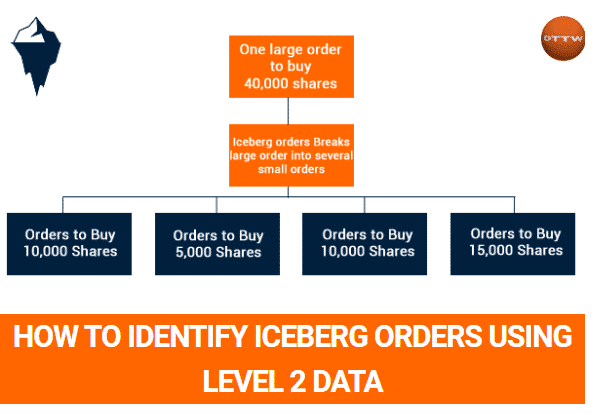
It is a billionaire approach in the financial market. In this method, traders usually split large orders into small ones. It is a suitable method for automatic trading with billions of dollars in investment. Understanding this concept is essential for individual traders. It enables opportunities to enter the market with major participants that increase profitability besides executing winning trades and reducing risks.
Additionally, by applying this method, you can make enormous profits with a few thousand dollars from many trading assets such as penny stocks. The “Iceberg” refers to the concept that a bit of portion is only visible while a large piece of the ice remains beyond the water.
This concept shares this concept as only a small volume of the whole trade is visible. At the same time, the investor hides the other significant order volume and executes by following order manner. This trading system reduces the telegraphing risks of the institutions by hiding volume that can affect the asset price.
How to use the Iceberg method in trading strategy?
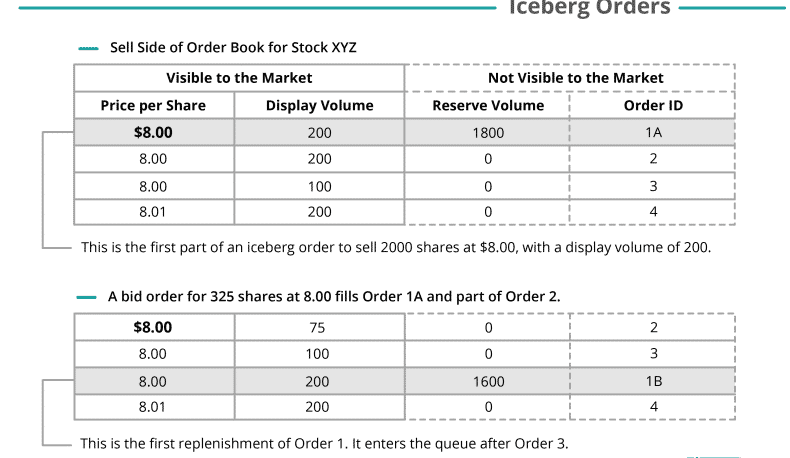
The concept generally follows routine once an order executes another pop-up from the queue, and this process continues till all orders execute.
Suppose you want to purchase a total of a thousand shares and execute an Iceberg order for 5$ while it displays a hundred shares. So after the first hundred shares bid hits, another hundred shares will pop up, and the process will continue till the whole thousand shares are purchased.
The identifying criteria of Iceberg orders are:
- When you see a repeated print in the trader’s column, observe as it can be an Iceberg order.
- It can be an Iceberg order if you spot orders executing at the same size at the bid/ask price.
- It can be an Iceberg order if you can mark trades executing with the same volume and reloads.
Spotting Iceberg order
Anyway, no individual trader can execute Iceberg orders at any financial assets such as currencies, commodities, etc. You can practice this method on small stocks or penny stocks with a few thousand dollars.
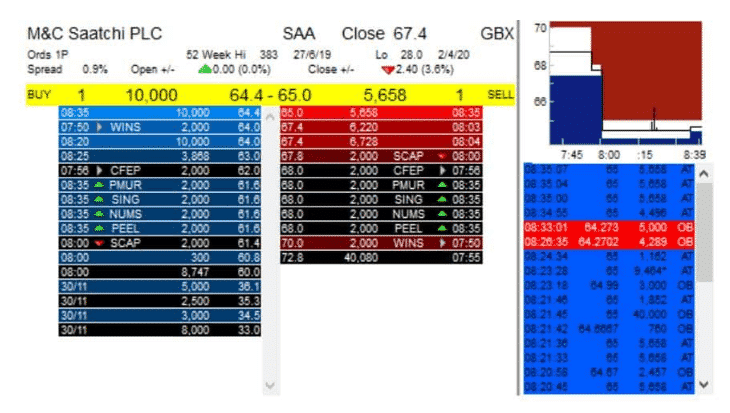
It is mandatory to understand the level 2 order book. Some brokers provide the level 2 order book containing bid/ask prices details. When you have 12-15 bid/ask prices, you know any particular asset’s highest bid and lowest price offering for a certain period.
A short-term trading strategy
The primary purpose of the Iceberg method is to hide the actual volume of the order from other participants. The hedge funds also don’t enter the market at a single price. It is a standard practice among financial traders to enter the market by following level 2 data on any trading instrument. In this way, traders determine the bid/ask prices and incorporate that information to open positions.
Many traders also use some chart analysis alongside the level 2 data. For example, you may split your total order size into many small orders, then check on level 2 data if several points repeat or not, and execute trades according to your estimate.
Iceberg order through level 2 data
Bullish trade scenario
Estimate your order size according to your capital. Check on the level 2 info, confirm that the buy volume is increasing, and match any Iceberg order identifying criteria.
Entry
Enter buy orders according to your estimate.
Stop loss
Place reasonable stop loss for your buy orders by following market context.
Take profit
Continue the buy orders till the bullish momentum lasts. Close all buy trades when the price starts to decline.
Bearish trade scenario
Estimate order size, check the level 2 data to confirm the sell volume is increasing, and match the Iceberg order identifying criteria.
Entry
Enter sell trades according to your estimate.
Stop loss
Place reasonable stop loss for your sell orders by following market context.
Take profit
Continue your sell orders till the bearish momentum remains intact. Close all short positions when the price starts to bounce upside.
A long-term trading strategy
Many exchange platforms provide mechanisms to determine the Iceberg orders, such as “max flow.” The max flow spots the significant order slices to show in a specific time. Using this method, many firms can execute “synthetic” order types, and brokers divide the order into many small portions and execute all of them. It is a standard method that applies to platforms like the CME group.
Iceberg order example
Bullish trade scenario
Check the max flow parameter and identify bullish pressure on the asset price. Execute buy trades using the synthetic method. While opening buy positions defines the stop loss and profit target levels.
Bearish trade scenario
Open sell positions using the synthetic method when the max flow parameter suggests an upcoming declining pressure on the asset price. Place reasonable stop loss and profit target levels while placing sell orders.
Pros and cons
| 👍 Pros | 👎 Cons |
|
|
|
|
|
|
Final thought
Finally, significant financial institutions and hedge funds with large capitals frequently choose this method for its features of hiding the actual volume. Meanwhile, any retail trader who can spot Iceberg orders can execute more potential trades.


Comments