
Though a trading method is not everything in currency trading, having one means you are serious about this business venture. A trading method allows you to navigate the dangerous waters in trading. Even if you fail at first, you can sit down on your drawing board and examine where you did wrong. Your goal is to develop a trading system gradually that will give you an edge in the market.
Dean Malone developed the EASY trading method and published it in 2007. According to him, the edge of his system originates from:
- High win rate
- Opening and closing trades mechanically
- Generating trading decisions based on chart action, not on speculation
What is the EASY method?
The term EASY in this trading method is an acronym whose letters mean:
- E (effective) – means having an effective edge for trading
- A (accurate) – means this system provides accurate trade signals
- S (simple) – means this system offers a simple and clear call
- Y (yield) – means you can have more winning trades than losing trades if you use this system in your trading
If you think about it, this system gives the impression that trading is easy. Many traders think differently. For them, trading is simple, not easy. However, as you become comfortable trading this system and you execute trades mechanically, you might realize that you can make trading easy.
Chart setup
To trade the EASY method, you have to set up your chart as prescribed by this system. Your chart should contain the following elements:
- Heiken Ashi candles
- EMA channel
- Traders dynamic index
Why use a Heiken Ashi chart?
There are many benefits of using a Heiken Ashi chart. Some traders claim this chart is better than the candlestick chart. In the end, it all boils down to your specific trading system. It appears the EASY method works well when paired with Heiken Ashi charting.
Here are some benefits of the Heiken Ashi chart:
- Accurate description of the current market environment
- Clear depiction of consolidation and trending market
- Removal of noise and better portrayal of market movement
EMA channel
The traditional way of presenting a price channel is through the use of trend lines:
- One above price
- Another below price
Another conventional approach is using an envelope, band, or channel with upper and lower boundaries, such as Bollinger Bands, Donchian channel, Keltner channel, etc. If price breaks the upper or lower end of an envelope, traders consider this as an entry signal. Malone thinks of this style as reactive trading.
To transition into proactive trading, Malone uses an EMA channel. To create this channel, you need to drop two exponential moving averages to your chart, both with a period of 8. Apply one EMA to high price and the other to low price. When you do this, your chart should look like this.
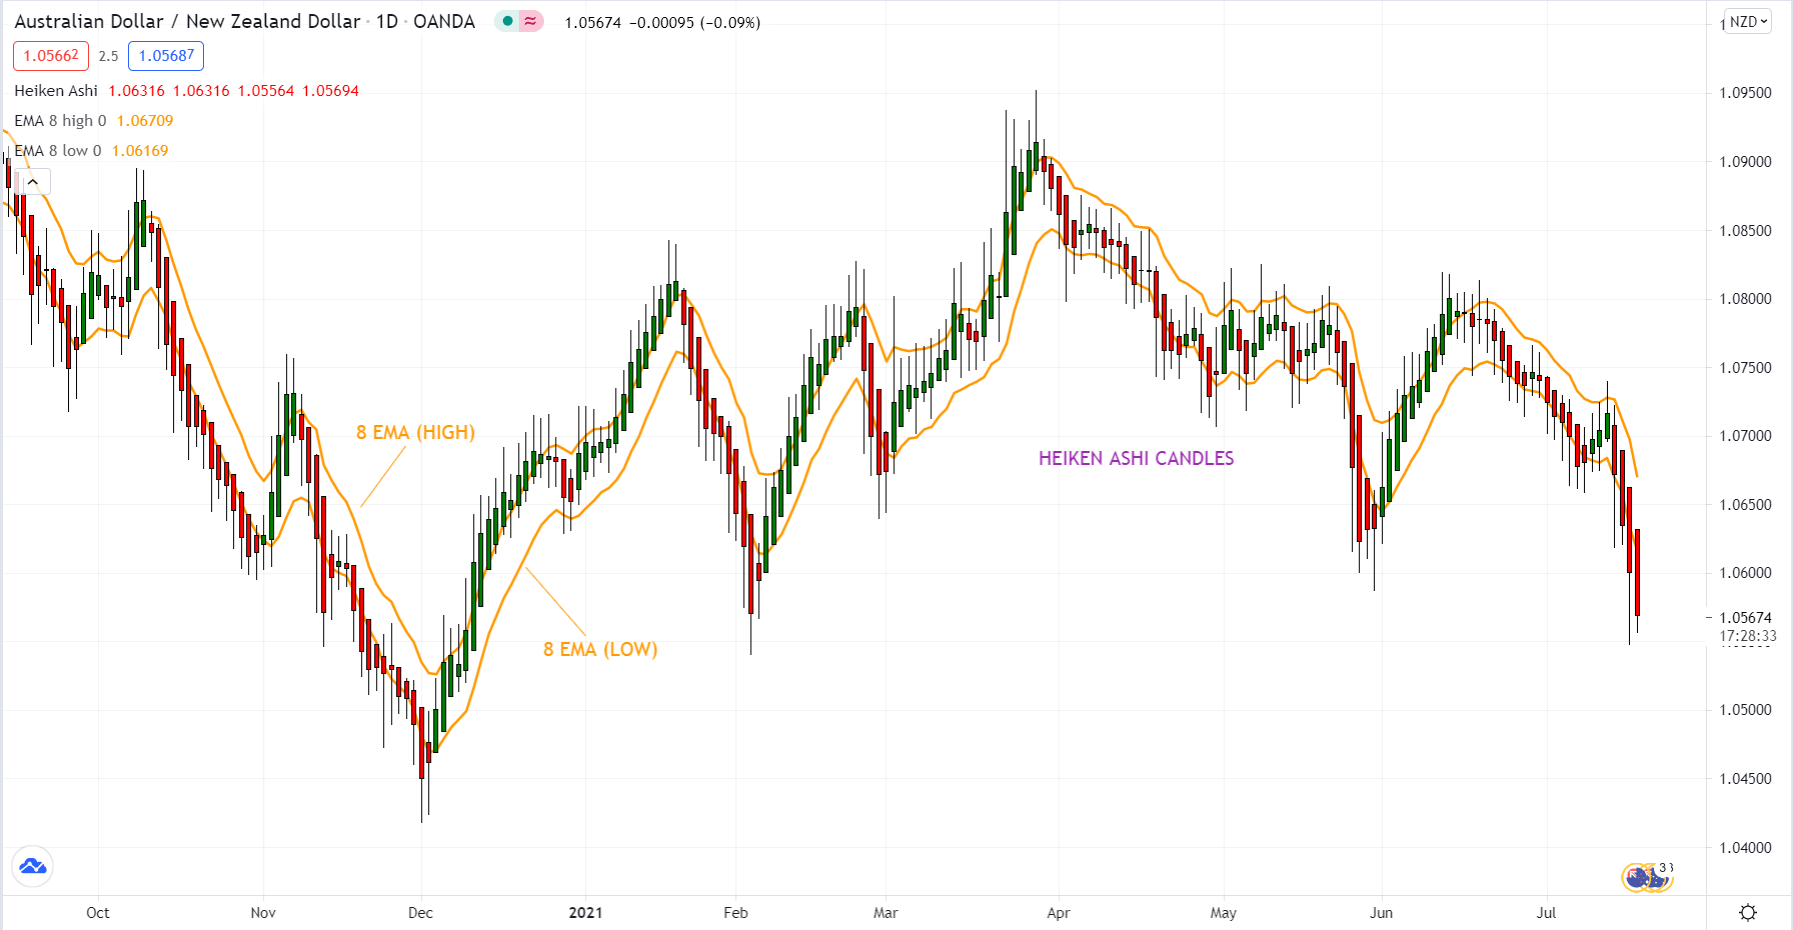
The advantage of using an EMA channel is varied, namely:
- An EMA channel presents the trend. For a bullish market, price tends to ride above the channel. For a bearish market, price tends to run below the channel.
- An EMA channel can reveal consolidation periods. In a range-bound market, the channel is flat.
- You can use the channel as a trigger for entry, that is, anytime the price breaks up or down.
Traders dynamic index
Developed by Dean Malone, the trader’s dynamic index (TDI) is a hybrid indicator that you can use to determine all of the following market properties:
- Trend direction
- Momentum
- Volatility
Containing several parts, the TDI is an all-in-one indicator.
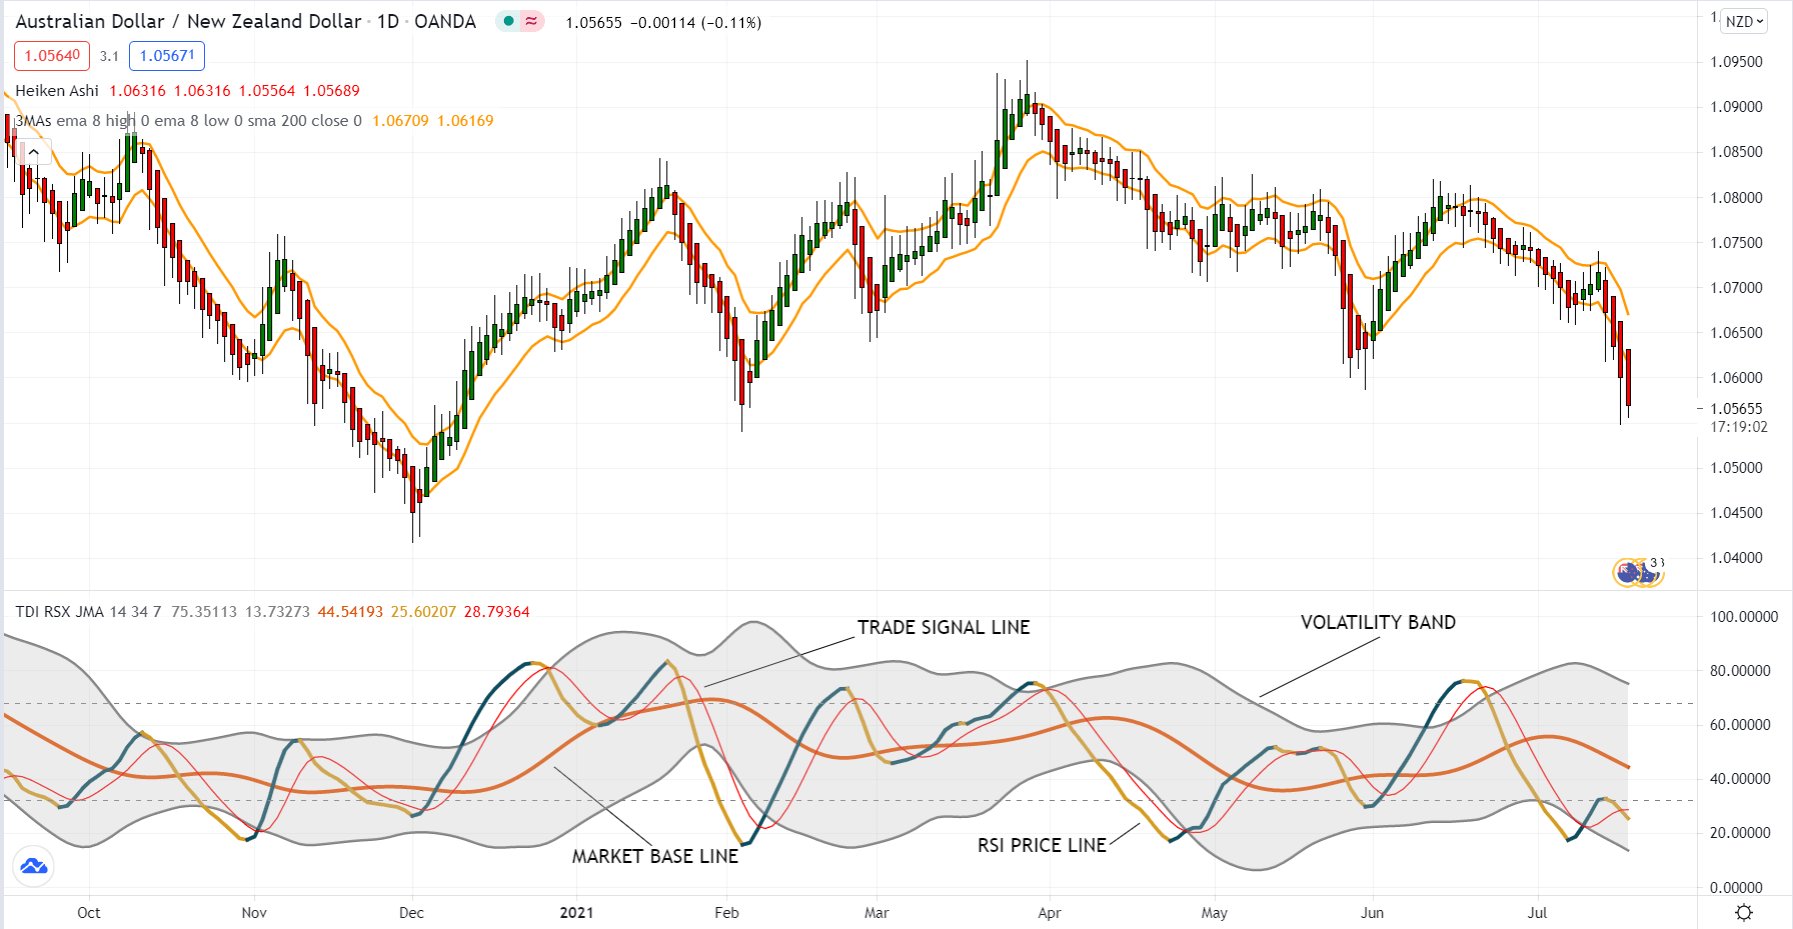
The TDI components are the following:
- RSI price line (RPL) – period 2, close, SMA
- Trade signal line (TSL) – period 7, close, SMA
- Market baseline (MBL)
- Volatility band (VB) – period 34, close
The chart below displays the TDI indicator and its components in a sub-window.
TDI trade signals
Each of the four components of TDI can give signals individually, as you will see below.
RPL signal
- Buy – RPL crossed above 50
- Sell – RPL crossed below 50
- Exit – when RPL is greater than 68 (overbought) or less than 32 (oversold)
RPL resembles price action. The difference is that RPL has a balanced line (50 levels) while price does not. Price action and RPL have convergence and divergence relationships.
TSL signal
- Buy – RPL crossed above TSL
- Sell – RPL crossed below TSL
- Exit – when an opposite crossover occurs
MBL signal
- Buy – RPL crossed above MBL
- Sell – RPL crossed below MBL
While MBL defines the overall trend, it can also identify market reversals. You can consider a market overbought when MBL goes above 68 and oversold when MBL goes down 32.
VB signal
During market consolidation and price is ranging, the volatility band squeezes. When this happens, you can take any of the following trades:
- Buy – RPL crossed above VB
- Sell – RPL crossed below VB
EASY method buy entry rules
Let us use a buy trade to illustrate how to take a long position. Apply the same rules for sell entry, but on the flip side.
- The EMA channel is moving up
- The previous Heiken Ashi candle is bullish and closes above the EMA channel
- RPL is greater than TSL and MBL and is above 50

The above AUD/NZD daily chart shows a sample buy trade based on the entry rules. This entry occurred on 10 December 2020. Marked by a vertical line, this entry point satisfies all requirements for a buy entry. As you can see, a buy trade taken could have resulted in profit.
Protective stop and trailing stop
For a long trade, your stop loss should go to the bottom of the EMA channel at the time of entry. For a sell trade, the stop loss should go to the top of the EMA channel. When the trade is profitable, you may use trailing stops to maximize profits.
One option you can do is to use the opposite channel as the dynamic stop loss level. Another option is to use:
- High for a sell
- Low for a buy of the day as the moving stop loss
EASY method buy exit rules
In the same way, as for entry rules, let us consider how to exit a buy trade to grasp the concept more easily. For a sell trade, do the exact opposite.
You can exit any long trade taken using the EASY method in one of the following three ways:
- Heiken Ashi exits – when a red candle appears
- EMA channel exit – when a candle closes below the channel (if the candle closes within the channel, the trend is still in place, so keep the trade open)
- TDI exit – when RPL and TSL have a bearish crossover within the overbought territory
As you can see, a potential setup must satisfy many requirements before it becomes a legit trade. On the other hand, you can close any trade in three ways. Therefore, the EASY method attempts to find high-probability trade entries and does not try to hold trades for too long. When the setup shows any sign of trouble, you must close the trade immediately.
Final thoughts
The EASY system might look difficult the first time you learn about it. You might think it is not very easy, as presented in this article. However, as you become familiar with it, you will realize that the system is easy to implement. To become profitable with it, you need to be patient in executing trades as defined by the system.


Comments