
Candlesticks are the most convenient charting in the financial market, including digital assets like cryptocurrencies. It is common among expert crypto traders to run into candlestick patterns or particular types of price graphs while researching crypto price movements and seeking potentially profitable trading positions.
However, complex chart patterns can be overwhelming to novice traders. So it is mandatory to have a basic understanding of recognizing, reading, and using procedures of these patterns that can help crypto traders to get insights about price action alongside determining future price movements and planning successful trade executions.
This article will introduce you to crypto candle charts, how to read them, and the best trading strategies using those chart patterns.
What is a crypto candle chart?
When you are seeking to learn how to read crypto candle charts, you first need to know what a price candle is. Price candles represent the price evaluation of any trading instrument or participant’s activities within a particular period. Candlestick carts often offer far more information than standard bar charts or line charts. At the same time, all charts show price data on the vertical axis and time data on the horizontal axis.
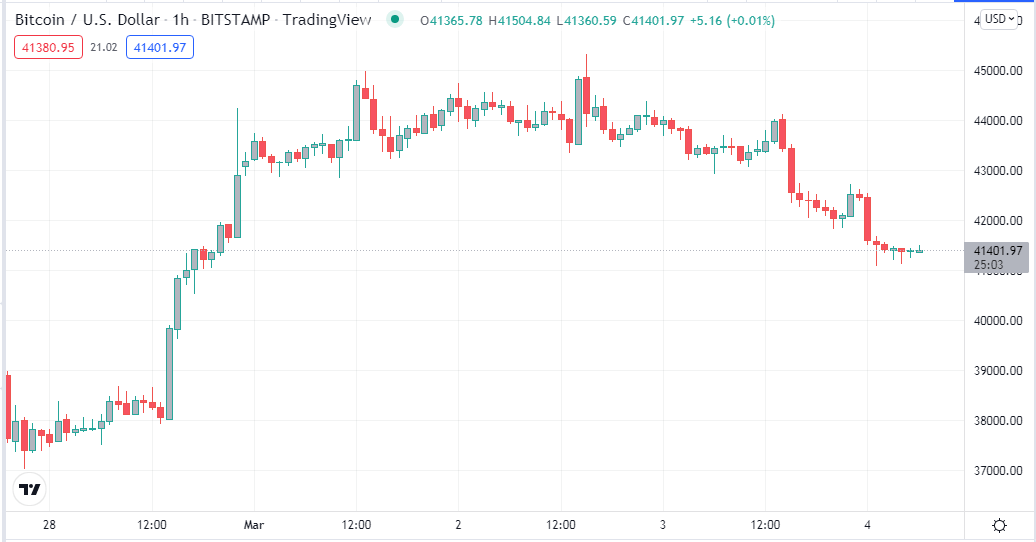
BTC/USD candlestick chart
Candlestick charts are made of literal candles, and each candle represents trading periods that can be from one minute to one month. You can change the time durations of price charts according to your desires.
How to read candlestick charts
Every candle usually has two colors, green or red (in some cases white and black). Green candles are traditionally bullish ones with closing prices higher than the opening price, which declares the price is increasing. On the other hand, red candles represent declining pressure on the asset price and closing price below the opening price.
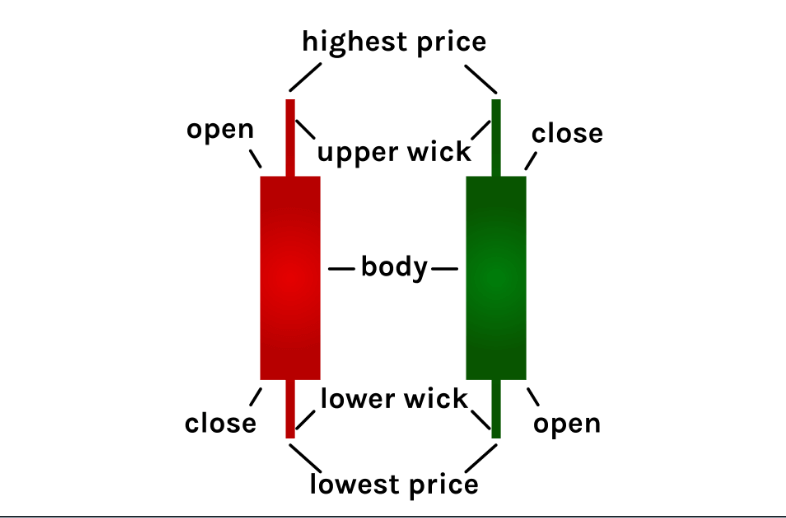
Elements of a candle
A tiny candle body with no color and wicks represents indecisions within that specific period.
The essential elements of the candlestick are:
- Body: it usually declares the open-close range of any particular period.
- Wick: represents the highest and the lowest price during that specific period. If there is no wick, the opening or closing price is the highest/lowest price.
- Highest price: the upper edge of the upper wick represents the highest price during that candle period.
- Lowest price: the lower edge of the lower wick represents the lowest price.
- Opening price: the first-traded price during the candle formation.
- Closing price: the last-traded price of a candle. When it is above the opening price, the candle body will be green, and if it occurs below the opening price, there is a red body.
Short-term trading strategy
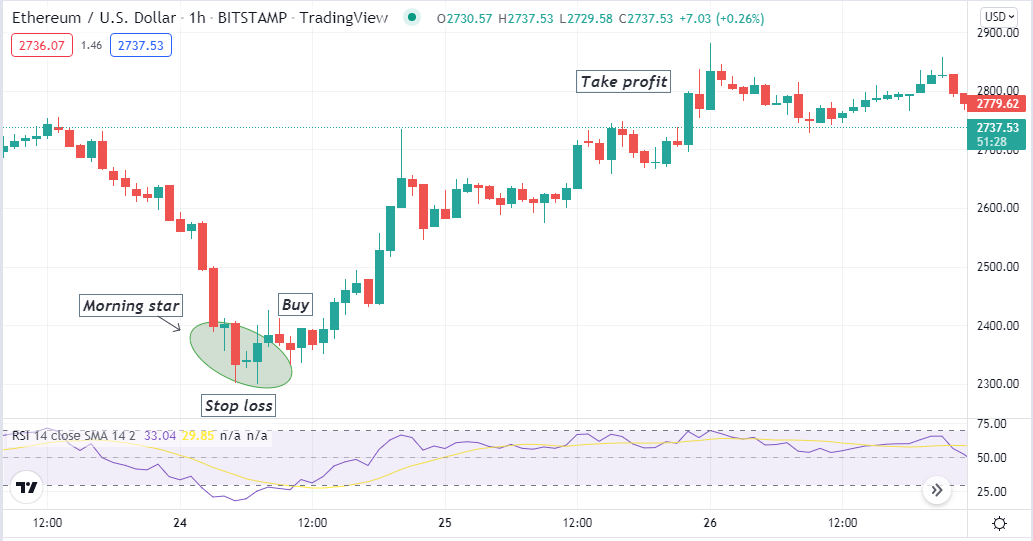
In this short-term trading method, we use multi candle formations like Morning Star and Evening Star alongside a popular technical indicator, the RSI. We identify trading positions through candle formations, and the indicator confirms the trade idea. It is a suitable trading method for any trading instrument, including cryptocurrency; we recommend using a 15-min or hourly chart to determine short-term trading positions.
Bullish trade scenario
First, spot the Morning Star formation near any support level when seeking buy trades.
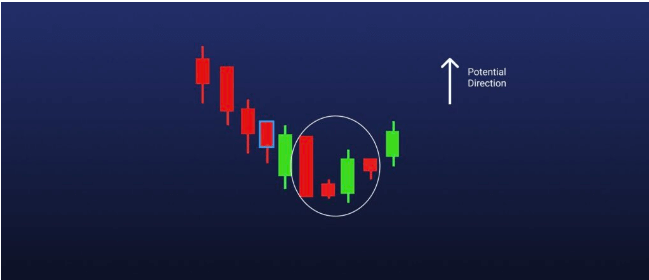
Morning Star
This pattern contains three candles. Then observe the RSI indicator window.
- The Morning Star pattern completes formation.
- The RSI dynamic line remains near the central (50) line and heading toward the upper (70) level.
Bullish setup
Entry
These conditions above match your target asset chart, declaring potential bullish momentum. Place a buy trade.
Stop loss
Place an initial stop loss below the bullish momentum with a buffer of 5-10pips.
Take profit
Close the buy position when the RSI dynamic line reaches the upper (70) level or declines after getting that level.
Bearish trade scenario
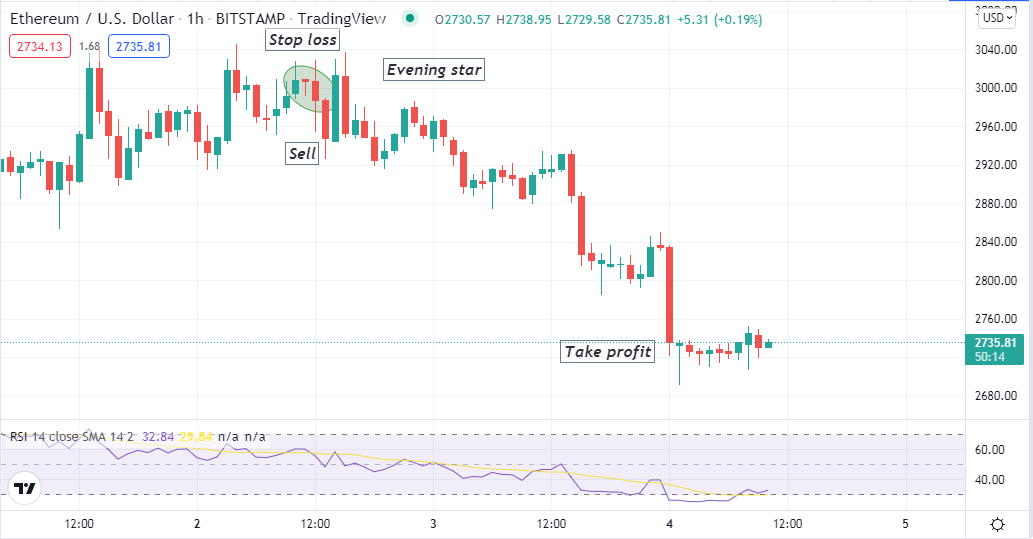
First, spot the Evening Star formation near any resistance level when seeking sell trades.
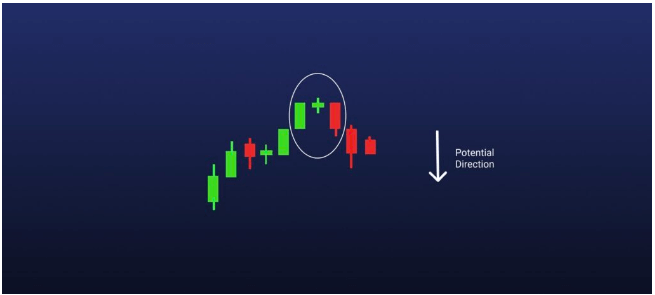
Evening Star
This pattern contains three candles. Then observe the RSI indicator window.
- The Evening Star pattern completes formation.
- The RSI dynamic line remains near the central (50) line and heading toward the lower (30) level.
Bearish setup
Entry
These conditions above match your target asset chart, declaring potential bearish momentum. Place a sell trade.
Stop loss
Place an initial stop loss above the bearish momentum with a buffer of 5-10pips.
Take profit
Close the sell position when the RSI dynamic line reaches the lower (30) level or surge upside after getting that level.
A long-term trading strategy
We combine the two most popular trading chart patterns in this long-term trading method, the Three White Soldiers and Three Black Crows, alongside the volume and the Stochastic oscillator indicator to determine trading positions. Both are multi-candle patterns containing three candles. This strategy suits any trading chart of crypto assets; we recommend using an H4 or D1 chart to obtain the best results.
Bullish trade scenario
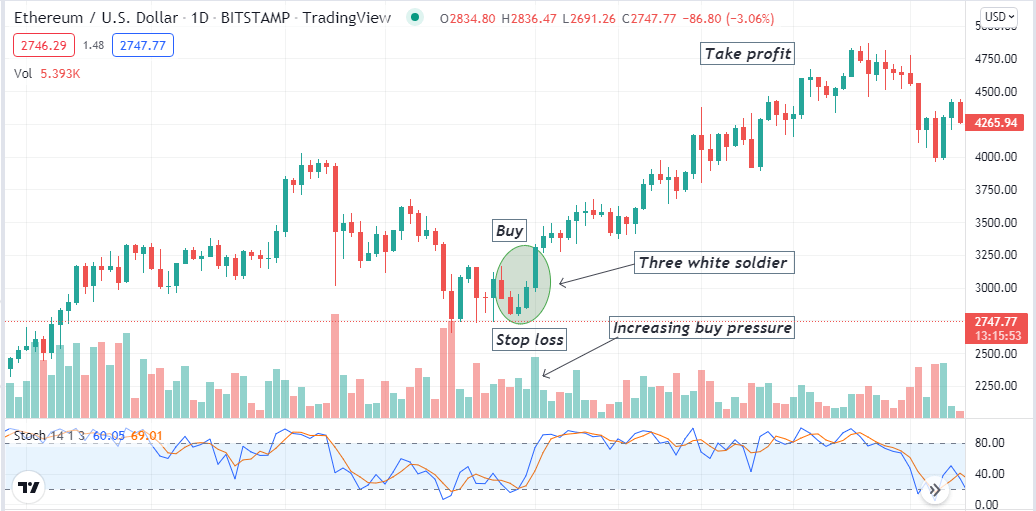
When seeking to open buy positions, spot three white soldiers near the finish line of a downtrend.
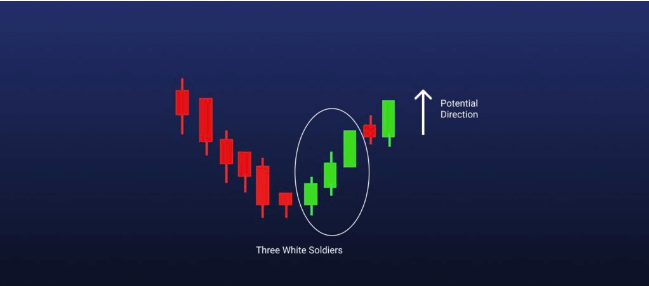
Three White Soldiers
Now observe indicators readings:
- The volume indicator declares increasing buy pressure.
- The dynamic blue line crosses the dynamic red line on the upside at the Stochastic oscillator indicator window.
Bullish setup
Entry
When these conditions above match your target asset chart, declare sufficient buy pressure. Open a buy position.
Stop loss
The initial stop loss will be below the recent swing low.
Take profit
Close the buy position when:
- The volume indicator declares selling pressure on the asset price.
- Both dynamic lines of the stochastic oscillator window reach the upper (80) level.
- The dynamic blue line crosses the dynamic red line on the downside.
- Both dynamic lines start declining after getting the upper (80) level.
Bearish trade scenario
When seeking to open sell positions, spot three black crows near the finish line of an uptrend.
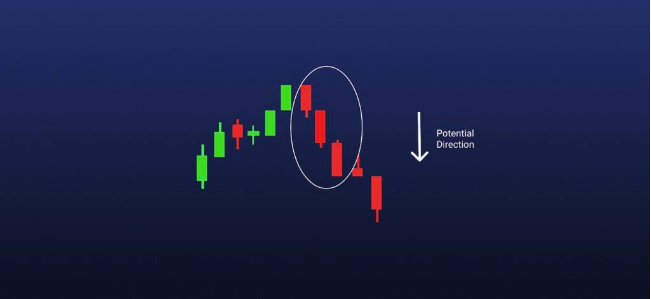
Three Black Crows
Now observe indicators readings:
- The volume indicator declares increasing sell pressure.
- The dynamic blue line crosses the dynamic red line on the downside at the Stochastic oscillator indicator window.
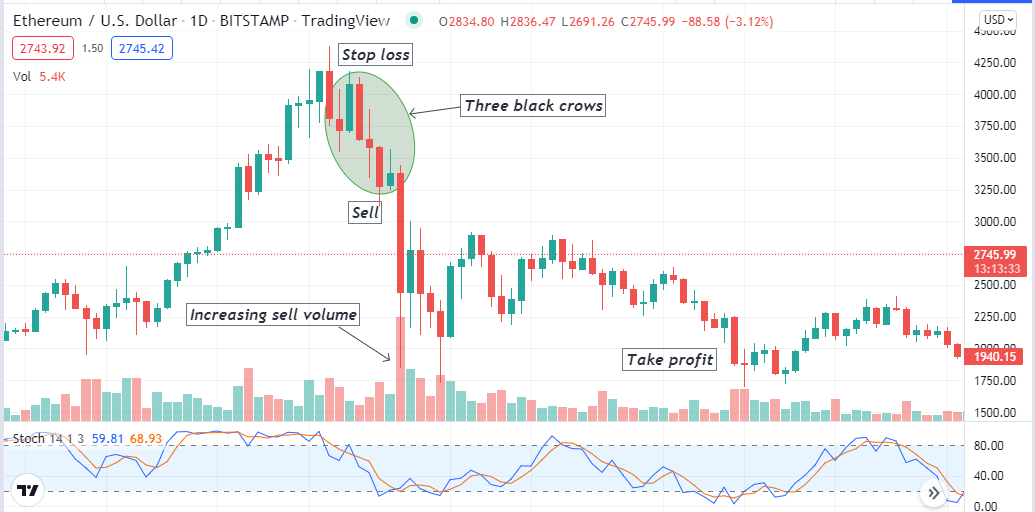
Bearish setup
Entry
When these conditions above match your target asset chart, declare sufficient sell pressure. Open a sell position.
Stop loss
The initial stop loss will be above the recent swing high.
Take profit
Close the sell position when:
- The volume indicator declares buying pressure on the asset price.
- Both dynamic lines of the stochastic oscillator window reach the lower (20) level.
- The dynamic blue line crosses the dynamic red line on the upside.
- Both dynamic lines start surging upside after getting the lower (20) level.
Pros and cons
| 👍 Pros | 👎 Cons |
| These chart patterns allow making frequent trades on many trading assets. | These chart patterns don’t suggest complete trade setups. |
| The winning percentage is attractive when trading using these crypto candle patterns. | It requires using trading indicators while trading using these patterns. |
| These chart patterns allow making both short-term and long-term trading positions. | These patterns can fail due to fundamental reasons. |
Final thought
Candlestick patterns contain many valuable data of price movements. Expert traders often practice nacked chart trading using chart patterns or candle formations. Using effective technical indicators alongside chart patterns is common among crypto experts to generate profitable trade ideas.


Comments