
It is a typical practice among financial traders to seek trading positions by looking at candle formations. Many successful traders rely on candlestick trading patterns while making trade decisions to determine any trade’s best entry/exit positions. Some must-know trading patterns are available in the financial market, including the crypto marketplace, as they continually generate the same trading signals.
However, learning the functionalities and the professional’s way of using them is mandatory before starting trading using any pattern. This article lists the best five trading figures to help you catch buy trades in the deep or bullish reversal patterns.
What is a trading pattern?
Before knowing trading figures, it is mandatory to know the candles first. A candlestick is a method of displaying any asset’s price movement information. Candles usually have three essential features: body, wicks, and color:
- Body
It represents the opening to the closing price range of a specific period.
- Wicks
Wicks can be both sides of the body representing the extreme high and low of that candle formation period.
- The color
The color of any candle reveals the direction of the price movement. A candle with a white or green color defines buyers’ domination or increasing price, and a red or black candle represents declining pressure or sellers’ domination on the asset price.
Many candle formations determine the support resistance levels of price movements.
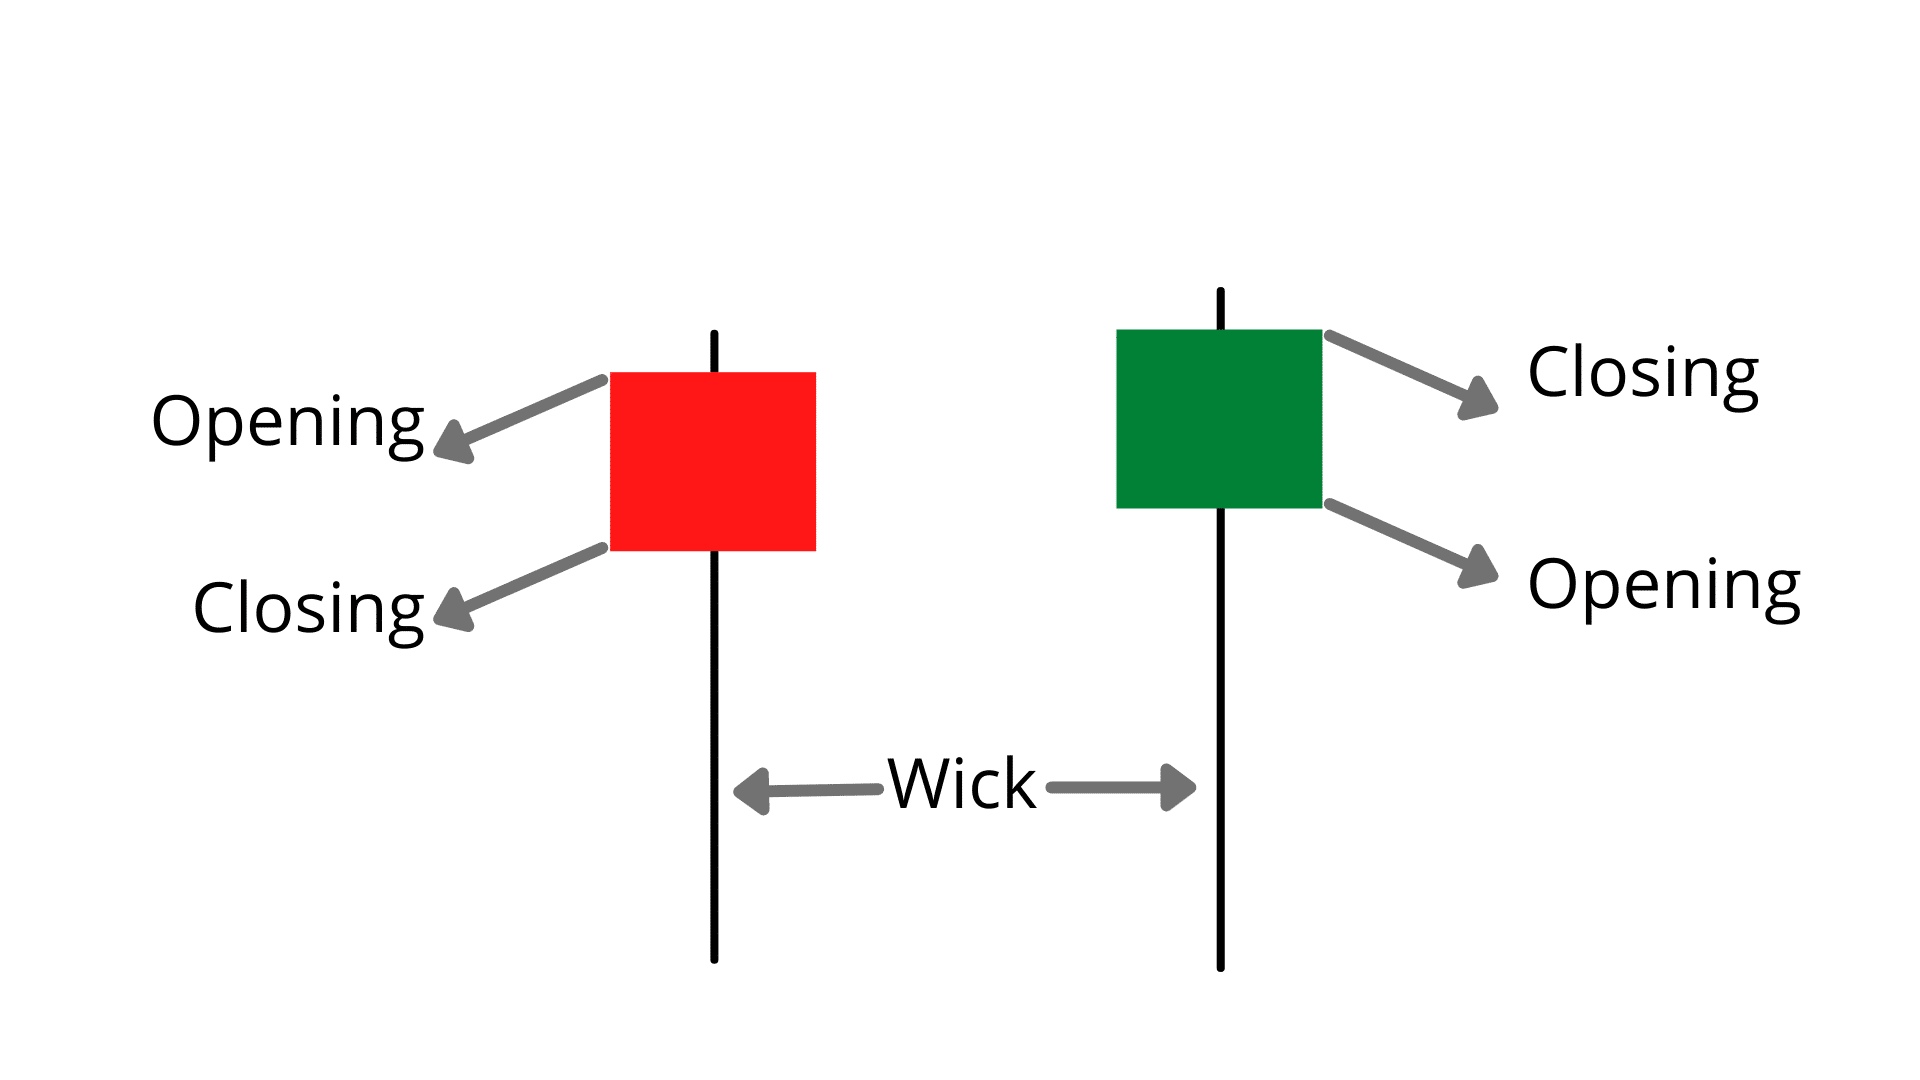
Candlestick elements
Types of trading chart pattern
There are many trading figures available that anticipate different future price movements. You can group them into three basic categories, such as :
- Reversal
They indicate that the current trend may end and an upcoming reversal price movement.
They signal the price movement may remain the same or an ongoing trend.
- Bilateral
They declare the market is highly volatile, and the price can move either way.
When you want to catch buy trades on the deep, you seek the best bullish reversal patterns.
The best five trading patterns to anticipate buy positions
In this part of the top trading figures, we list to generate ideas of buying in deep or enable catching the most potent buy positions when the piece reaches low after a significant decline.
Morning Star
The Morning Star pattern is a universal figure to catch the most potent buy trades when you mark it near any support level at the finish line of a downtrend. This pattern contains three candles. The first candle will be a sell candle of red body. The next one will be a candle with a small body, either red or green, and wicks on both sides or not. The following candle confirms the pattern formation of a big buy candle with lower wicks. You can check the practical application of this figure from the chart below.
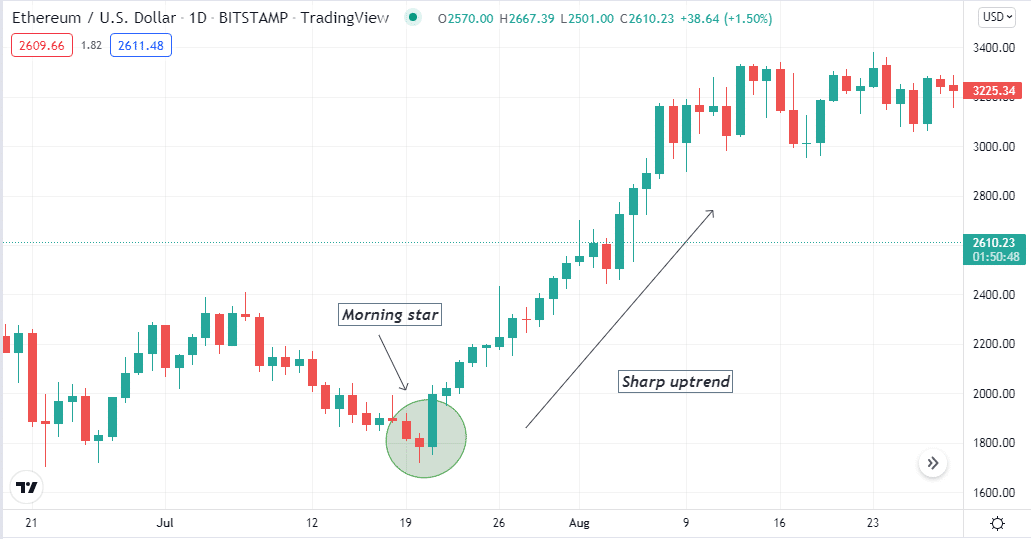
Morning Star pattern
When you spot this pattern near any support level, it signals a possible upcoming bullish pressure on the asset price.
Bullish Harami
The second most potent trading pattern on our list is the Bullish Harami pattern. This formation contains two candles:
- The first candle will be a sell candle or red candle.
- The next candle will be a buy or green candle with a more petite body.
The total formation of the second candle of this pattern will be within the range of the first candle. Harami means “pregnant” in Japanese. Look at the practical application of this figure on the chart below.
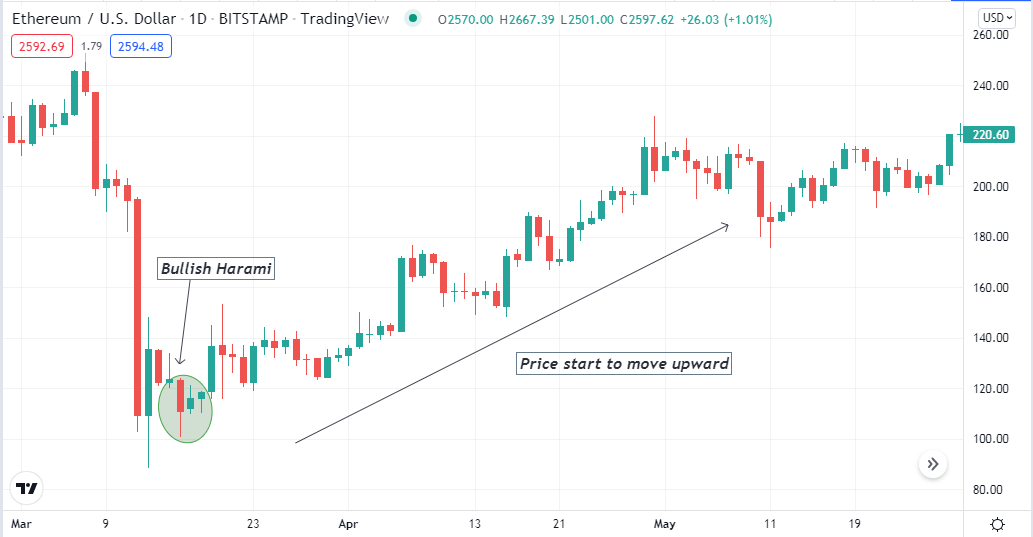
Bullish Harami pattern
When this figure occurs after a downtrend, it signals a bullish reversal.
Double Bottom
The third potential figure on our list is the Double Bottom pattern, which contains many candles.
- First, the price reaches below a support level for rapid selling pressure.
- Then, it surges upside to a resistance level and declines to the first low level.
- Then again, the price goes above the previous short-term resistance, and when it breaks above that level, it confirms the pattern formation, and the price continues to go upside.
Look at the example below for a better understanding.
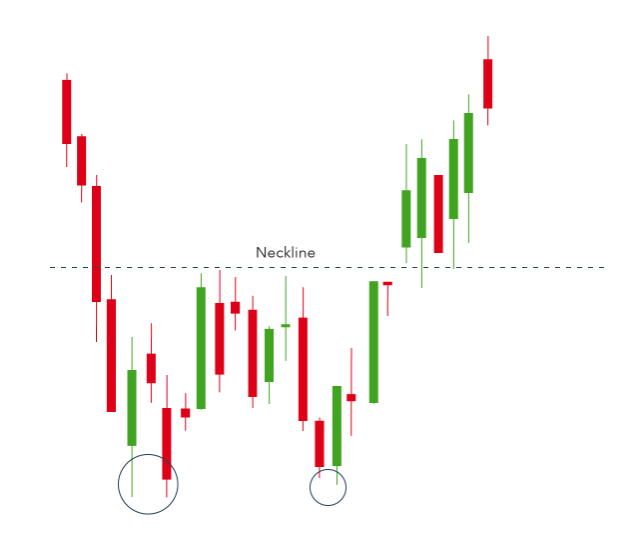
Double Bottom pattern
When you mark this pattern near the finish line of a downtrend or a valid support level, it is practical to catch the most potent buy opportunities.
Bullish Engulfing pattern
The fourth most potent figure to open buy positions on our list is the bullish Engulfing pattern. It is a multi candle pattern containing two candles.
- The first candle is a sell candle after a downward price movement.
- The next candle is a significant buy candle that will be bigger than the previous sell candle, and the closing price of the last candle will be above the range of the previous candle.
The first candle declares the selling pressure is decreasing, and the subsequent buy candle declares significant buy pressure on the asset price.
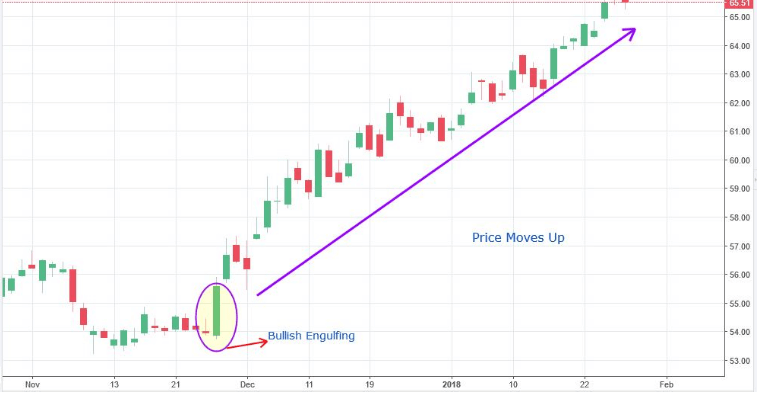
Bullish Engulfing pattern
When this figure occurs near any support level, it indicates an upcoming buying pressure on the asset price.
Piercing line
The last of the top five trading patterns is the Piercing line. It is also a multi candle formation containing two candles.
- The first candle will be a long sell candle, whereas the second candle will be a buy candle.
- The closing price of the second candle will be within the body range of the previous candle.
You can check the practical application of this pattern on the chart below.
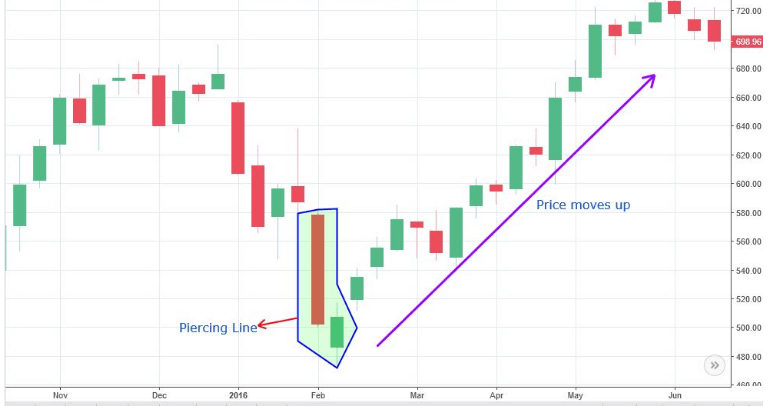
Piercing line pattern
When you mark this figure near any support level, you can expect a significant upcoming buy pressure on the asset price.
Pros and cons
| 👍 Pros | 👎 Cons |
|
|
|
|
|
|
Final thought
These are the five best trading patterns that will allow you to determine best buy positions on any crypto asset. We suggest mastering these formations by checking on demo charts to understand the potential. Moreover, use fair trade and money management while trading using these patterns.


Comments