Crypto adjusted moving average helps investors observe the deviation between the price of underlying assets based on your target asset chart and the rest of the crypto assets charts that any platform represents. So it makes sense that this unique feature of this indicator makes it an attractive technical tool to crypto investors.
However, there is no alternative to learning the basic concept and professional ways to use any technical indicator when expecting to implement the indicator for successful trading. This article will introduce the crypto-adjusted moving average (CAMA) indicator. Moreover, we describe trading strategies using this tool with chart attachments to understand better.
What is the crypto adjusted moving average (CAMA) indicator?
Moving average is a widely-used concept in the financial market, and this concept you can apply to nearly any tradable asset. Financial traders frequently use many standard moving averages, including SMA, EMA, WMA, Tillson MA, Hull MA, etc.
The Crypto adjusted moving average (CAMA) is a custom-made private indicator that uniquely uses this MA concept. It collects info about other crypto-assets and price movement data and then displays it on investors’ charts. Traders usually have to pay to use the premium version of this indicator and enjoy the service.
How to use CAMA for crypto trading?
The indicator uses various market data than other MA indicators, whereas the concept or calculation formula shares similarities. You can use this technical indicator concept as many other MA indicators. Crypto investors can use a particular period’s single or multiple CAMA lines to generate trade ideas. It is common among crypto traders to use two or more CAMA lines and crossover between those lines to catch potentially profitable trades. Otherwise, you can combine the CAMA concept with other technical tools and indicators to identify trading positions.
Short-term trading strategy
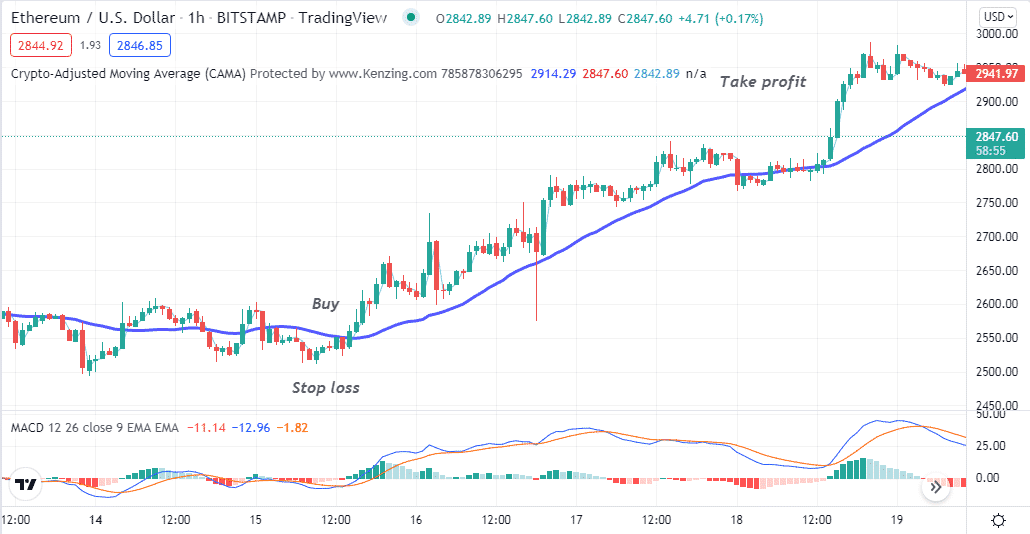
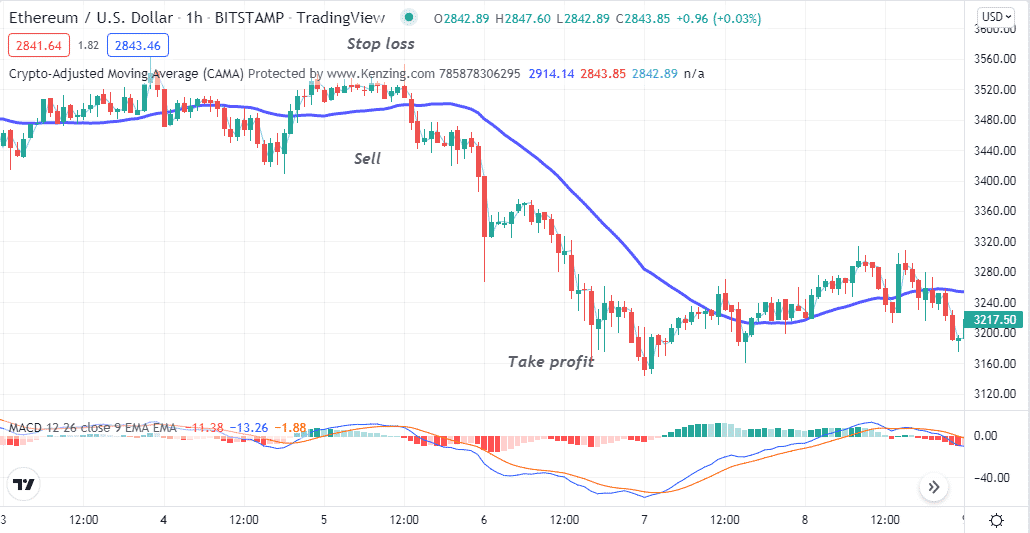
We use a popular momentum indicator, MACD, alongside the CAMA indicator in this trading method. This method contains a CAMA line of 50 periods. At the same time, the MACD indicator shows readings on an independent window containing two dynamic lines and histogram bars on both sides of a central line. You can use this method for many financial assets on various time frame charts; we recommend using a 15 min or hourly chart to catch the most potent short-term trades.
Bullish trade scenario
Set both indicators at your target crypto-asset chart and observe the readings while seeking to open buy positions. When the price reaches near any finish line of a downtrend, check the conditions below:
- The price crosses above the CAMA line.
- The CAMA line starts sloping on the upside.
- The dynamic blue line gets above the dynamic red line, and both lines start sloping on the upside.
- MACD green histogram bars take place above the central line.

Bullish setup
Entry
When these conditions above match your target asset chart, it indicates a potential bullish momentum. Open a buy position.
Stop loss
Place an initial stop loss below the current bullish momentum.
Take profit
Continue the buy order till the price continues to rise. Close the position by checking the conditions below:
- The price drops below the CAMA line, and the CAMA line starts sloping on the downside.
- The dynamic blue line reaches below the dynamic red line at the MACD indicator window.
- MACD red histogram bars take place below the central line.
Bearish trade scenario
Set both indicators at your target crypto-asset chart and observe the readings while seeking to open sell positions. When the price reaches near any finish line of an uptrend, check the conditions below:
- The price crosses below the CAMA line.
- The CAMA line starts sloping on the downside.
- The dynamic blue line gets below the dynamic red line, and both lines start sloping on the downside.
- MACD red histogram bars take place below the central line.

Bearish setup
Entry
When these conditions above match your target asset chart, it indicates a potential bearish momentum. Open a sell position.
Stop loss
Place an initial stop loss above the current bearish momentum.
Take profit
Continue the sell order till the price continues to decline. Close the position by checking the conditions below:
- The price increases above the CAMA line, and the CAMA line starts sloping on the upside.
- The dynamic blue line reaches above the dynamic red line at the MACD indicator window.
- MACD green histogram bars take place above the central line.
Long-term trading strategy
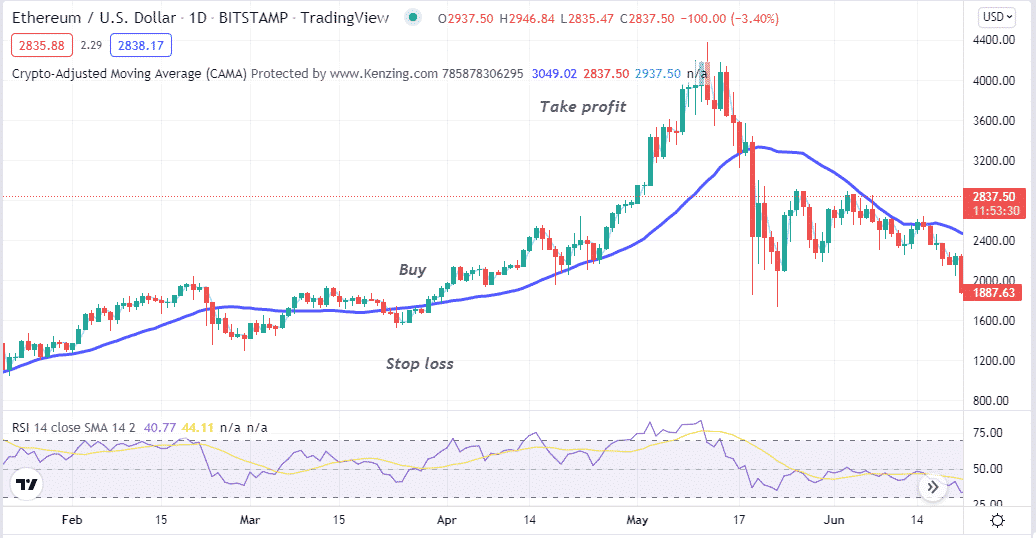
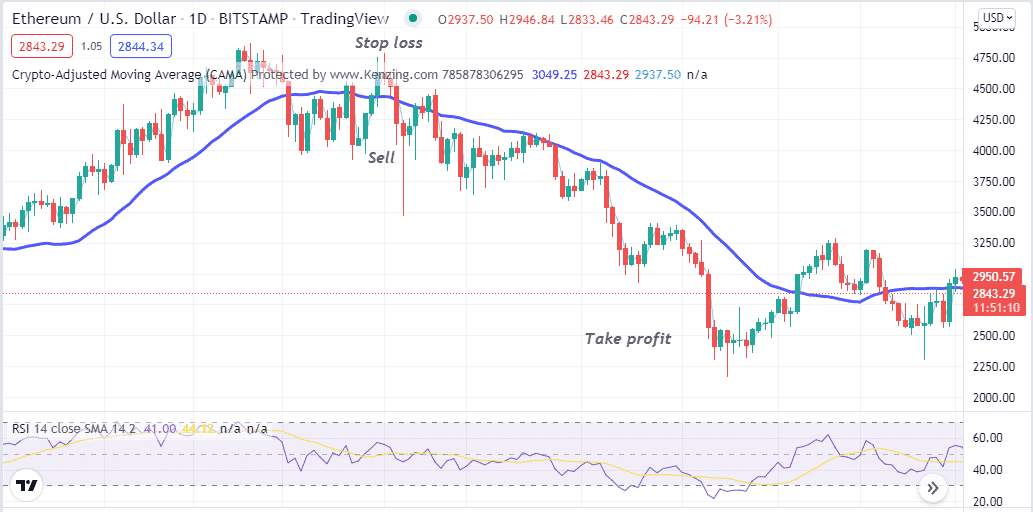
We combine the CAMA concept with another famous momentum indicator RSI in this trading method. We use a CAMA line of 50 periods; the RSI indicator results in an independent window containing a dynamic line floating between 30-and 70, declaring overbought and oversold conditions. We recommend using this method on an H4 or D1 chart to obtain the best results.
Bullish trade scenario
Apply both trading indicators to your target asset chart. Then observe the price movement and both indicators readings, such as:
- The price reaches above the CAMA line.
- The dynamic blue line crosses above the yellow line of the RSI indicator window.
- Both dynamic lines head on the upside.

Bullish setup
Entry
Match these conditions above and open a buy position.
Stop loss
Set an initial stop loss below the recent swing low.
Take profit
Close the buy order by checking the conditions below:
- The price reaches below the CAMA line.
- The RSI (blue) dynamic line reaches below the dynamic yellow line.
- The dynamic blue line reaches the upper (70) level/above or declines below after getting that level.
Bearish trade scenario
Apply both trading indicators to your target asset chart. Then observe the price movement and both indicators readings, such as:
- The price reaches below the CAMA line.
- The dynamic blue line crosses below the yellow line of the RSI indicator window.
- Both dynamic lines head on the downside.

Bearish setup
Entry
Match these conditions above and open a sell position.
Stop loss
Set an initial stop loss above the recent swing high.
Take profit
Close the sell order by checking the conditions below:
- The price reaches above the CAMA line.
- The RSI (blue) dynamic line reaches above the dynamic yellow line.
- After getting that level, the dynamic blue line reaches the lower (30) level/below or increases above.
Pros and cons
| 👍 Pros | 👎 Cons |
|
|
|
|
|
|
Final thought
Finally, the CAMA indicator is a custom-made indicator with attractive features for crypto investors. Don’t rely blindly on any trading indicator while investing in assets like cryptocurrencies.


Comments