
The price movement follows various chart patterns due to participants’ actions on certain price levels. When you can determine those patterns like price action traders, you can make more precious trading positions. You can consider triple top and bottom patterns among the most effective in the family of precious chart patterns.
However, such trading requires learning how to identify that pattern besides methods to execute successful deals. This article will introduce you to the triple top pattern and a complete guideline to make constant profits with its help in the financial market.
What is the triple top pattern?
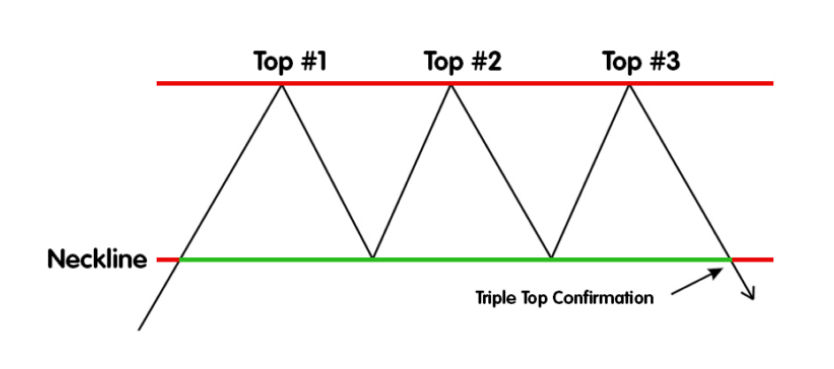
It is a technical price formation that ends any bullish trend, signaling a possible reversal price movement. It consists of three peaks in a row and a neckline or support line to complete the entire formation. The triple top pattern shares some similarities with the head and shoulder pattern, but in this case, the shoulders are similar to the middle top.
The pattern structure
At the initial stage, the price increases to the top, which is the first peak. Then it comes back to a low, which is a possible neckline. After creating the first peak, the price moves similarly and a specific range between the highs and neckline. When the price finishes the formation of three peaks and comes back to the neckline, and breaks below it, it confirms the triple top pattern.
You can make trades using it on a nacked chart. Otherwise, you may combine other technical tools and indicators, such as support & resistance, MACD, RSI, ADX, etc., to get more precious entry/exit positions.
How does the triple top pattern work?
The working procedure of making trades using this pattern can take place by following some steps. It is comparatively easy to trade using this pattern, and you can find this price formation on any tradable financial asset chart, such as forex pairs, cryptocurrencies, commodities, stocks, etc.
The positive part is that it takes time to complete the entire pattern to enter wisely at the market by observing the chart. The working procedure and use of this pattern can achieve by following the steps below.
Step 1. Identify the market swing
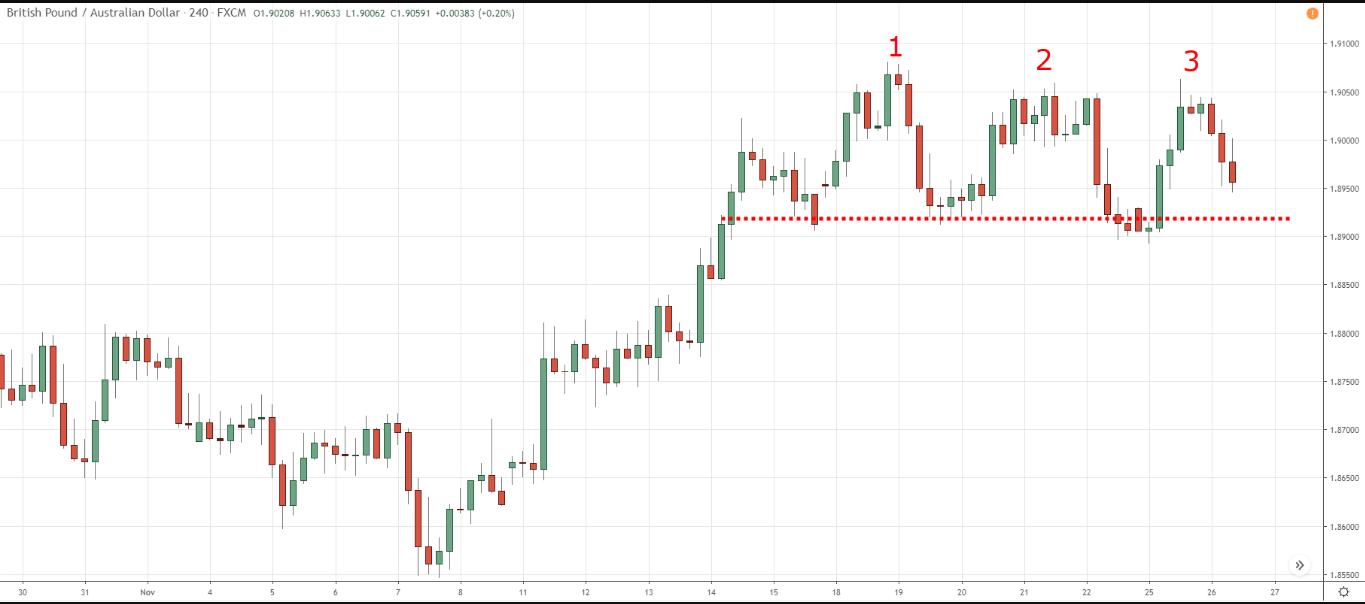
At the very first step or the initiation part, you have to identify the pattern formation. Price makes a top and pulls back to create a support level, which is the first top position of the pattern. After making low, the price again to the top at the same level and declines toward the neckline. That confirms the second peak or the middle top.
Formation of the pattern
Similarly, the price movement will create the third peak. Remember each peak size sill be at the same level; otherwise, you can not classify this pattern as a triple top pattern. Every peak occurs as the buyers try to break above the range but fail, and the price comes back to the support or neckline.
Step 2. Avoid the early entry
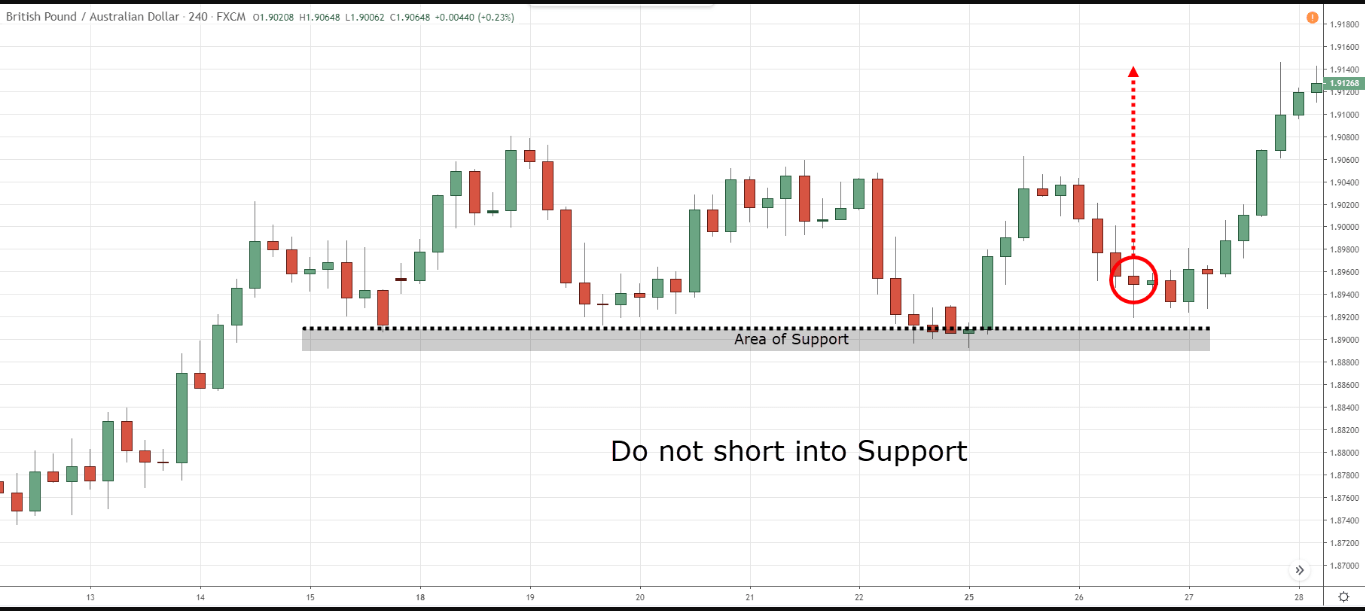
At this point, you may be thinking it is too easy to make a sell entry. That won’t be wise. The pattern completes formation when it breaks the range of consolidation phase of illustrating the entire shape. So wait until a valid breakout occurs below the support level or the neckline.
Not completes the pattern until the breakout
In many cases, the price declines to the neckline and bounces back to the upside. Even the price can reach above the peaks of the pattern. In that case, the triple top is not valid to make profits from sell trades.
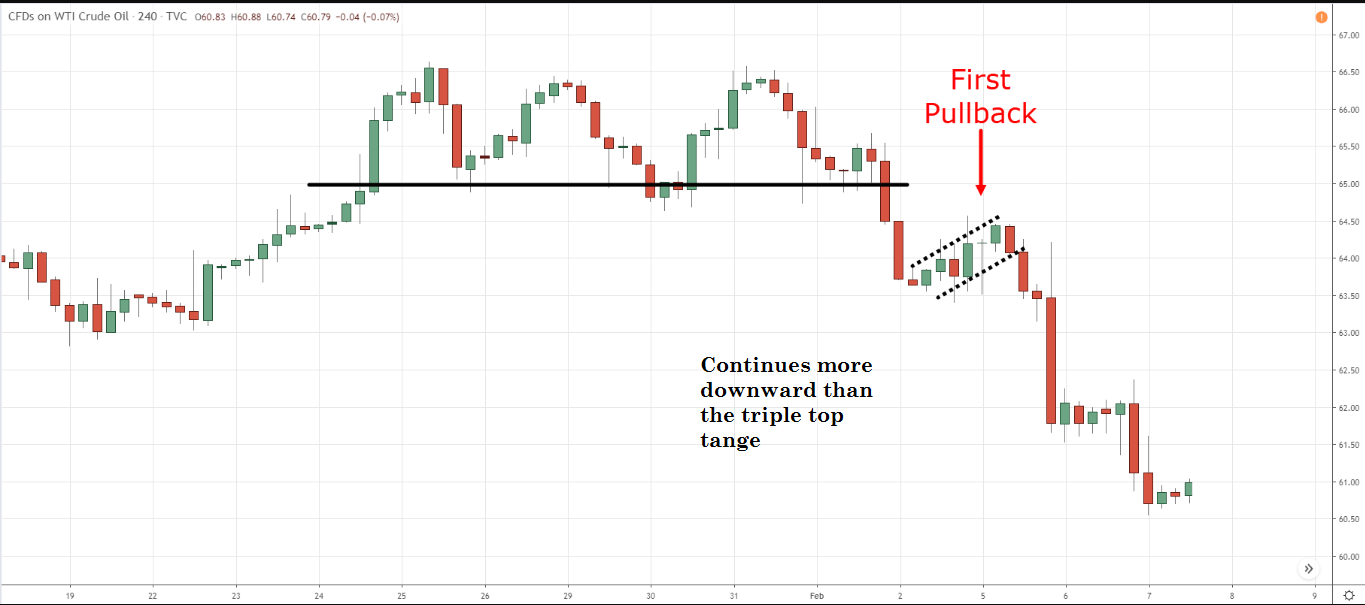
Step 3. Don’t chase the breakout
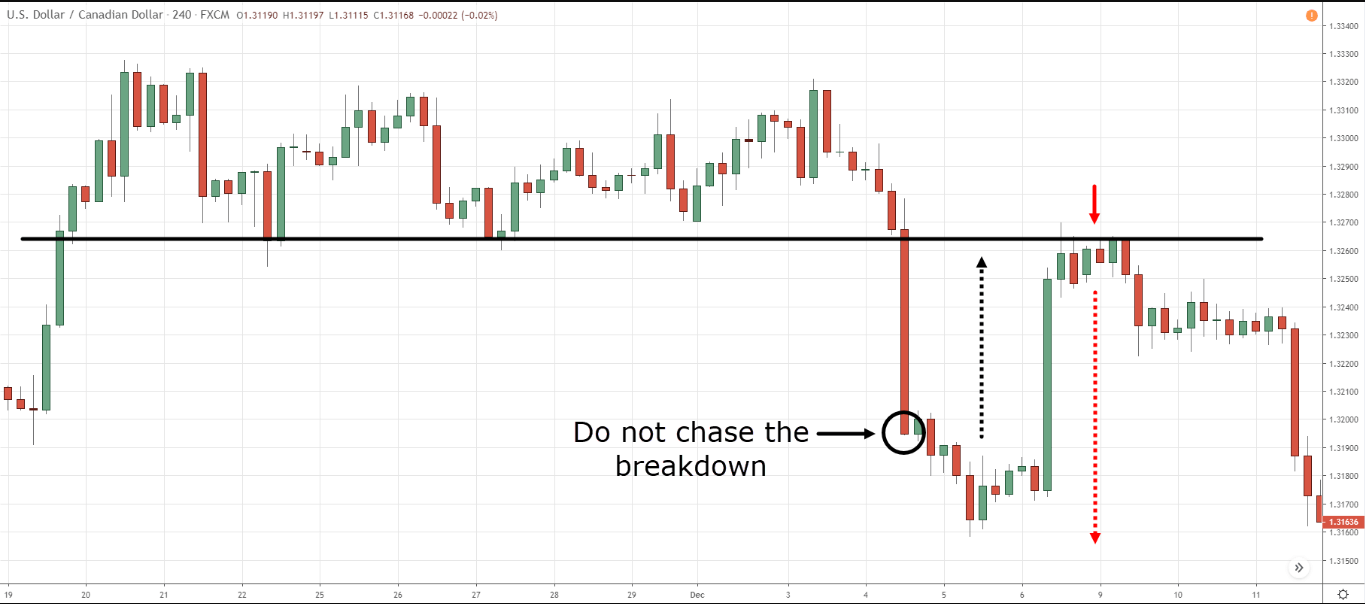
The price may break the support on the downside. That completes the pattern formation. The level below the neckline is suitable to take sell orders. In most cases, the price goes back to the support after the breakout.
Don’t chase it
Remember, an early entry can increase your risk on trading, or you may get less profit than you can make. So don’t chase the breakout candle; you will get chances to place sell orders. After the breakout, try to place a sell order near the neckline.
Step 4. Secure the order
The triple top pattern gives a 1:1 risk ratio trade setup. So the initial stop loss level will be above the third peak or the last swing high. Price can retouch the support line after declining below but never reach the top if it is not a fake breakout.
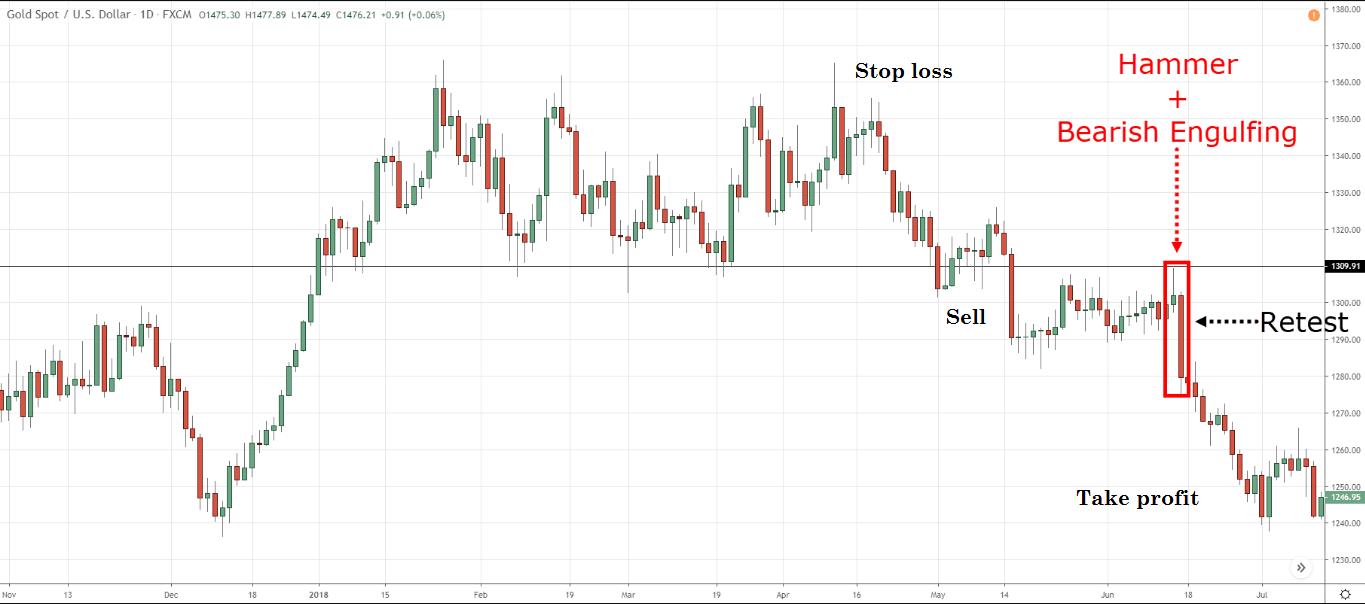
Trade setup
Set a profit target below the same range as the distance between the peaks and the neckline. Wait till your TP gets hit by the price movement.
Step 5. Trade management
The triple top creates opportunities for intelligent financial traders as it has satisfactory winning rates. It signals a bearish reversal from the top.
More declining
So it allows continuing your sell trade until the price remains in the same downtrend. If you continue your sell order below the first TP level, then shift your stop loss near the neckline as a part of trade management and reduce risk. Remember, an early entry can cause you to lose capital.
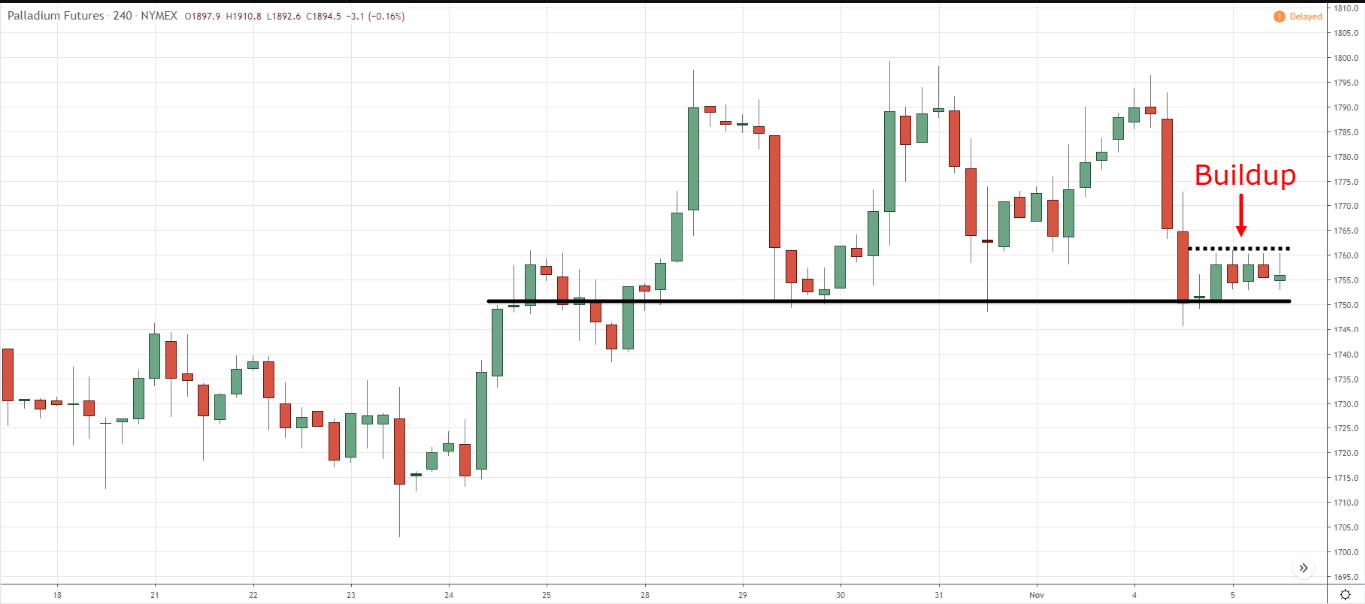
Incomplete pattern and buildup phase
Your profit target can be near the first support level when you continue your sell order, starting the bullish trend before the pattern formation.
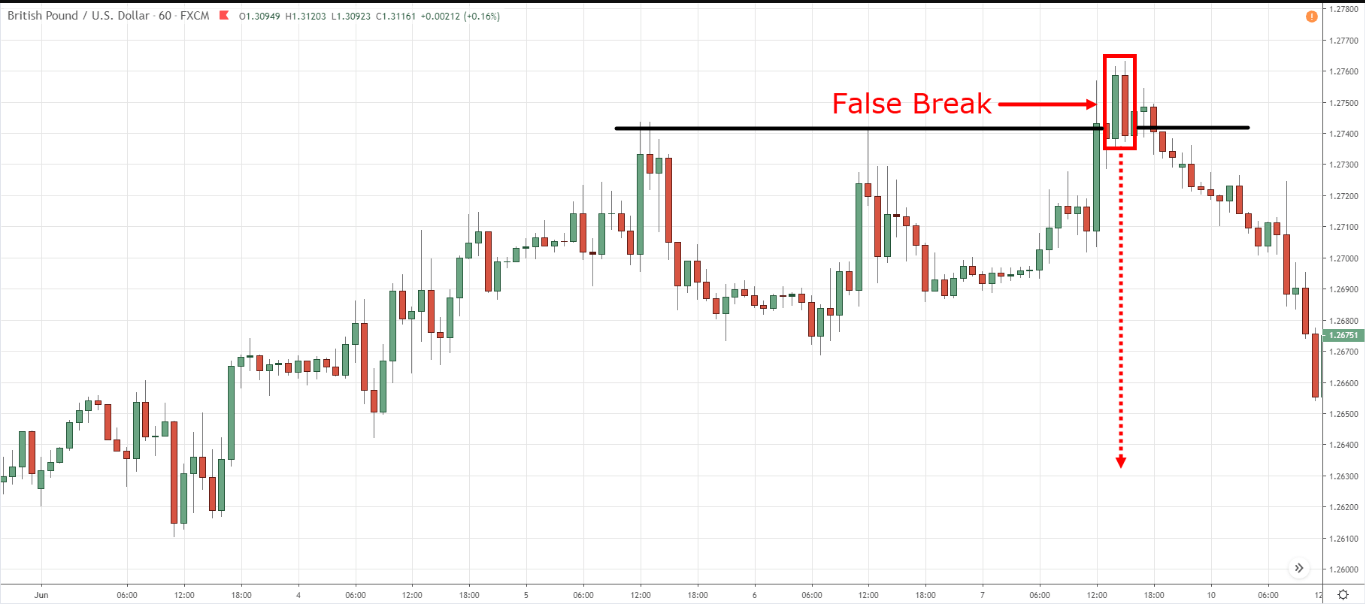
False break
You can close your trade manually or wait until the TP hits the price movement, depending on the market context. Try to use time frames of H1 or above to eliminate fake swing points and catch precious trades.
Final thoughts
This pattern does not appear very often on the FX chart. It is often confused by traders with other patterns that may be similar. Therefore, any top movement should not be mistaken for this pattern. It is good to continue the trend if this happens with reversal formations, not with triangles.
It is essential to wait for the formation of the pattern before opening a trade. The fact is that you can work with this pattern only when all the conditions for its construction are met. Therefore, there should be three touches of the resistance level and four touches of the support level. At the latter, it breaks through and is the beginning of the development of the model.
The triple top pattern is a reversal pattern. Therefore, as soon as you find it, it will be better to cover long positions in the asset. Even if it does not form, you will be able to use it safely and not get losses, but fix positions quickly.


Comments