
Financial trading involves using many technical indicators. Traders should observe the market context and determine trading positions using those indicators. The Commodity Channel Index is a popular technical indicator for market participants.
However, every trading indicator interprets the market context differently by applying different formulas. When you decide to try out any technical tool to execute a successful trading position, there is no alternative to learning the formula before using such a tool.
The following section will briefly discuss the CCI indicator and trading strategies using this indicator. Later, we list the top pros and cons of the CCI indicator.
What is the Commodity Channel Index indicator?
A unique oscillator indicator uses a momentum-based calculation to obtain market context. The developer of this indicator was Donald Lambert in 1980. The CCI indicator identifies trends or extreme pressure on the asset price besides determining the overbought and oversold conditions on the asset price. When you set less period value, the indicator will be more volatile. On the other hand, the larger period will make this indicator smoother. The standard value for this indicator is 20, which most traders use.
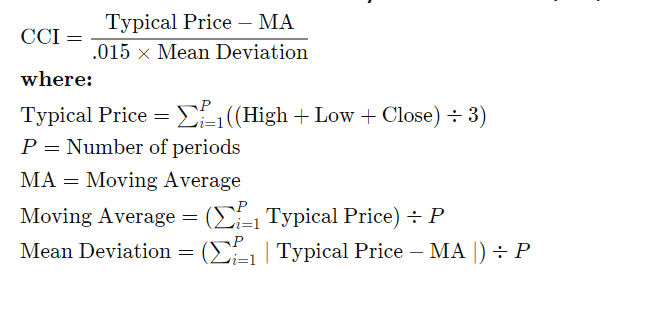
The CCI indicator equation
High value on this indicator declares that the price is above the average price, which means it has positive strength on the asset price to increase more. Meanwhile, negative reading declares declining pressure on the asset price or weakens. The CCI is an unbound oscillator. So it has no limits, can reach indefinitely higher or lower.
How to trade using the CCI indicator
The primary goal of developing this indicator was to determine cyclical turns of commodities. Later, this indicator applies to many assets such as forex pairs, stocks, etc., and other trading instruments. The CCI has different levels to interpret the price movements. This tool simultaneously identifies trends besides extreme strengths and weaknesses.
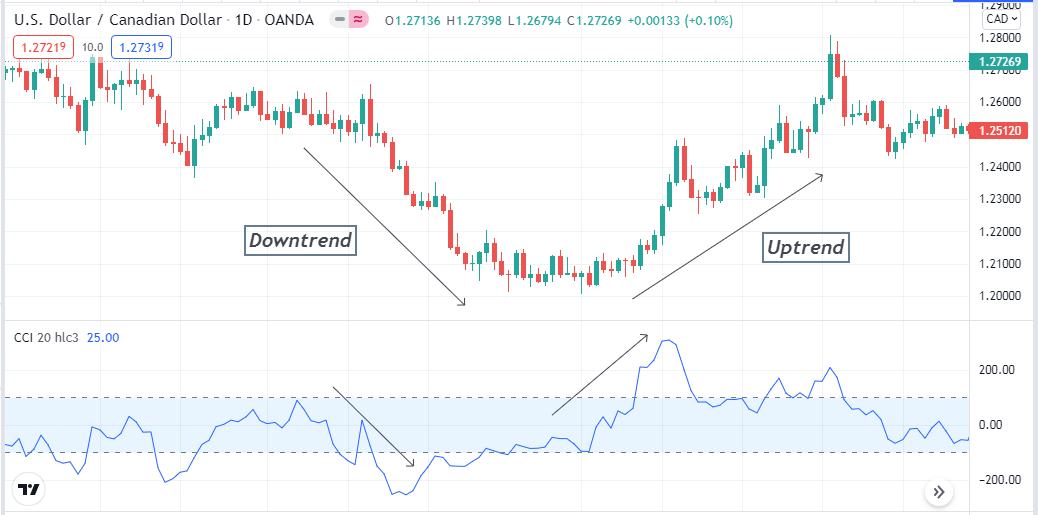
Different phases by the CCI indicator
When the CCI value remains within the range between +100 to -100, it declares a consolidation phase on the asset price.
- Meanwhile, any reading above the +100 level declares the price is at an overbought condition.
- Conversely, reading below the -100 level indicates that the asset price is at an oversold phase.
Traders often consider a sufficient bullish pressure when the CCI line slopes from near zero to +100 or above as a buy signal and vice versa when it slips from zero level to -100 or below. You can use many other trading indicators and combine them with the CCI indicator readings to determine more accurate trading positions or create complete trading methods.
A short-term trading strategy
This short-term trading method uses the Parabolic SAR as a supportive indicator beside the CCI indicator to determine precious trading positions. The Parabolic SAR indicates trends and switching points by dots above or below price candles. A series of dots on different sides declares different trends and switches appearance as the trend changes. It is a suitable method for any trading instrument that has sufficient volatility.
Time frames to use
You can apply this method at any time frame. The preferable time frame is a 15-min chart to get the best results for catching short-term trades.
Entry
When the CCI value reaches above the zero level and heads toward +100, confirm that the Parabolic dot takes place below price candles and starts to make a series. All these matches then open a buy position.
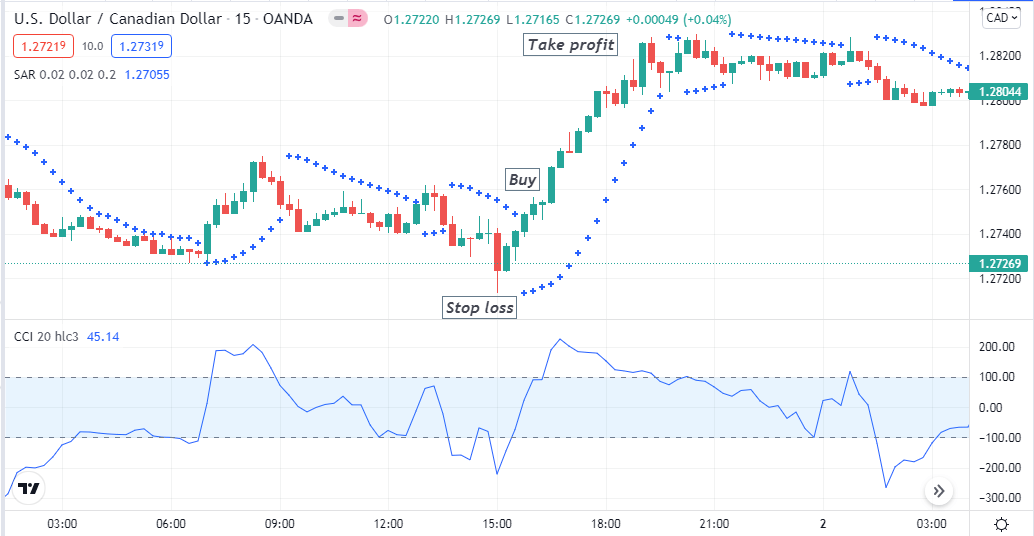
Bullish setup
On the other hand, open a sell position when the exact opposite appearance occurs. The CCI dynamic line will slope from zero to the -100 level, and Parabolic dots will switch on the upside or price candles.
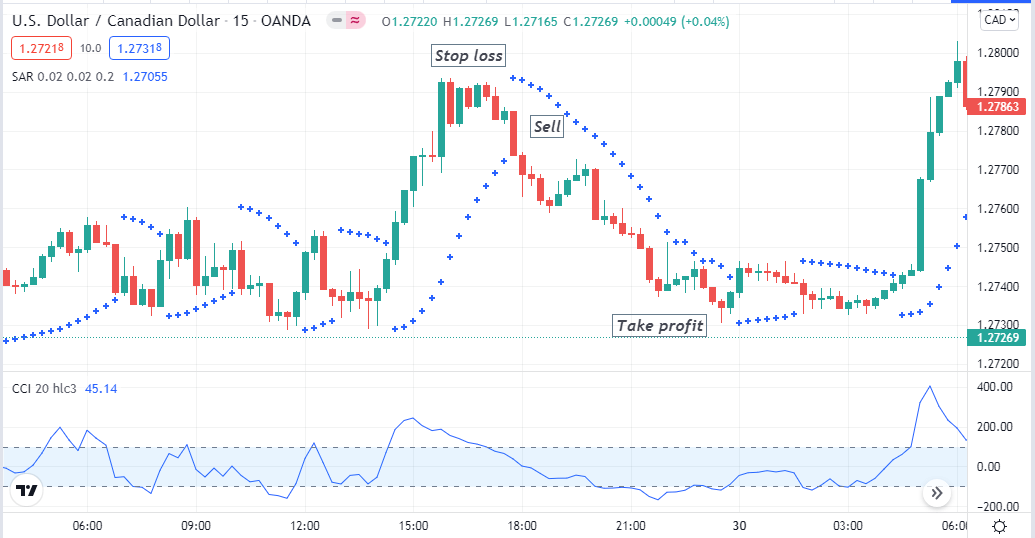
Bearish setup
Stop loss
The initial stop loss levels will be below or above the current swing lows/highs of any buy/sell position.
Take profit
Continue your orders until the current trend remains intact and the price moves in your order directions.
A long-term trading strategy
Our long-term trading strategy uses the EMA crossover concept besides the CCI indicator to sort out entry/exit positions. We use EMA 21 (green) and EMA 50 (blue lines to generate trade ideas. The green EMA crosses above the blue EMA line declaring bullish pressure on the asset price, and remains the same till the uptrend fades. Conversely, the exact opposite crossover occurs between these EMA lines for declining pressure on the asset price.
Time frame to use
While seeking long-term trading positions using this trading method, the preferable time frame will be an H4 or above charts.
Entry
Observe the CCI reading is above the zero line and heads toward the +100 level. Meanwhile, the green EMA line is above the blue EMA, then place a buy order.
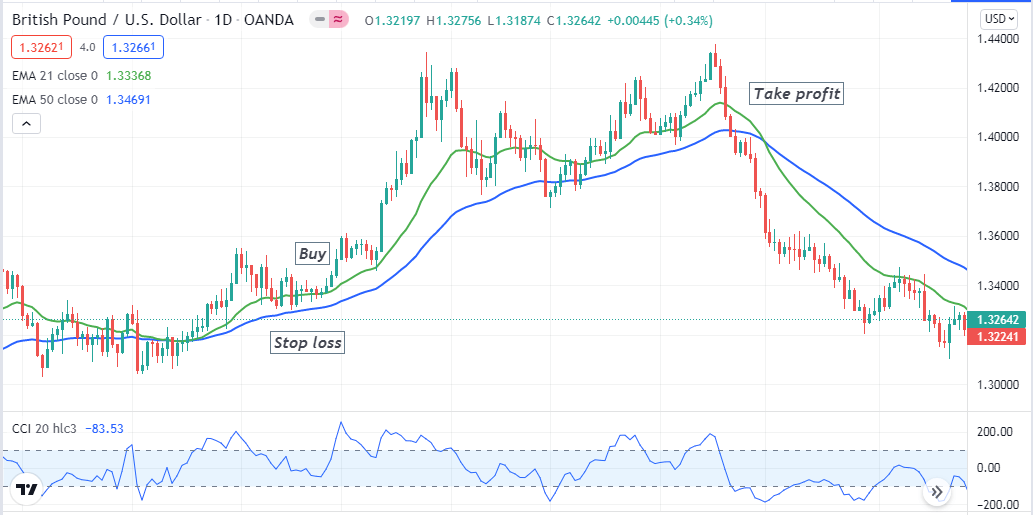
Bullish setup
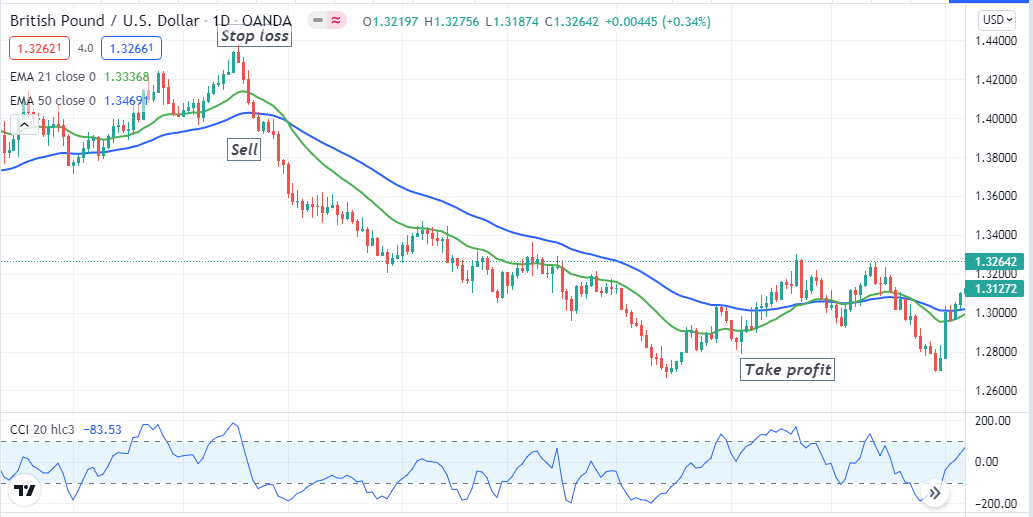
On the other hand, when the green EMA is below the blue EMA and CCI reading is heading toward the -100 level, this trading strategy suggests opening a sell position.
Bearish setup
Stop loss
Place an initial stop loss below the current swing low of your buy order and above the current swing high for your sell order.
Take profit
Observe the market context and continue your positions when the trend strength dooms and price starts to move against your order directions. It is better to use EMA crossovers to close trades. When a bearish crossover occurs, close your buy position. Inversely, close sell positions when the bullish crossover occurs between those EMA lines.
Pros and cons
| 👍 Pros | 👎 Cons |
|
|
|
|
|
|
Final thought
Finally, the CCI indicator interprets the market context very clearly. Financial traders use many other trading indicators with CCI to execute trades. Indicators like on-balance volume (OBV), accumulation distribution line, RSI, MACD, etc., can enable participating constantly profitable trades.


Comments